
1/ MAJOR THREAD on my chart again
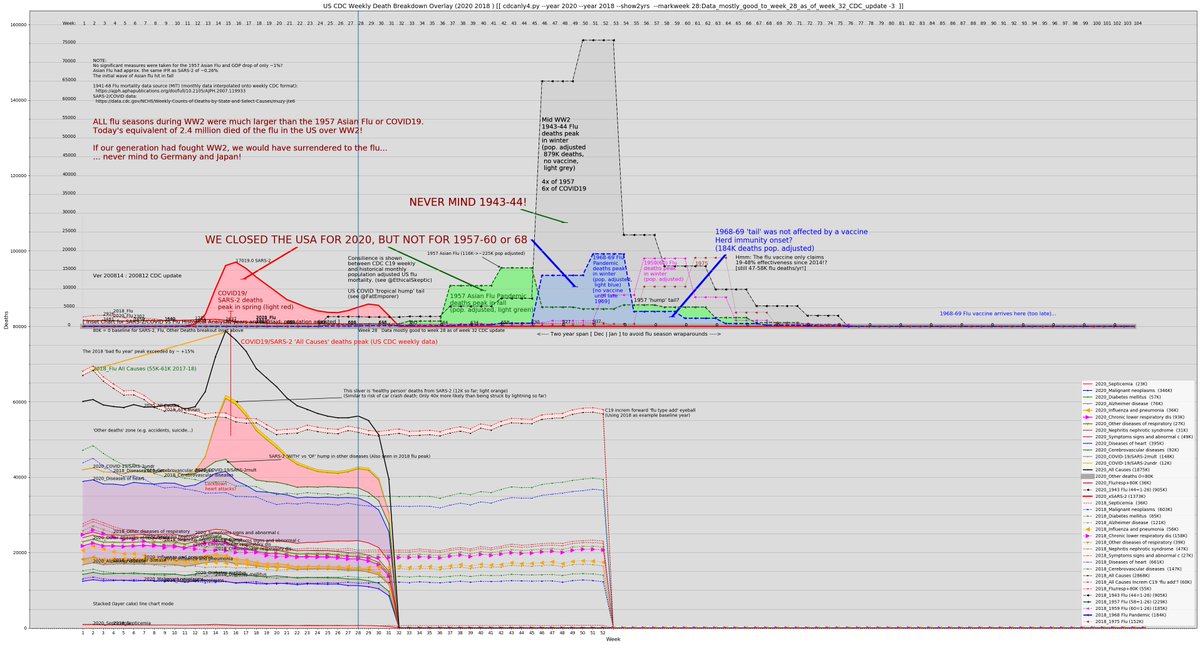
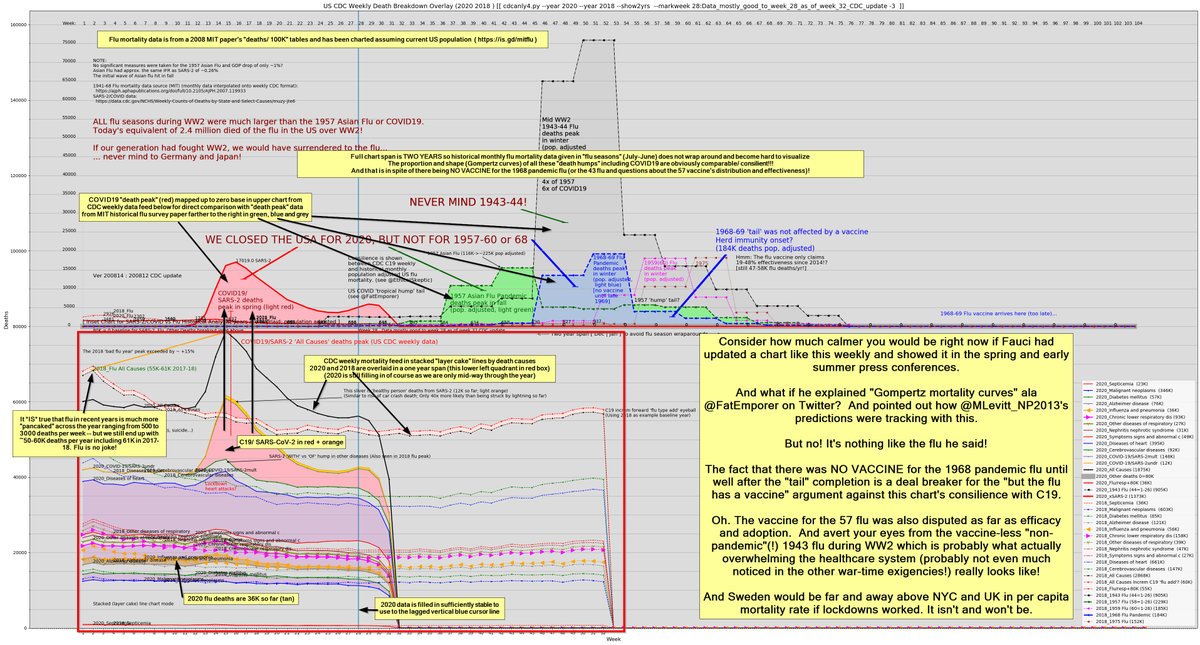
I have found the magnitude and (primarily) Gompertz shape of the C19 virus deaths for the US is entirely comparable/ consilient with the 1957 and 1968 flu pandemics by researching historical flu data. is.gd/mitflu
@EthicalSkeptic
I have found the magnitude and (primarily) Gompertz shape of the C19 virus deaths for the US is entirely comparable/ consilient with the 1957 and 1968 flu pandemics by researching historical flu data. is.gd/mitflu
@EthicalSkeptic

2/ While there isn't great detailed mortality data on the 1918 pandemic -- and there are some interesting questions like how many died of *recommended* aspirin overdoses! -- there is US monthly data on the more recent 1957 and 1968 pandemics.
3/ Both eyeballing these curves and the totals numbers suggest we are experiencing with C19 (red) something very similar to 1957 (green) and 1968 (blue) for which there were no lockdowns and minimal economic damage.

5/ But if #TeamPanic knew this -- and they should have if they have any competence at all -- then they have been withholding this chart from us. Have you seen anything like this chart before?
6/ One key part of the problem we are dealing with regarding #TeamPanic in addition to the ad hominem fusilades (@AlexBerenson knows ;) is that they worship lockdown as an "unfalsifiable" god and saviour -- paging Karl Popper.
7/ But of course this is really a totalitarian -- or as I have seen it called by Styx "coronatarian" -- propaganda campaign to subdue the uppity population that was apparently prospering too much lately and needed a comeuppance.
8/ And then there are also the latest #TeamPanic psyop "look squirrel" tactics with #Casedemic's as per @FatEmporer ...
9/ and the continued dishonest data laundering to stretch out the panic as identified by @EthicalSkeptic. Who'd a thunk it?
10/ So we know that #TeamPanic will of course argue against this chart if they don't outright ignore it. My guess is the latter. But if not ...
11/ ... I expect the main (non ad hominem) arguments to minimize the importance of C19's Gompertz curve and magnitude match with the 57/68 flus on my chart are going to be:
12/
1) There were vaccines for 57/68 so those curves are artificially small and C19 will therefore grow to something bigger
2) The lockdown gods "saved us" so if we release lockdown we will spin out of control
1) There were vaccines for 57/68 so those curves are artificially small and C19 will therefore grow to something bigger
2) The lockdown gods "saved us" so if we release lockdown we will spin out of control
13/ Regarding there being vaccines for 57/68 I have found that for 68 there WAS NO TIMELY VACCINE. It arrived around Aug 69 which was post tail when you look at my chart!
archive.is/cr9cJ
archive.is/cr9cJ
14/ And ironically, the 57 flu killed MORE than 68 but had a (apparently disputed in efficacy and distribution) vaccine.
Note that the data in the paper are given in monthly deaths/ 100K and have been properly adjusted onto my chart and matched with other sources for 57.
Note that the data in the paper are given in monthly deaths/ 100K and have been properly adjusted onto my chart and matched with other sources for 57.
15/ So at least 68 knocks a large hole in that argument just leaving the question of why was 43 so large?
16/ Guesses would be the strength of the strain and the fact that docs were drafted and everyone in general during the war were distracted with bigger concerns! A system truly overwhelmed I think.
17/ As I note on the chart, I think if our generation had fought WW2, we would have surrendered to the flu -- never mind the Axis powers! Instead, this is what is actually happening in the US for perspective:

18/ As this paper with the (monthly -- hence the blockiness of the historical curves) flu death data points out, pandemic vs non-pandemic labeling is misleading about impact.
ajph.aphapublications.org/doi/pdf/10.210…
ajph.aphapublications.org/doi/pdf/10.210…
19/ Also, general flu impact has been trending lower even before flu vaccines as the paper shows. So 43 was also obscured by its "non-pandemic" labeling.

20/ It also points to another paper that fails to find a correlation between increasing flu vaccinations after 1980 with lowered flu mortality!
pubmed.ncbi.nlm.nih.gov/15710788/
pubmed.ncbi.nlm.nih.gov/15710788/
21/ Instead it speculates about building natural immunity from 68 to 80 and then seeing no effect from widening vaccinations through 2001!
22/ So NVM that a C19 vaccine would be the first for a coronavirus so we shouldn't count our chickens early ...
23/ ... but we have building evidence that the recent T-cell speculation regarding a lower C19 HIT may have application in the history of the flu -- more consilience! @EthicalSkeptic
24/ So that leaves the "lockdown gods".
25/ To start with it's clear that there was NOTHING resembling lockdown for 57/68 so with the flu vaccination argument punctured they will have to argue differently.
26/ It will have to be MORE OF that the flu is a minor thing in spite of 1918, 1943, 57/68 and the US still having 50-60K flu deaths per year even WITH a vaccine.
27/ BTW, if masks work then why haven't they been mandated for the flu? Is the cut line at 160K deaths for C19 but 50-60K deaths for US flu are just an annoyance? I know, I shouldn't give them ideas...
28/ The dirty secret starts to surface that the flu is bigger than they admit and may have heavily been reduced by mechanisms such as T-cells rather than just or even mostly vaccination.
29/ Did you know that even the *claimed* efficacy for flu vaccine since 2014 has only been in the 20-50% range?

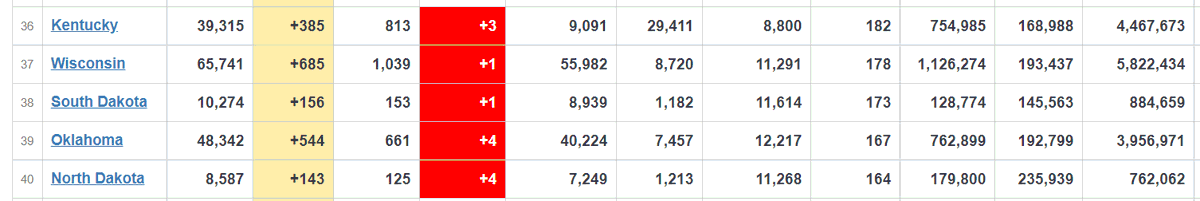
30/ And then there's our #TeamReality argument that "Sweden didn't lock down" and they are at least no worse in deaths/ 1M than many other EU countries that did like UK and Spain. (BTW, take a look at no lockdown South Dakota at deaths/M 1/10th of NY and 1 death today.)
31/ The more clever lockdown cultists argue that Sweden really DID meaningfully lock down -- and there's some truth in that. But it clearly locked down at least substantially less including when looking at mobility data.
32/ In that regard, @TTBikeFit has a new thread that really all by itself should end the arguments for lockdown that revolves around placing Sweden on a lockdown stringency scale. Lockdown correlation? What correlation?
33/ There is also the #TeamPanic argument that Sweden is less dense than NYC so it would have been as bad as NYC if that were not the case.
34/ But now we have new data from @yinonw showing that less locked down and more dense Stockholm has fared at least marginally better than more locked down and less dense New York State! Hmmm...
35/ And Sweden is holding in the low deaths tail while releasing what measures they have taken faster than NYS and certainly than NYC.

36/ And don't forget this comparison. Same result.
One from cluelessly -- and too late in any case -- locked down Cuomo.
One from considered though not perfect Swedish action.
One from cluelessly -- and too late in any case -- locked down Cuomo.
One from considered though not perfect Swedish action.

37/ BTW, is there anyone still left in NYC to release? Is that receding "southern tail" on US deaths also partly tinder from the New York exodus? ;)
38/ And of course for more standard #TeamReality fare, let's not look at lock down and mask crazed Peru's less than stellar performance, shall we?
39/ So we will see but for now: WHOOPS!
Pipe. Put data in. Smoke.
P.S. But not with a mask on of course or you might catch fire in addition to "mask mouth" LOL
Pipe. Put data in. Smoke.
P.S. But not with a mask on of course or you might catch fire in addition to "mask mouth" LOL

