
Dear Friends,
#ExitRules
#TrailSL
#Announcement
#ssstockalerts
If your are a positional/swing/long trader, then it is for you.
Added multiple portfolio support to the system.
What is use of having multiple?
Track multiple stocks based on ur criteria.
Add exit rules.
#ExitRules
#TrailSL
#Announcement
#ssstockalerts
If your are a positional/swing/long trader, then it is for you.
Added multiple portfolio support to the system.
What is use of having multiple?
Track multiple stocks based on ur criteria.
Add exit rules.

Exit rules:
Set your own exit rules for your each portfolio.
What is exit rule?
Define a rule for exit, When you want either book profit/loss and come out of the trade.
Eg: For my short term portfolio, I want exit stocks which closing below 50SMA.
Set your own exit rules for your each portfolio.
What is exit rule?
Define a rule for exit, When you want either book profit/loss and come out of the trade.
Eg: For my short term portfolio, I want exit stocks which closing below 50SMA.

What is the use of exit rules?
- U no need to analyse your portfolio stocks constantly.
- Define a rule/Multiple rules which ever works for you then System automatically send an email to when ever a stock from portfolio matched to ur exit rules.
- Do once, and check ur mails
- U no need to analyse your portfolio stocks constantly.
- Define a rule/Multiple rules which ever works for you then System automatically send an email to when ever a stock from portfolio matched to ur exit rules.
- Do once, and check ur mails
Eg:
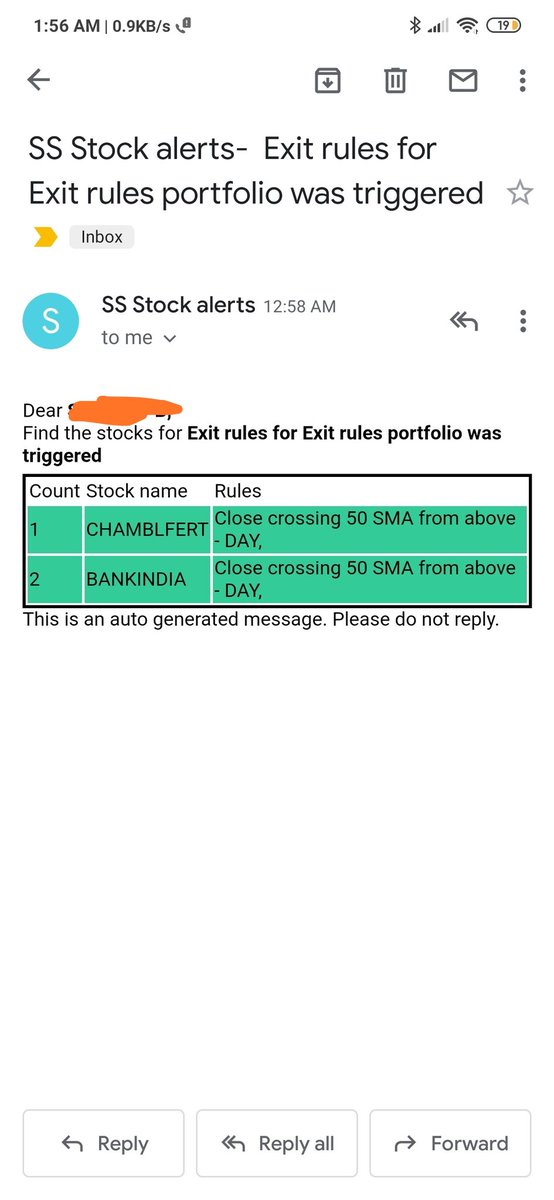
I bought BANKINDIA at 35rs, I want to trail my stock till my exit rule/rules.
As part of my portfolio added Price closes below 50SMA rule.
System will give u an alert when my portfolio stocks closed below 50SMA.
Today BANKINDIA met this rule, I got an email alert 4 it.
I bought BANKINDIA at 35rs, I want to trail my stock till my exit rule/rules.
As part of my portfolio added Price closes below 50SMA rule.
System will give u an alert when my portfolio stocks closed below 50SMA.
Today BANKINDIA met this rule, I got an email alert 4 it.

Dear Friends,
By default system has more than 240 rules are available for daily, weekly and monthly.
U can use any rule based on ur choice.
If there isn't any suitable rule for u, contact us will help you with that
By default system has more than 240 rules are available for daily, weekly and monthly.
U can use any rule based on ur choice.
If there isn't any suitable rule for u, contact us will help you with that
• • •
Missing some Tweet in this thread? You can try to
force a refresh


