SSStockAlerts Profile picture
Sep 3, 2020 5 tweets 3 min read Read on X
Started reading the A complete Guide to Volume Price Analysis
#book #VPA

Based on my understanding created below patterns
1. Price and volume raising
> Bullish: price closes above the previous candle and volume is greater than previous candle.

@PAVLeader ImageImage
2. Price and volume falling
> Bullish: price closes below the previous candle and volume is less than previous candle.

3. Price falling and volume raising
> Bearish: price closes below the previous candle and volume is greater than previous candle.
4. Price raising and volume falling
> Bearish: price closes above the previous candle but volume is less than previous candle.

- For intraday, look for daily pattern.
- For short term, look for weekly pattern
- For long term, look for monthly pattern
Dear friends,

Very good strategy/pattern from "A complete Guide to Volume Price Analysis"

1. Bullish U turn price reversal
Higher high and Higher low than candles on either side. Possible short term reversal in the price. Image
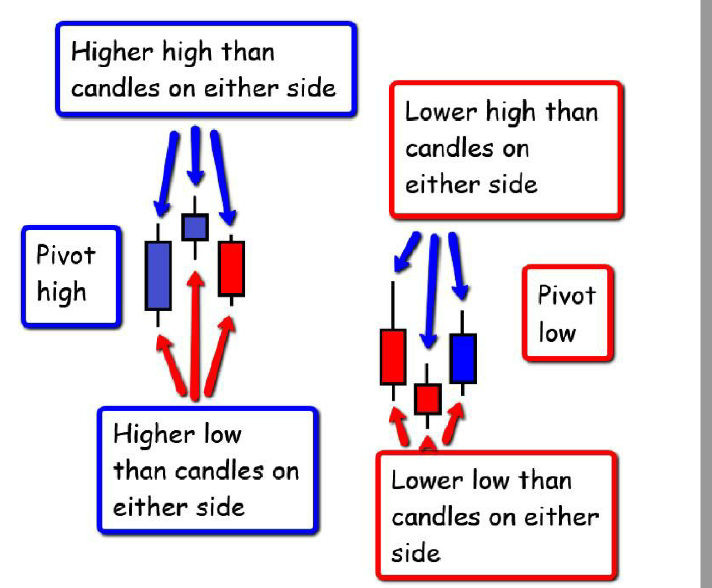
2. Bearish U turn price reversal
Lower high and Lower low than candles on either side. Possible short term reversal in the price.

Will be added these patterns to the system today. ImageImage

• • •

Missing some Tweet in this thread? You can try to force a refresh
 

Keep Current with SSStockAlerts

SSStockAlerts Profile picture

Stay in touch and get notified when new unrolls are available from this author!

Read all threads

This Thread may be Removed Anytime!

PDF

Twitter may remove this content at anytime! Save it as PDF for later use!

Try unrolling a thread yourself!

how to unroll video
  1. Follow @ThreadReaderApp to mention us!

  2. From a Twitter thread mention us with a keyword "unroll"
@threadreaderapp unroll

Practice here first or read more on our help page!

More from @ssstockalerts

Nov 22, 2020
Strategy: Daily price close above Monthly pivot

1. Trade can initiate the next day opening price with 1% or 2% of stock price as SL.
2.Risky Traders can enter into trade at 3.15 to 3.20 pm on the same day when price crosses above the monthly pivot point. ImageImage
3. Target can be 2% or 3% or 4%
4.When we back tested with 2% SL and 4% target given the best results.
5.User can keep any of these risk rewards
Risk reward ratio: 1: 2
Risk reward ratio: 1: 3
Risk reward ratio: 2: 4(Given the best results)
6.User can close the trade with in 3 days if they achieve target or if SL hits.
7.If user wants to continue the trend then SL should be moved only when they achieved initial target.
8. You can add any other indicator for confirmation eg: SMA 20, ADX > 25.
Read 8 tweets
Oct 21, 2020
Dear FriendsDear friends,
If any know about the "Mark Minerv" Template for stock selection. I have implemented that template as scanner in our site.

Mark Minerv template is modified with small conditions by Manas Arora bro. Implemented scanner for below image.
#enhancement
The scanner is available in the
ssstockalerts.in/stocks/view/#/…

Scans -> Investment patterns -> High Momentum pattern.

Conditions to qualify stocks in this criteria:
1. Min price should be greater than 30
2. The current price must be at least 50% above 52 weeks low.
3. The current price must be within 25% of the 52 weeks high.
4. The current price must must be trading above 50-day and 50sma > 200 sma.
5. Every 6 weeks should have made new high. so check last 6weeks price is greater previous 6 weeks high price.
Read 5 tweets
Sep 22, 2020
Dear Friends,

Implemented system to scan the bullish and bearish candlestick patterns
#backtestwithureyes
Eg: U can scan for Dragon fly doji, u will get the list.

Once u get the list, click on any stock and see the chart
Eg: Today scan found #BLUESTARCO Image
Now open the chart of #BLUESTARCO,

> Now click on patterns > candlestick > dragon fly doji pattern
> It will highlight on the chart where it occurred in the past also.
> Now u can check whether this pattern is respecting this stock or not.
> It is easy to backtest with ur eyes. Image
> U can check the same thing for Daily/Weekly/Monthly also.
> Once u found , stock is respecting this pattern then take position based on that.

#ssstockalerts
ssstockalerts.in/stocks/view/#/…
Read 4 tweets
Sep 21, 2020
Dear Friends,
@Stockengg
@ProdigalTrader
@PAVLeader
#New
Relative Strength scanner

1. Stock outperforming Nifty index
Stock is outperformed than nifty index in 52 period.

2. Stock underperforming Nifty index
Stock is under performing than nifty index in 52 period. ImageImage
What it means?
These stocks outperformed nifty and changed more percentage than nifty.

How it is calculated?
> Get the stock change% since 52weeks low
change% = (latest close - 52weekslow)*100/52weekslow

>Relative Strength = stock change%/index change%
Nifty close: 11250, low: 7551
Nifty change%=48% (11250 - 7551)*100/7551

BALAXI change% = 1321%
Relative strength = 1321/48 = 27

ASIANPAINTS change% = 37.82%
Relative strength = 37.82/48 = 0.78

Relative strength value which is greater than 1 means it is outperforming nifty.
Read 4 tweets
Aug 31, 2020
Dear Friends,

When I was new to trading, I was not sure how to draw about the support and resistance lines.

Was looking for a system to draw automatically support and resistance. But those systems are not for free and had limitation for free use.
It is better to draw manually so we can learn how to do that. Once u practice it, it become simple.

However, I decided to implement draw support and resistances automatically.

I believe this will be most useful, at least for me.

Check the stockinfo page
Toolbar has option to select how many support/resistance lines u want see.

eg chars are here
#ssstockalerts ImageImageImage
Read 5 tweets
Aug 27, 2020
#ExitRules
After a good entry, it is equally important important to exit from a trade.
Below rules
1. Price close below 20/50/100/200SMA or EMA
2. Price closes below Last week/Month close
3. Close below Donchain middle band from above.
5. ADX DI < -DI
6. Vortext +VI < -VI
7. Bearish Engulfed/Maruboju at Weekly candle
8. Close below Bolinger Lower band
9. CCI oversold
10. CMO oversold zone
11. RSI
12. EMA reverse alignment (50 > 20 > 5EMA)
13. Making LHLL
14. Positional Sell(EMA 50 > 20 > 5 > LTP) and CCI < -100
15. MACD moving below Zero
16. MFI crossed below 20
17. Price close below last month close
18. Stochastic oversold zone
19. Willams %R bearish

How to add them as your exit rules?
> Create a portfolio and add ur stocks
> Add any of the above(lot more available) rules and save.
Read 5 tweets

Did Thread Reader help you today?

Support us! We are indie developers!


This site is made by just two indie developers on a laptop doing marketing, support and development! Read more about the story.

Become a Premium Member ($3/month or $30/year) and get exclusive features!

Become Premium

Don't want to be a Premium member but still want to support us?

Make a small donation by buying us coffee ($5) or help with server cost ($10)

Donate via Paypal

Or Donate anonymously using crypto!

Ethereum

0xfe58350B80634f60Fa6Dc149a72b4DFbc17D341E copy

Bitcoin

3ATGMxNzCUFzxpMCHL5sWSt4DVtS8UqXpi copy

Thank you for your support!

Follow Us!

:(