Thread: Adaptive Moving Average (AMA)
AMA is an indicator devised by Perry Kaufman explained in his book Trading System and Methods. It is also known as Kaufman’s Adaptive Moving Average (KAMA).
#AMA #Adaptivemovingaverage #indicators #definedge
AMA is an indicator devised by Perry Kaufman explained in his book Trading System and Methods. It is also known as Kaufman’s Adaptive Moving Average (KAMA).
#AMA #Adaptivemovingaverage #indicators #definedge
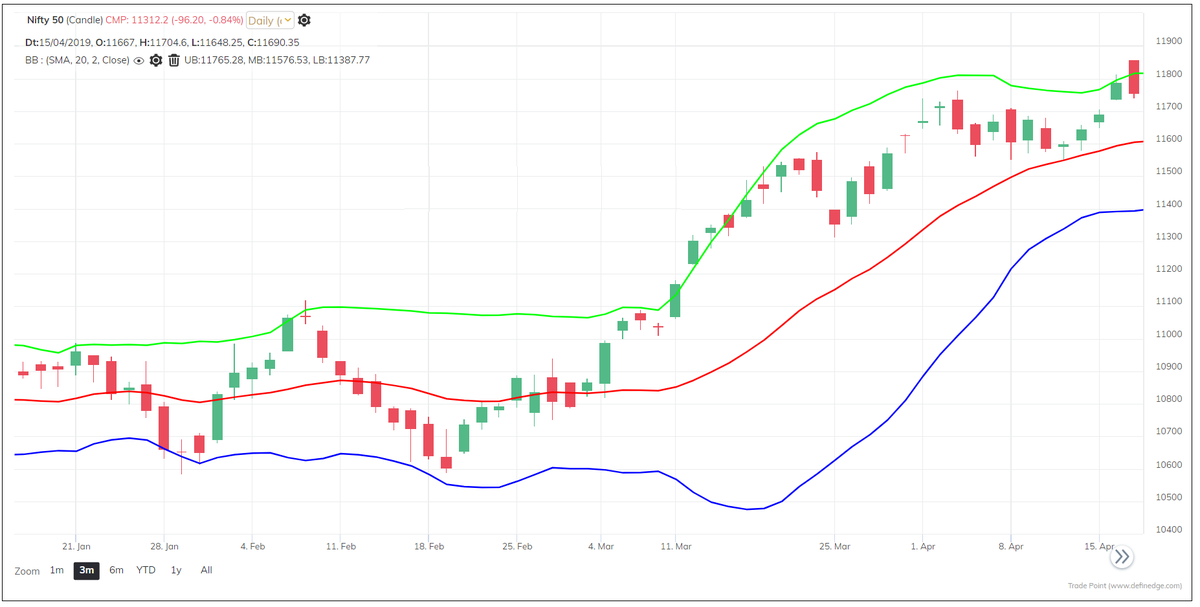
Rate of change (ROC) is a study that measures how much price moved up or down from previous bar. The daily rate of change captures the trend. When we make it absolute, captures volatility.
Meaning,
Price went up or down by 10 points = trend
Price moved by 10 points = volatility
Meaning,
Price went up or down by 10 points = trend
Price moved by 10 points = volatility
So, a price move that shows us a trend, also shows us range. When price is trending, and range is high it reflects strong trend & momentum. When price is not moving in a direction, but range is high, the volatility or noise is more.
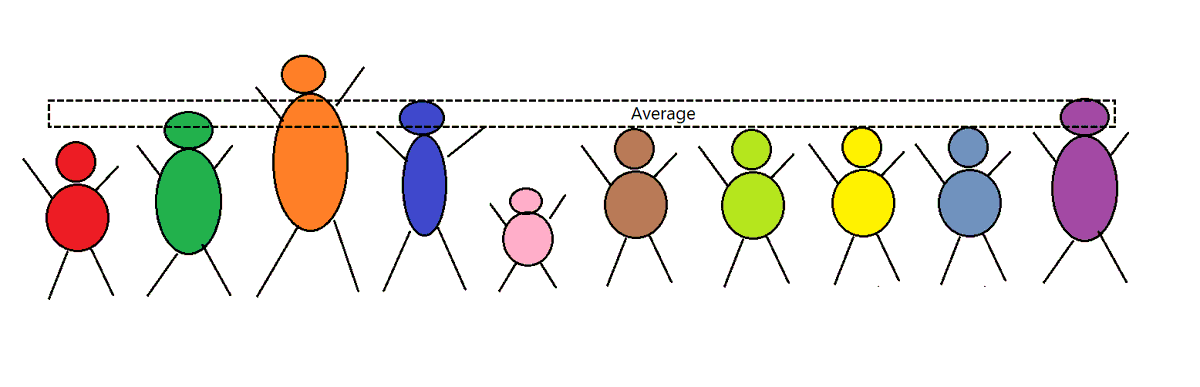
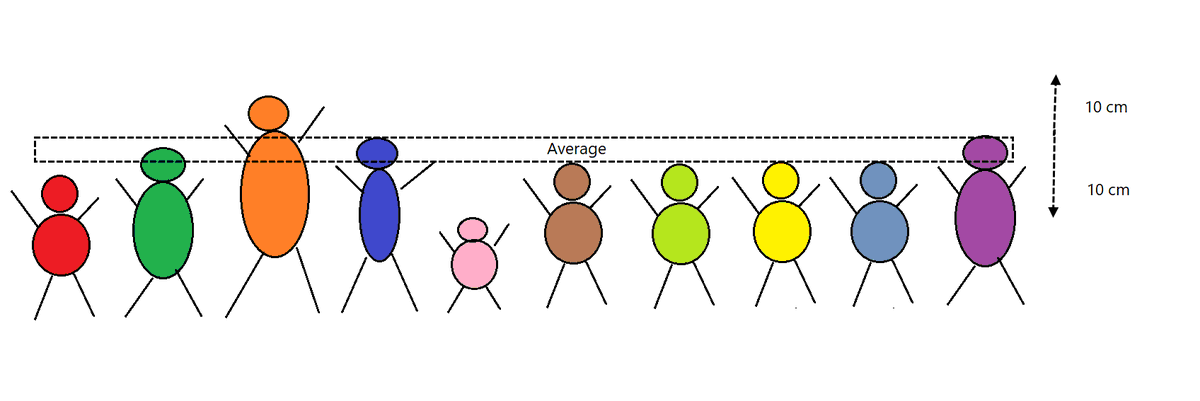
Image shows price fluctuation over 10 bars
Image shows price fluctuation over 10 bars
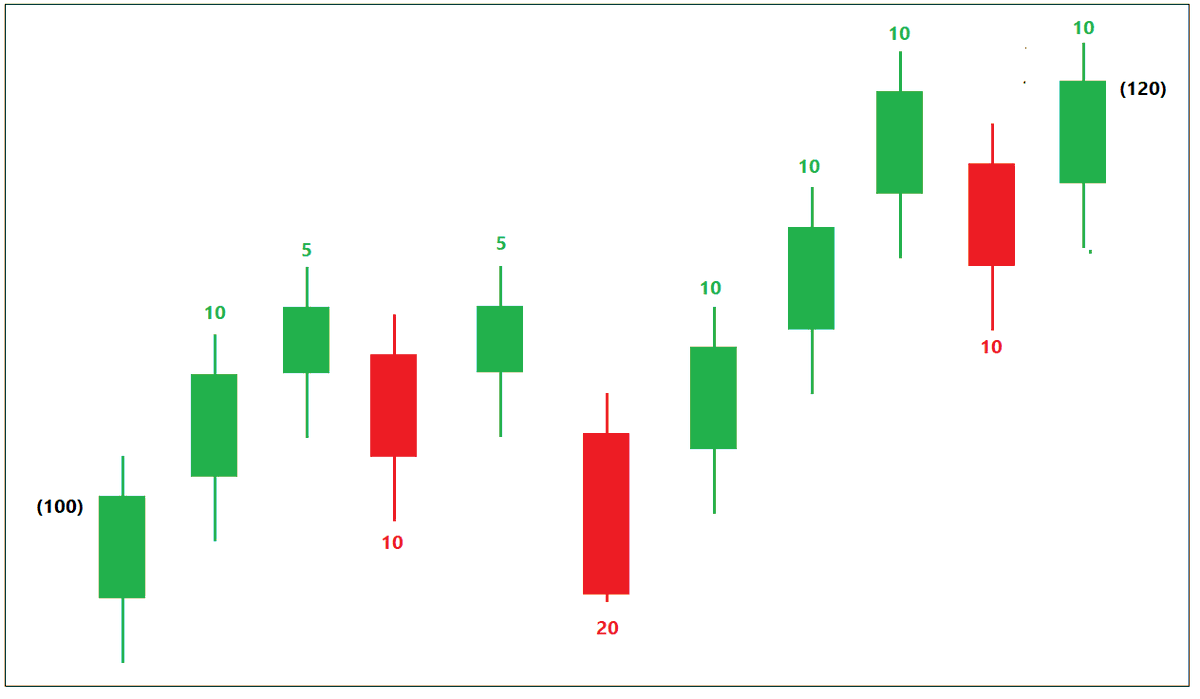
Let us calculate total of daily absolute ROC:
100 = (10+5+10+5+20+10+10+10+10+10)
So, during last 10 sessions, total of daily movement is 100 points. Volatility? Let's call it Noise.
Total movement was of 100 points. But over the 10 sessions price went up from 100 to 120.
100 = (10+5+10+5+20+10+10+10+10+10)
So, during last 10 sessions, total of daily movement is 100 points. Volatility? Let's call it Noise.
Total movement was of 100 points. But over the 10 sessions price went up from 100 to 120.
Rate of change over 10 sessions = 20 points
Trend?
Total move up & down was 100 points but what was the outcome? Price moved up by 20 points. This is known as Efficiency Ratio (ER).
ER = Trend / Noise
ER in above example is 20. It took move of 100 points to gain 20 points.
Trend?
Total move up & down was 100 points but what was the outcome? Price moved up by 20 points. This is known as Efficiency Ratio (ER).
ER = Trend / Noise
ER in above example is 20. It took move of 100 points to gain 20 points.
For ER, trend is also calculated in absolute terms. Meaning, if price moves up by 20 points during the period of down by 20 points, trend for the calculation of ER would be 20. This way, Efficiency ratio becomes a good volatility indicator.
If price is rising & ER is rising = strong uptrend
If price is falling & ER is rising = strong downtrend
This means there is more of a trend in daily fluctuation.
If ER is falling, noise is more.
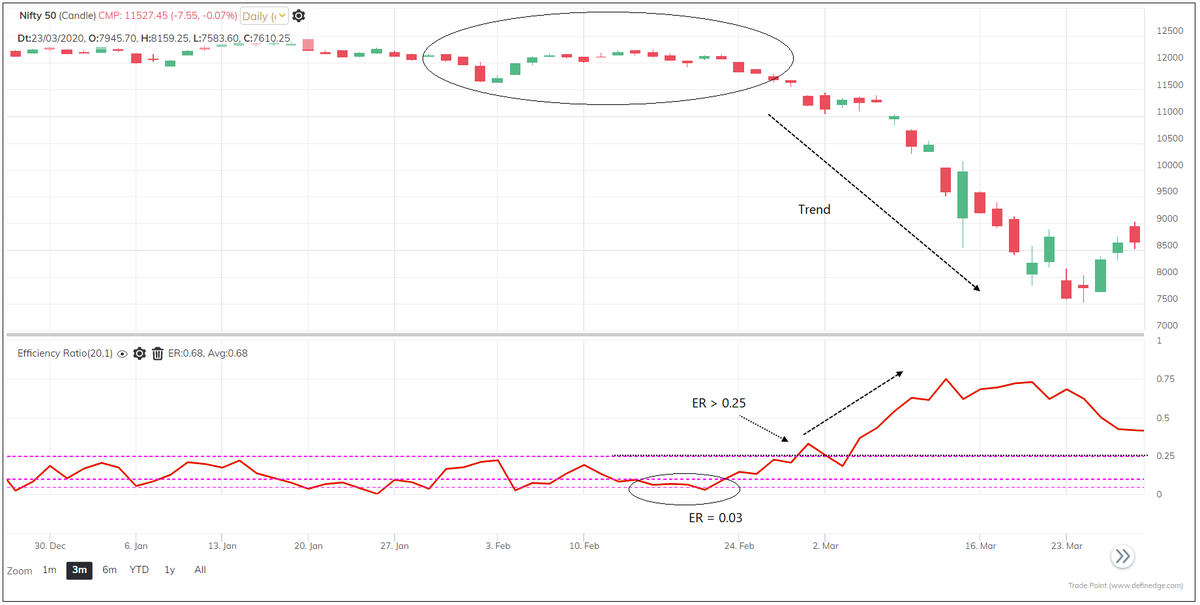
We can plot the ER indicator on the chart.
If price is falling & ER is rising = strong downtrend
This means there is more of a trend in daily fluctuation.
If ER is falling, noise is more.
We can plot the ER indicator on the chart.
ER trading above 0.25 (25%) indicates strong trend, it shows strong momentum when it is above 0.40 (40%).
ER > 0.25 = Strong trend
ER > 0.40 = Very strong trend
ER < 0.10 = Dull phase
ER < 0.05 = Trend might emerge (Volatility cycle)
ER > 0.25 = Strong trend
ER > 0.40 = Very strong trend
ER < 0.10 = Dull phase
ER < 0.05 = Trend might emerge (Volatility cycle)
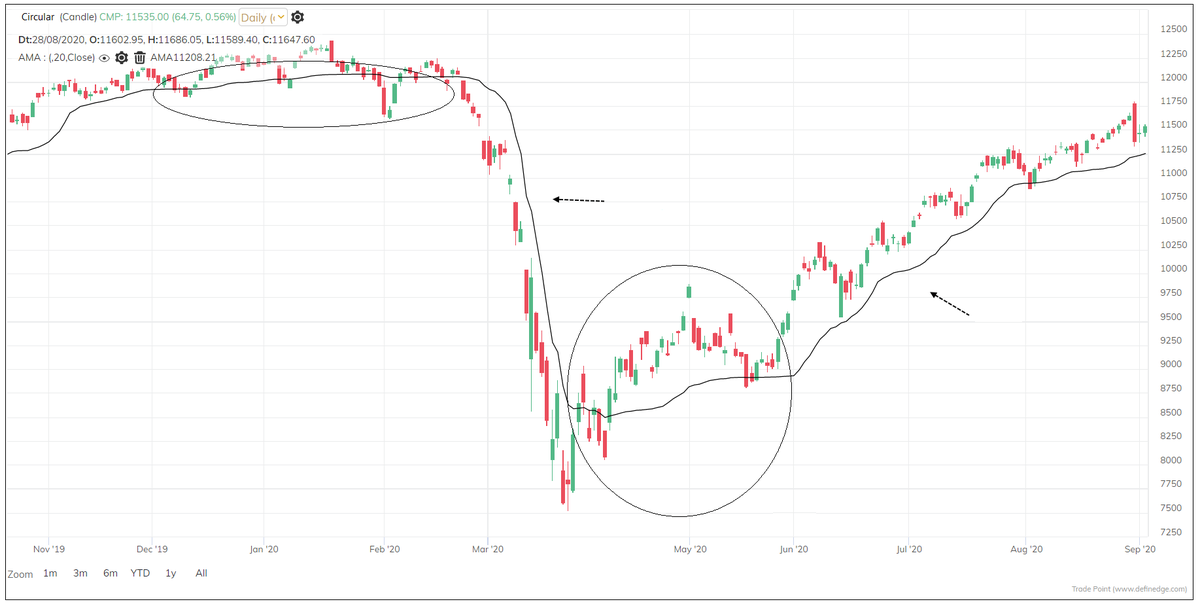
We can plot moving average on chart for trend identification along with ER.
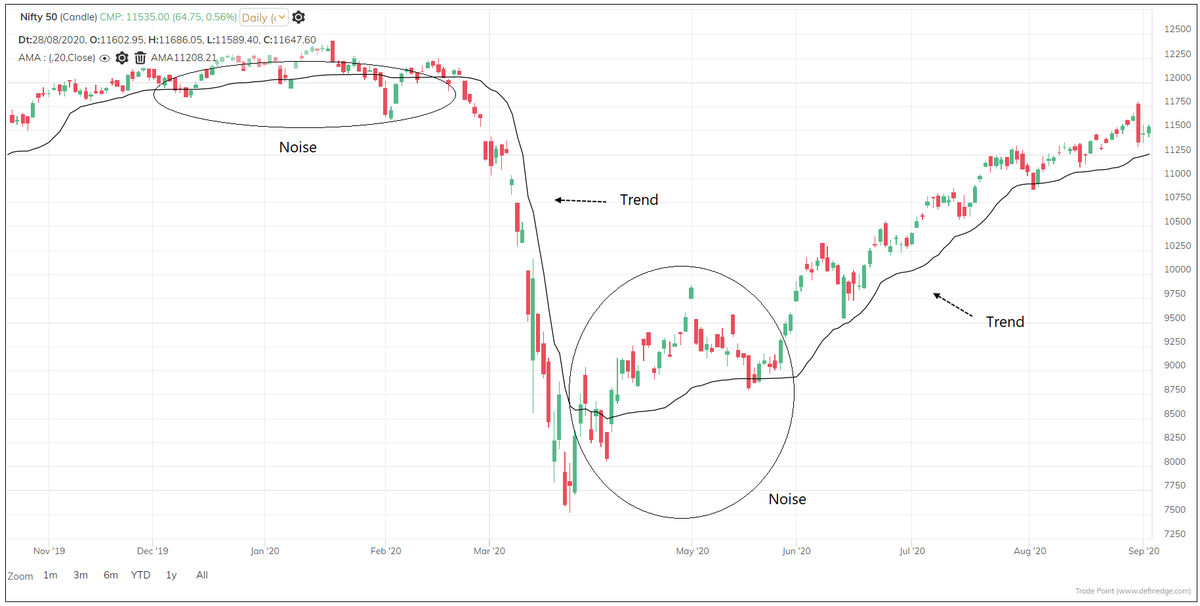
Moving average (MA) is a trend following indicator. Price crossing MA is bullish and falling below MA is bearish. But during sideways or volatile period, price fluctuates around MA resulting in whipsaws
Moving average (MA) is a trend following indicator. Price crossing MA is bullish and falling below MA is bearish. But during sideways or volatile period, price fluctuates around MA resulting in whipsaws
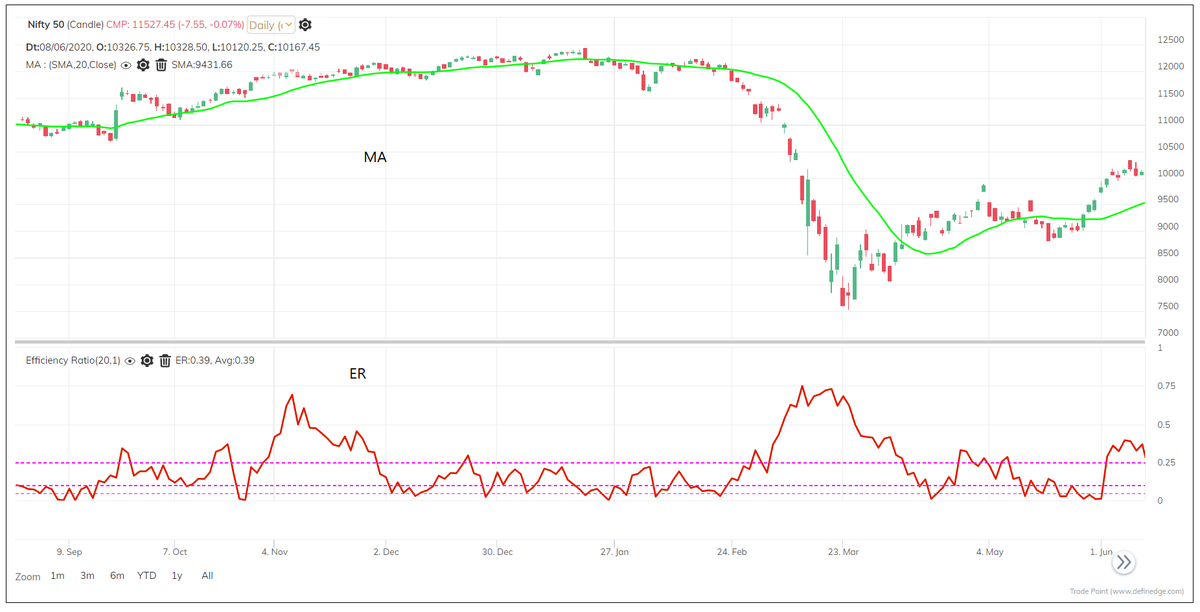
How about a moving average that considers volatility as well? Moving average should move when the trend is strong and should not move much when it is not. This is what Adaptive Moving Average (AMA) does. It is a combination of Moving average and ER.
AMA moves fast when ER is rising (Trend > Noise) & becomes slow when ER is falling (Noise > Trend). So, AMA moves relatively slow during the sideways period but moves swiftly or relatively faster when the price is trending. So, it is a moving average that adapts to the volatility
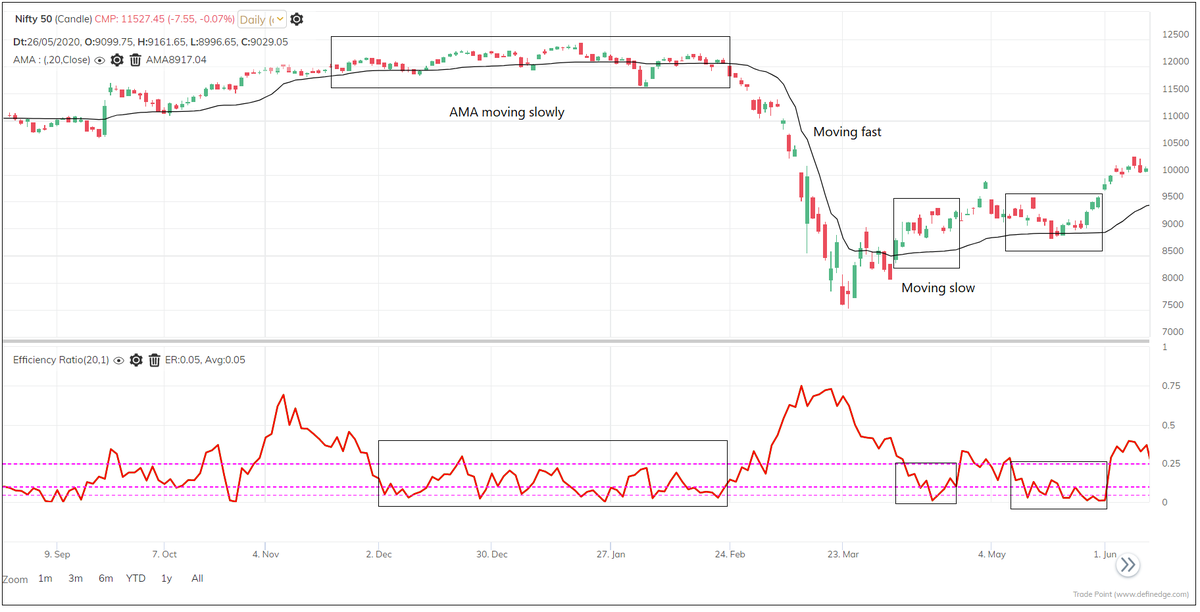
Kaufman used Fast (FSC = 2) and Slow smoothing constant (SSC = 30) for making the average line adapt to ER. It gives less weightage to change in price if ER is falling and more weight if ER is increasing.
Meaning, a rising AMA line and falling AMA line are also good signals.
Meaning, a rising AMA line and falling AMA line are also good signals.
Price and AMA breakout signals a change in trend.
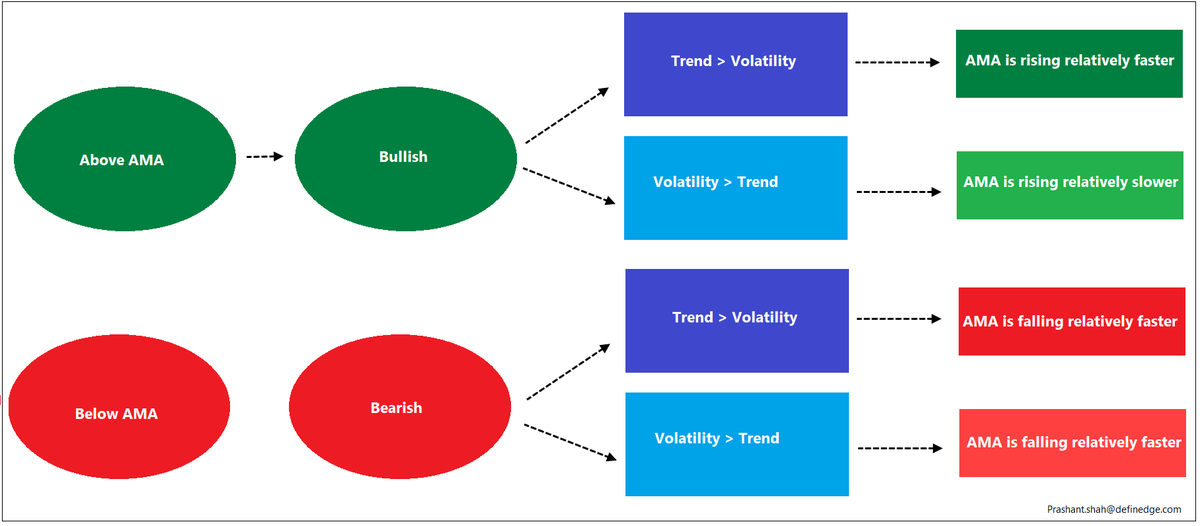
Price above AMA = Bullish
Price below AMA = Bearish
AMA trending = Trend is strong
AMA is relatively flat = Noise is more
All other logic or interpretation of Moving averages are applicable to AMA too.
Price above AMA = Bullish
Price below AMA = Bearish
AMA trending = Trend is strong
AMA is relatively flat = Noise is more
All other logic or interpretation of Moving averages are applicable to AMA too.
What will make AMA rise?
ER
What will make ER rise?
Trend
What is trend?
ROC > Volatility
When will ROC go up?
Drop-off effect or strong price action
So, while crossing price or when AMA rising – a strong close or bullish price action is more reliable. Vice versa whn AMA falling
ER
What will make ER rise?
Trend
What is trend?
ROC > Volatility
When will ROC go up?
Drop-off effect or strong price action
So, while crossing price or when AMA rising – a strong close or bullish price action is more reliable. Vice versa whn AMA falling
How about using AMA crossover? Explore.
Any strategy would have favorable and unfavorable phases. Remaining consistent with a strategy and accept its bad phase brings success over a period.
We can also develop a strategy that adopts to different market conditions.
Any strategy would have favorable and unfavorable phases. Remaining consistent with a strategy and accept its bad phase brings success over a period.
We can also develop a strategy that adopts to different market conditions.
It will have its pros and cons based on assumptions made while designing it. It may help in reducing drawdown.
Principle of AMA is that smoothing can be temporarily reduced when price is moving in a certain direction. That's a major takeaway.
Principle of AMA is that smoothing can be temporarily reduced when price is moving in a certain direction. That's a major takeaway.
AMA reduces number of trades in a volatile period because it moves relatively flat. That is an important aspect. It would be bit lagging because it uses method of averaging. I find noiseless charts helpful here.
Perry Kaufman created AMA --
Perry Kaufman created AMA --
He is considered as a leading expert in the development of fully algorithmic trading programs. He was a ‘rocket scientist’ in the aerospace industry. He was involved in the development of navigation systems in Project Gemini which were later used for Apollo Missions (Wikipedia).
In markets, he started with exponential smoothing & moving average trends, a technique developed in Aerospace for estimating the path for missiles. He headed a systematic trading for a co. which traded the largest prop account in futures market. (cmtassociation.org/presenter/perr…).
Takeaway: Adaptability rules in strategy itself. Method that reduces trades when phase is not favourable.
The motive of these threads is to promote logical understanding & make you think abt different concepts. Thanks for your likes & comments that hv encouraged me to share more
The motive of these threads is to promote logical understanding & make you think abt different concepts. Thanks for your likes & comments that hv encouraged me to share more