Swapnil Profile picture
Sep 6, 2020 6 tweets 9 min read Read on X
Continuing the Exercise, time for the weekly review of this:


Stocks which were at 5 Low:

1. #BIOCON : Swept equal lows, good bounce
2. #JKTYRE : Back at Support
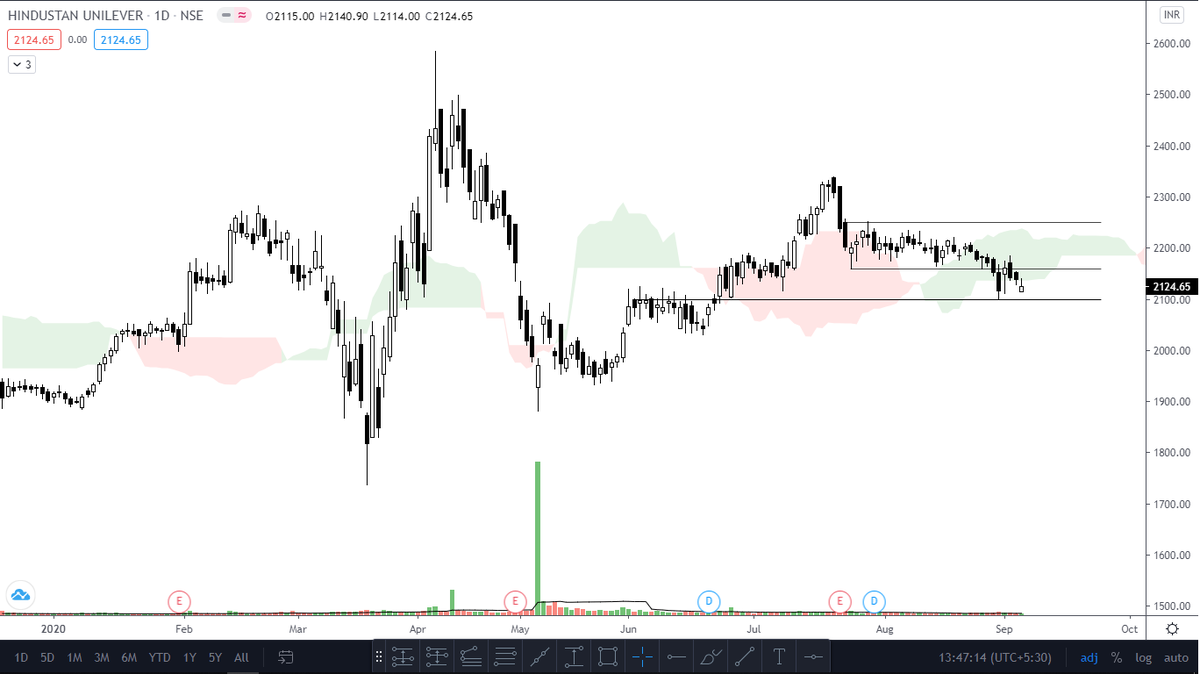
3. #HINDUNILVR : Broken previous Support
4. #GODREJPROP : Good bounce, at Equal highs ImageImageImageImage
Stocks which were at 13 Week High:

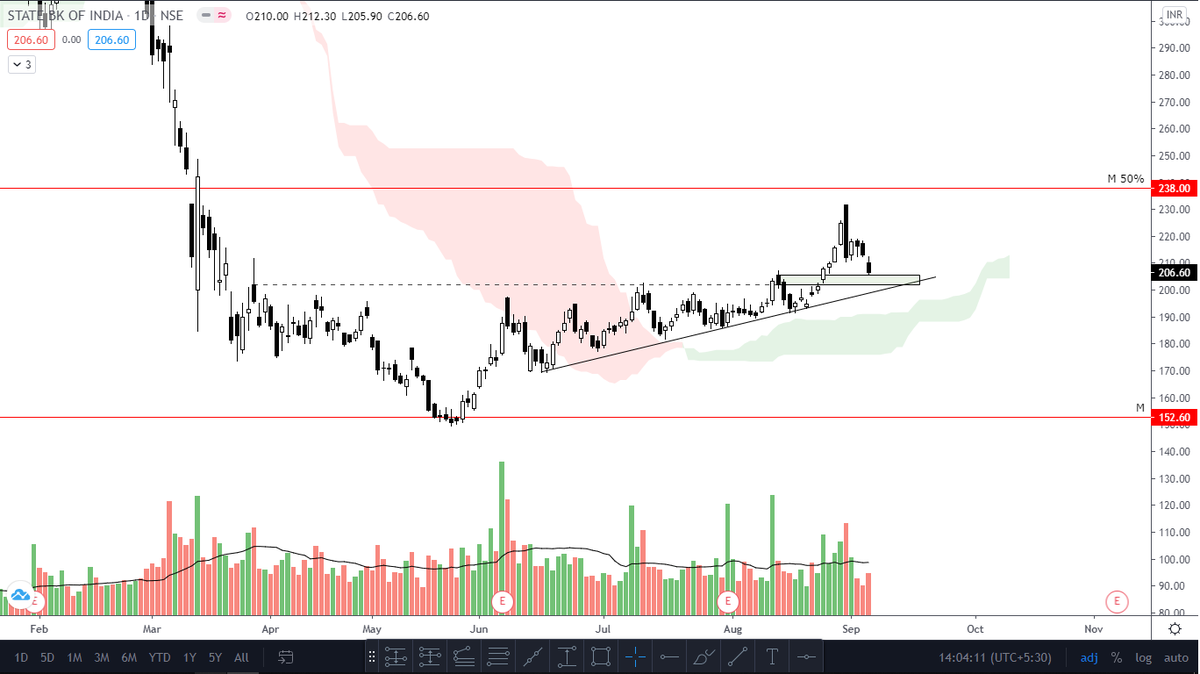
1. #SBIN : Testing broken resistance
2. #LICHSGFIN : Testing broken resistance
3. #DCBBANK : Testing broken resistance
4. #CHOLAFIN : Testing broken resistance ImageImageImageImage
Continued..

5. #TATACHEM : Broke ATH BUT back down
6. #NOCIL : Tested Support
7. #MFSL : Consolidating at Resistance
8. #BAJFINANCE : Looking Good, tested broken Resistance ImageImageImageImage
Continued..

9. #PHILIPCARB : Consolidating at Support
10. #RALLIS : Back at Support
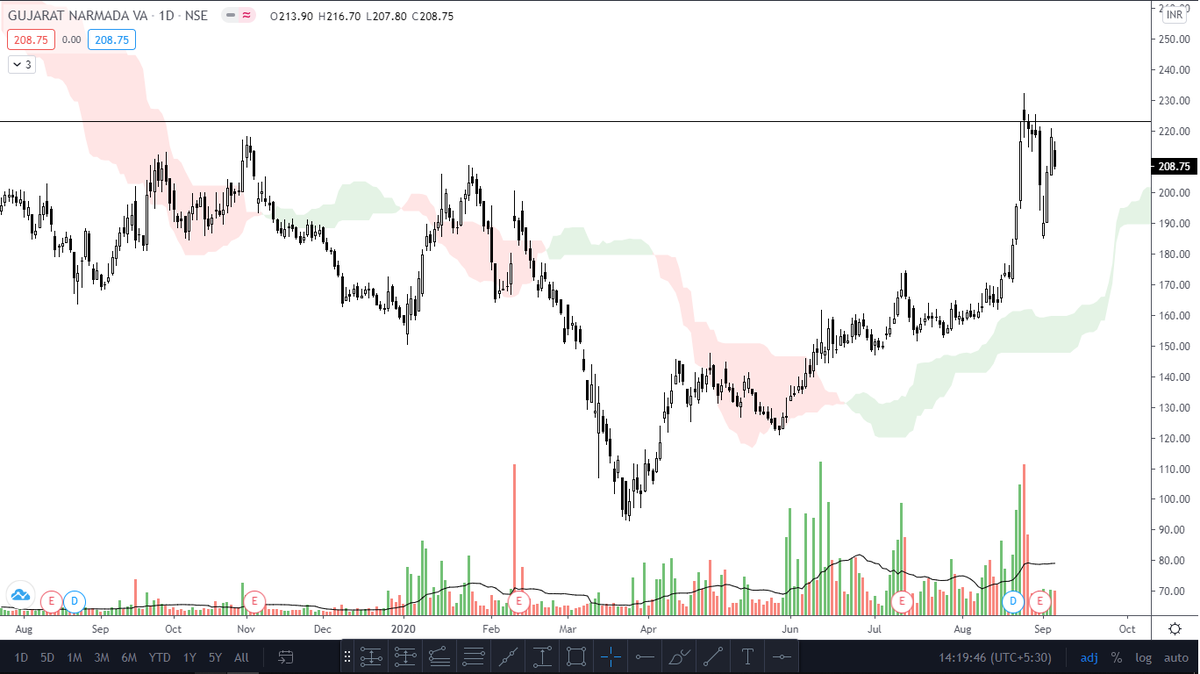
11. #GNFC : Rejected at Resistance but back at it
12. #GICHSGFIN : Rejected Badly after Breakout ImageImageImageImage
And final three stocks..

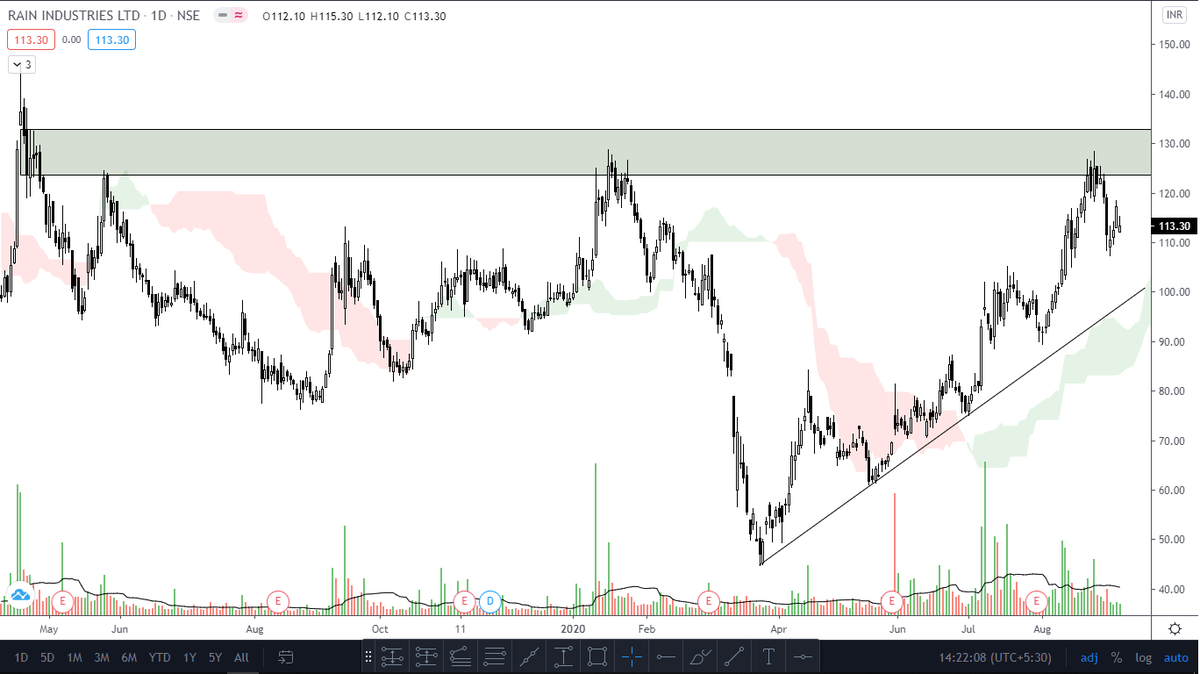
13. #RAIN : Consolidating below Resistance
14. #DEEPAKFERT : Going Good
15. #HAVELLS : Looking Good, testing broken Resistance ImageImageImage
Learnings:

1. 5-Week low stocks: Some looking bad but some are reversing back
2. Majority of 13-Week high stocks are retesting Supports or Consolidating below resistance
3. Some 13-Week high stocks looking weak due to Bad Rejection at higher levels of Resistance

• • •

Missing some Tweet in this thread? You can try to force a refresh
 

Keep Current with Swapnil

Swapnil Profile picture

Stay in touch and get notified when new unrolls are available from this author!

Read all threads

This Thread may be Removed Anytime!

PDF

Twitter may remove this content at anytime! Save it as PDF for later use!

Try unrolling a thread yourself!

how to unroll video
  1. Follow @ThreadReaderApp to mention us!

  2. From a Twitter thread mention us with a keyword "unroll"
@threadreaderapp unroll

Practice here first or read more on our help page!

More from @Swapniltrader

Nov 26, 2020
With the Bull run taking a halt in Crypto trading, back to Stocks!

Stocks for 27/11/20 Intraday

#RELIANCE
#BHARTIARTL
#BPCL
#SUNPHARMA
#TECHM
#SRTRANSFIN
#HDFC
#VOLTAS

Based on NR4, Volume and Volatility concepts
Results of the Day : 3/8 Stocks gave tradeable moves

1/3 : #RELIANCE : PROFIT : +3R

After a Liquidity hunt on the downside, price went up and came back to test that same zone as support which gave strong Bullish Reaction for a Long trigger

Exit at resistance zone ImageImage
2/3 : #SUNPHARMA : PROFIT : +3R

As I posted:

Price was doing a double S/R flip which is s strong Setup, supported by good volumes coming in, for a Long trigger

Exit at resistance zone using a predefined target ImageImage
Read 4 tweets
Nov 21, 2020
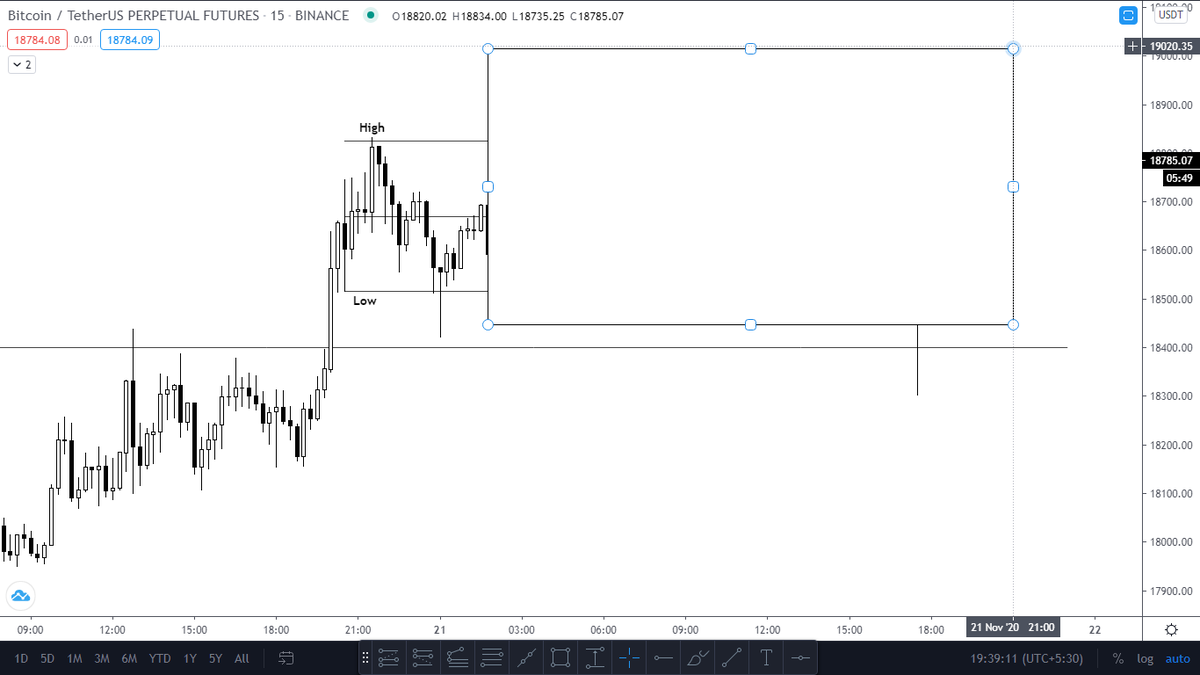
Trading Ranges : How-To

( A Thread 👇 on how do I approach a range and take scalps)

#1. Price makes a rapid move - Creates a Swing High and Low and starts consolidating within those boundaries

1/n
#2. Price deviates on one of the boundaries and closes back in the range. This logically means that price will likely visit the next extreme boundary of the range
(Not perfect example because it already went to other boundary!)
#3. Look for Trade entries when price revisits the breaker formed at the boundary where it created a deviation, with Stop above the boundary and Target the other extreme boundary
Read 4 tweets
Oct 25, 2020
Inspired by Market Structure traders, especially @Trader_xB, a thread on what I've understood and will look to implement in future

Note: This is a post-market analysis for my personal learning, I'm not yet good in this method

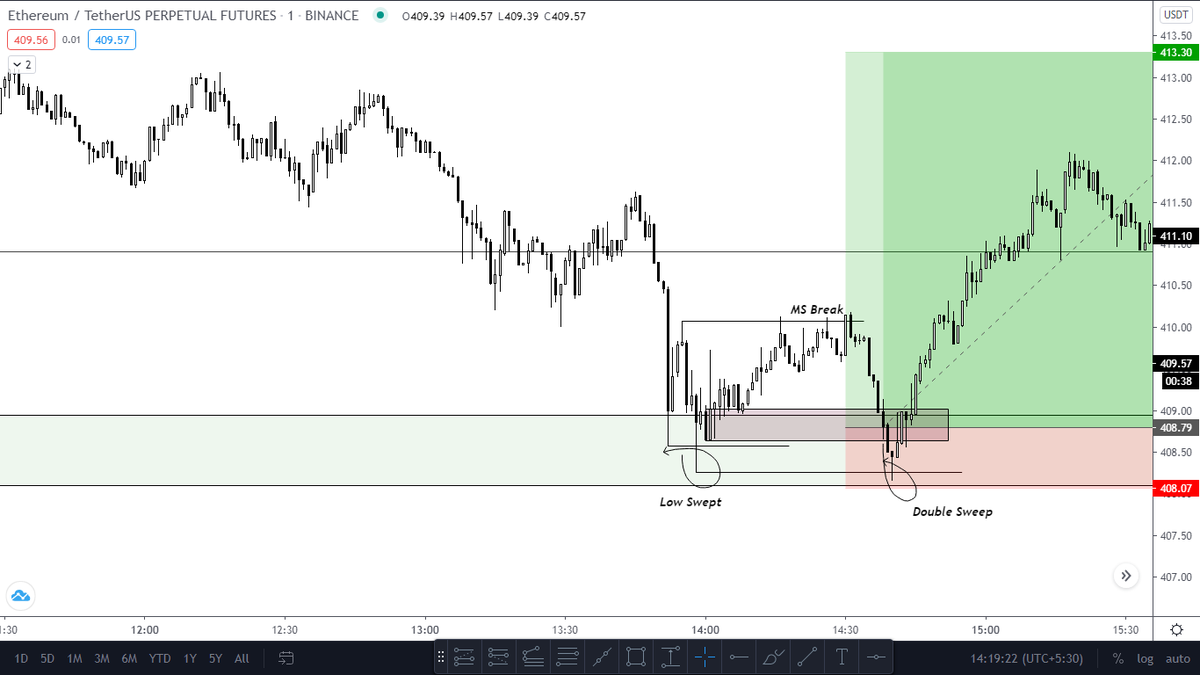
Let's apply it on #ETHUSDT

TF:
30 min
5 min
1 min
30 min TF:

Price moves Up, forms a Range high
and down, forms a Range Low

Zoomed in 15 min TF:

Moving up from Range Low, forms HH, HL structure
Forms an area of interest after break in MS

Hence,

1. Trend is Up
2. Area of Interest is made

Now, wait for price to come down ImageImage
5 min TF:

Price comes down to it, Look for entry

1 min TF:

Price makes a low
Low is Swept
MS breaks to Upside

Look for :
Entry on Breaker EQ/High
Stop below Range of Interest
Target: previous Range highs on HTF

Then,

Price comes down, Entry done
Price sweeps prior low ImageImage
Read 4 tweets
Sep 23, 2020
Stocks for 24/09/20 Intraday

Based on NR7:

#KOTAKBANK
#GLENMARK
#BIOCON
#TITAN
#ICICIPRULI

Based on NR4:

#BANDHANBNK
#HDFCBANK
#CIPLA
#GRANULES
#CADILAHC

Including NR4 too to increase my options for tomorrow
Some of you asked what I meant by "Volatility Concept"
while selecting stocks

Basically, you don't want stocks which are not moving organically, doing pump/dump, staying flat, or forming too many gaps

These were NR7 stocks which I rejected because of above reasons:
Results of the Day: 4/10 Stocks gave tradeable moves

A tricky, no easy setups day today

1/4 : #KOTAKBANK : PROFIT : +1.7R

As posted earlier:

It gave a loss of -1R, followed by another signal giving +2R
Read 6 tweets
Sep 21, 2020
A humble Thankyou to Everyone for this!

However, I believe one should know who he follows so you know what to expect

So Who Am I?

A thread:

1/n

I'm a Civil Engineer who got amazed by the markets in 2017 because of the Bull run in Cryptocurrency markets. Image
2/n

Between Dec 2017 to May 2017, I won some and lost some.
A Liquidation (funds wiped off to zero) event in May '17 made me go serious about markets.
I started studying and have been trading seriously, following Money and Risk management since then.
3/n

As a result, I didn't lose big but didn't win big either because of lack of Discipline, Patience and Trading
System.
I have read about and used a lot of Indicators but finally switched to Price Action and now I love it.
Read 5 tweets
Sep 18, 2020
One of my followers asked this Query:

A thread

1/n

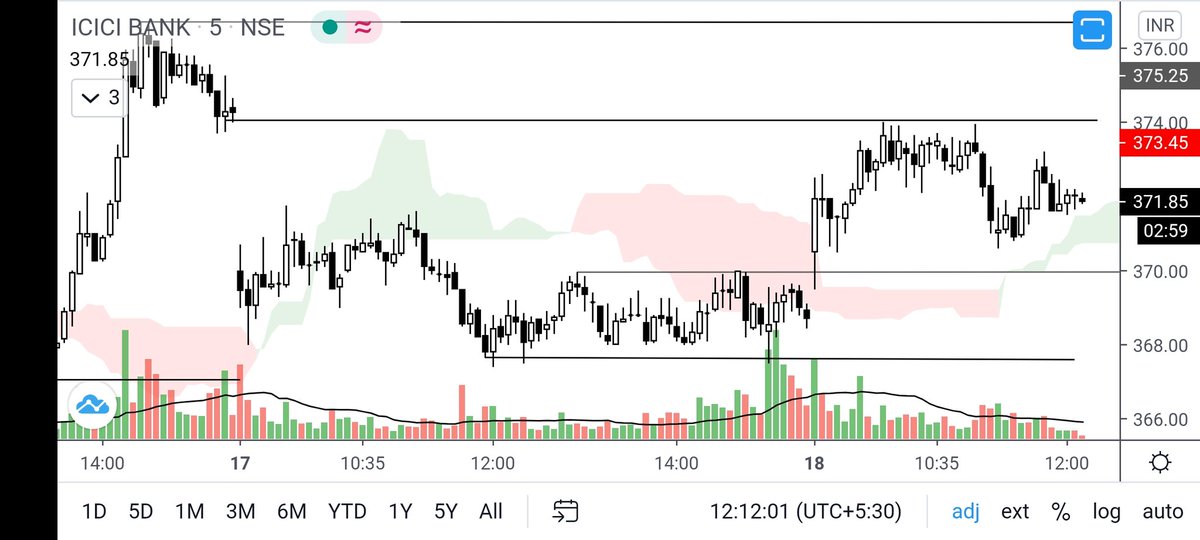
Query: Hi bro. today taken this trade but SL hit. please share your view

My Response: First of all, Congratulations for trying stuff out. You will get a lot better in next 6 months. Image
2/n

I encourage everyone to practice this way by taking trades and then analysing what mistakes you did/things which could have been better

1. When you see gaps in the chart, they also act as Support/Resistance. Why? Because gaps mostly fill and then reverse (Read about Gaps) Image
3/n

Hence there was resistance around 374, so not a good place to long

2. You can long at 2 places,
a. At previous lows, where price takes Support
b. On Breakout of previous Highs with Volume and strong candles. Image
Read 5 tweets

Did Thread Reader help you today?

Support us! We are indie developers!


This site is made by just two indie developers on a laptop doing marketing, support and development! Read more about the story.

Become a Premium Member ($3/month or $30/year) and get exclusive features!

Become Premium

Don't want to be a Premium member but still want to support us?

Make a small donation by buying us coffee ($5) or help with server cost ($10)

Donate via Paypal

Or Donate anonymously using crypto!

Ethereum

0xfe58350B80634f60Fa6Dc149a72b4DFbc17D341E copy

Bitcoin

3ATGMxNzCUFzxpMCHL5sWSt4DVtS8UqXpi copy

Thank you for your support!

Follow Us!

:(