Update 8 September (thread)
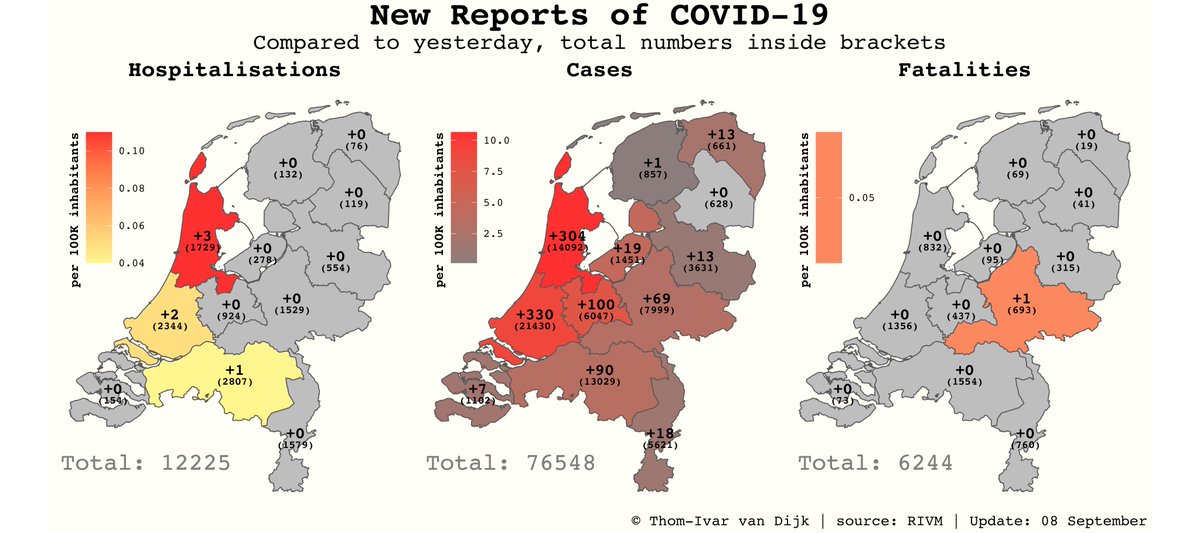
964 new cases (total: 76.548)
1 new fatalities (total: 6.244)
6 new hospitalisations (total: 12.225)
(differences w.r.t. yesterday)
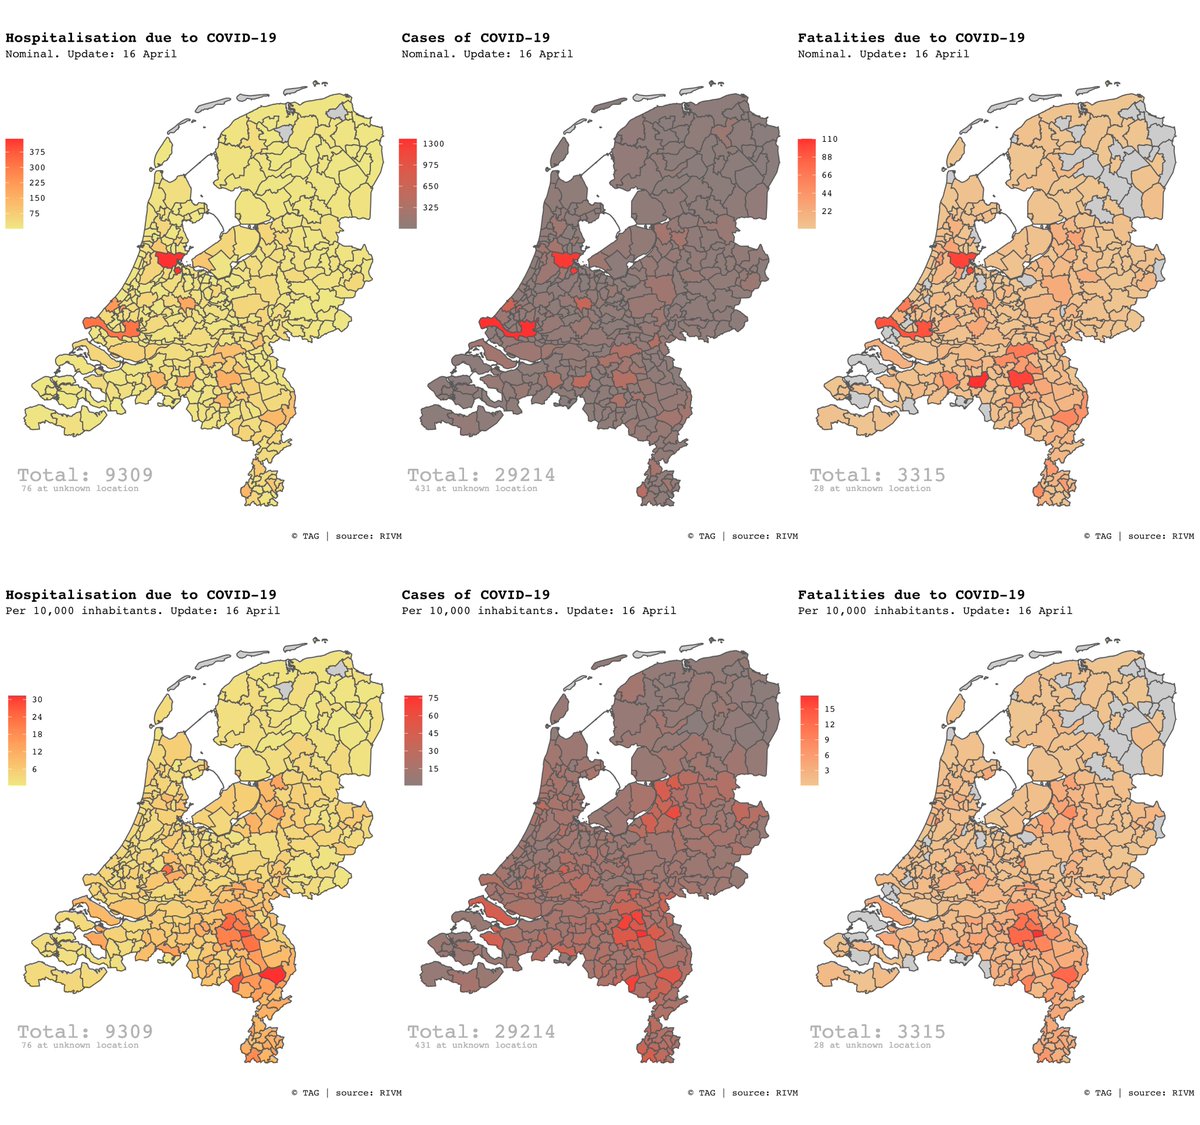
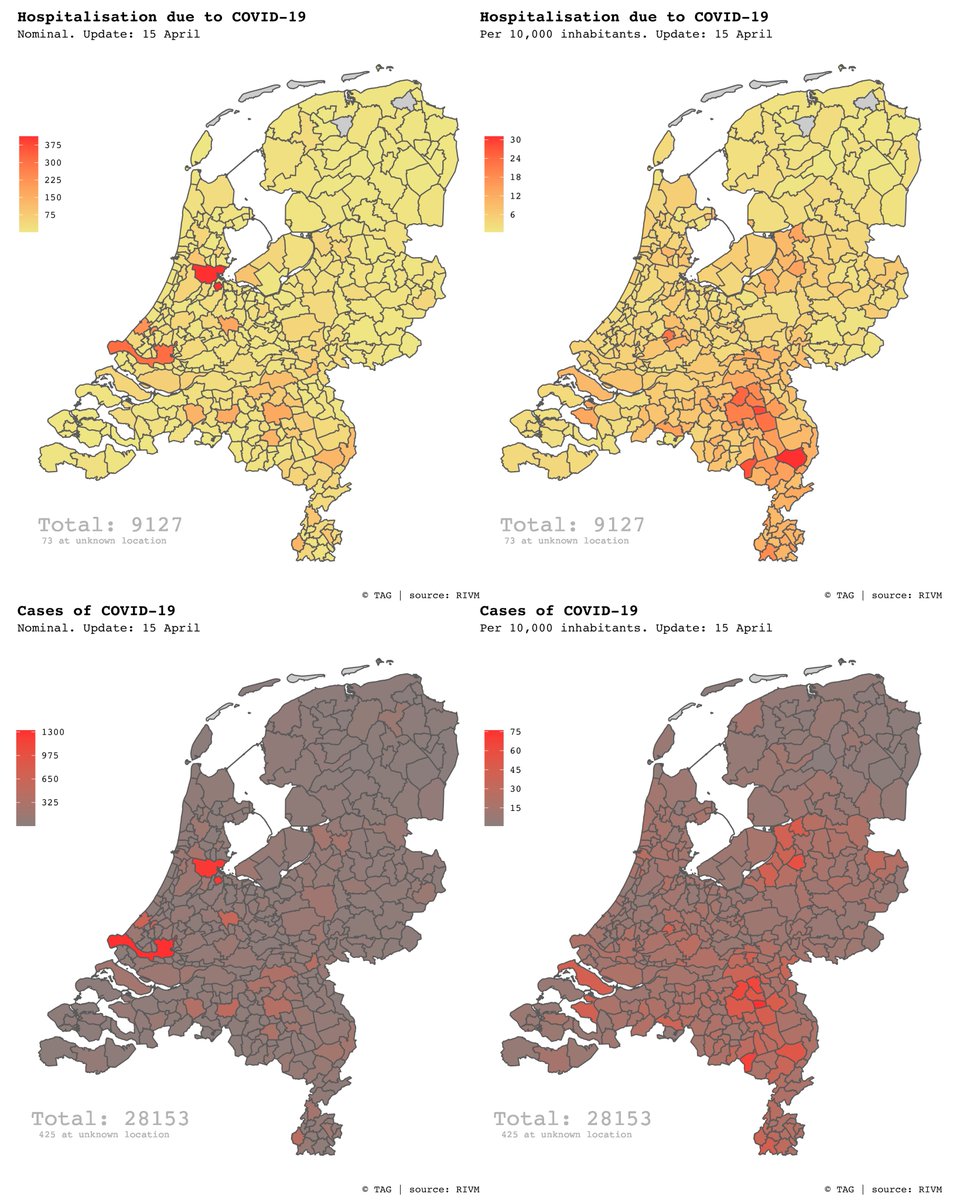
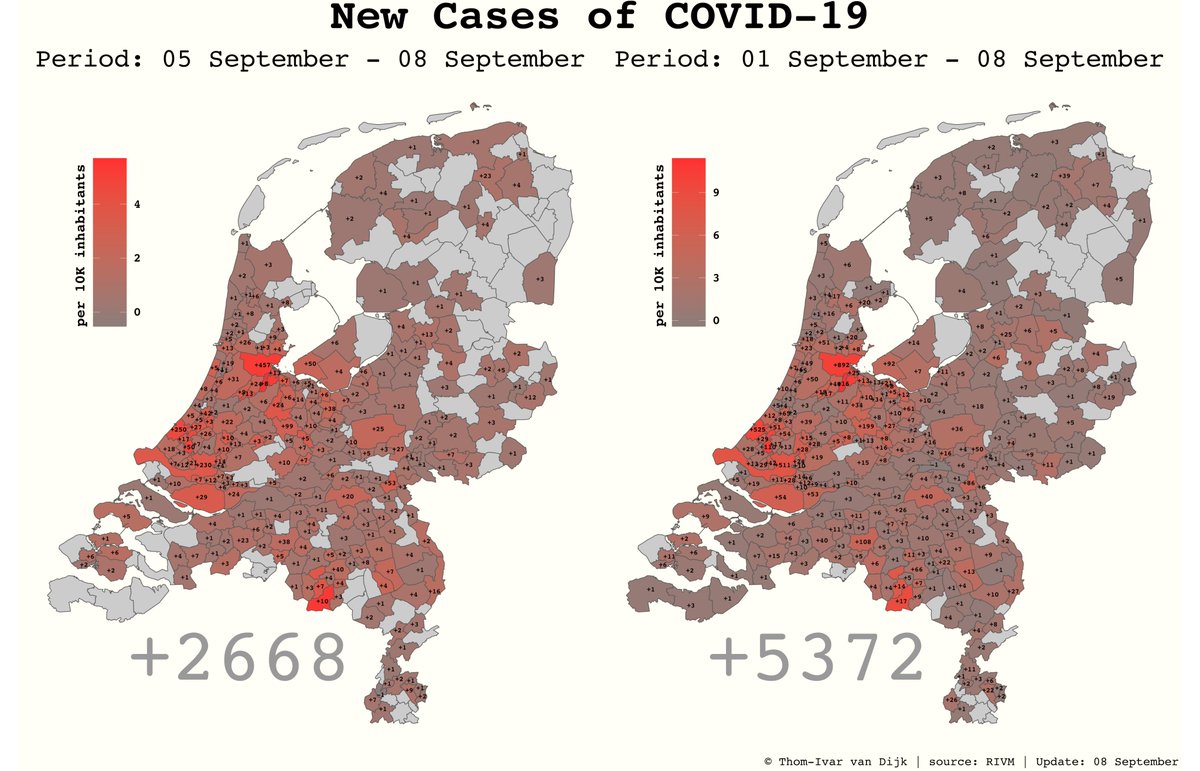
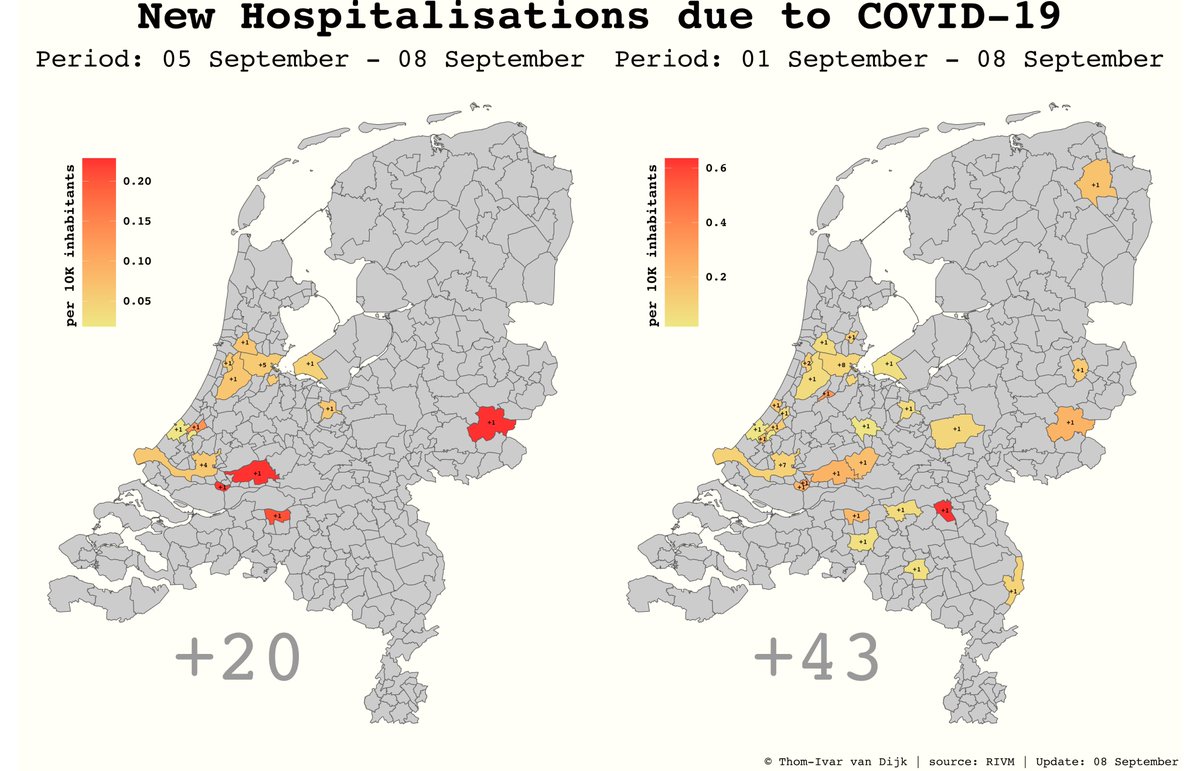
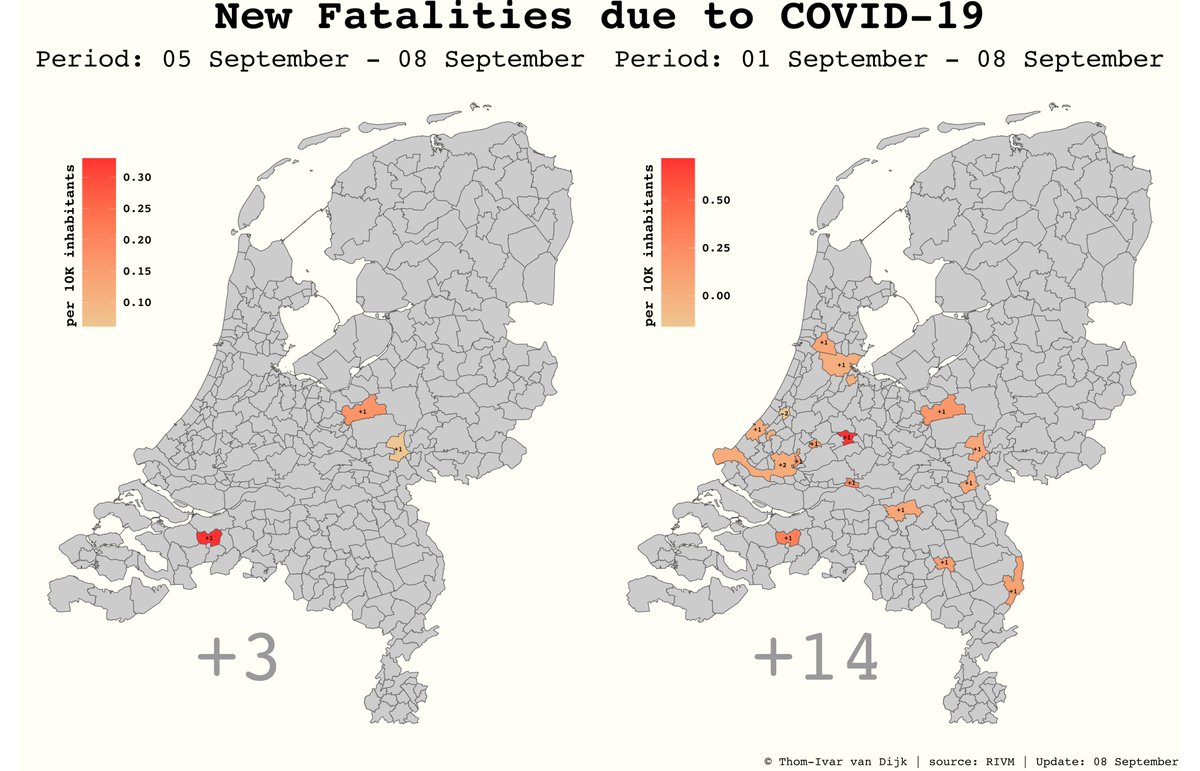
The maps show the cases, hospitalisations and fatalities for the last 3 & 7 days.
1/9
#coronakaart #COVID19NL
964 new cases (total: 76.548)
1 new fatalities (total: 6.244)
6 new hospitalisations (total: 12.225)
(differences w.r.t. yesterday)
The maps show the cases, hospitalisations and fatalities for the last 3 & 7 days.
1/9
#coronakaart #COVID19NL
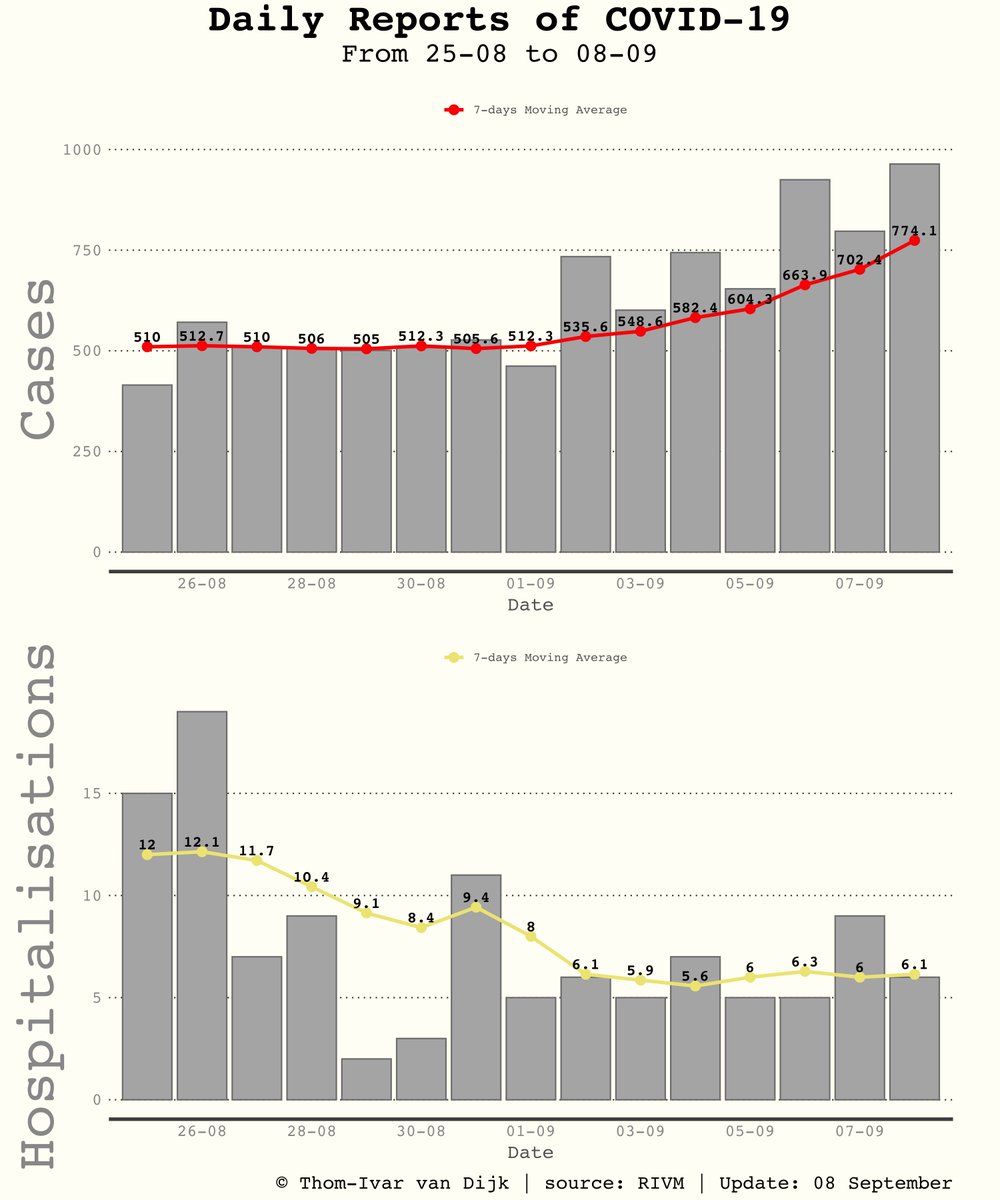
The daily reported number of cases & hospitalisations of COVID-19 in the last two weeks.
New cases are measured as the difference in cumulative figures w.r.t. yesterday.
2/9
#COVID19NL
New cases are measured as the difference in cumulative figures w.r.t. yesterday.
2/9
#COVID19NL
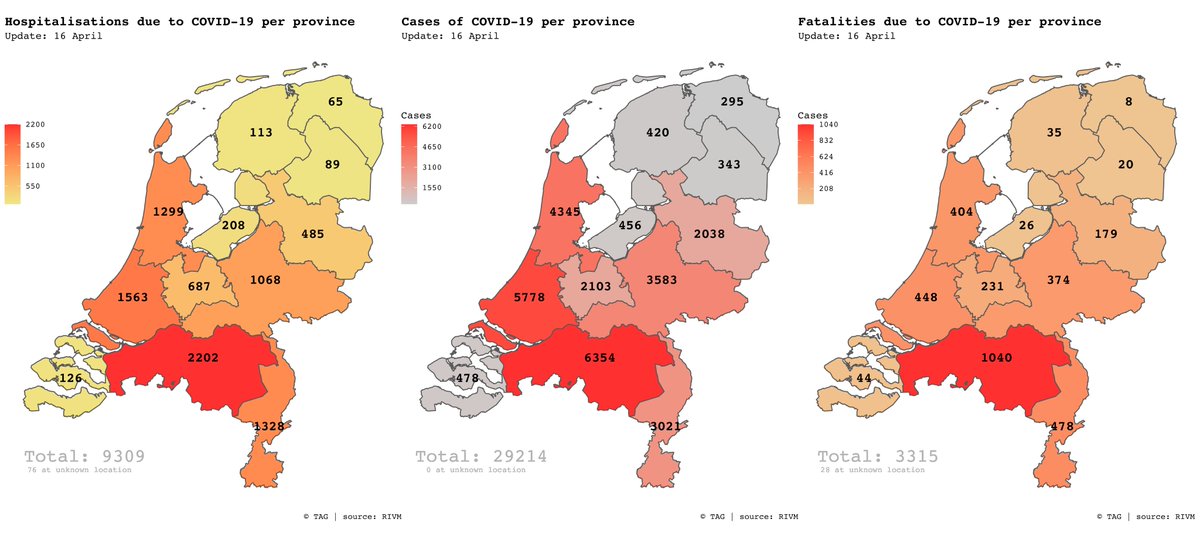
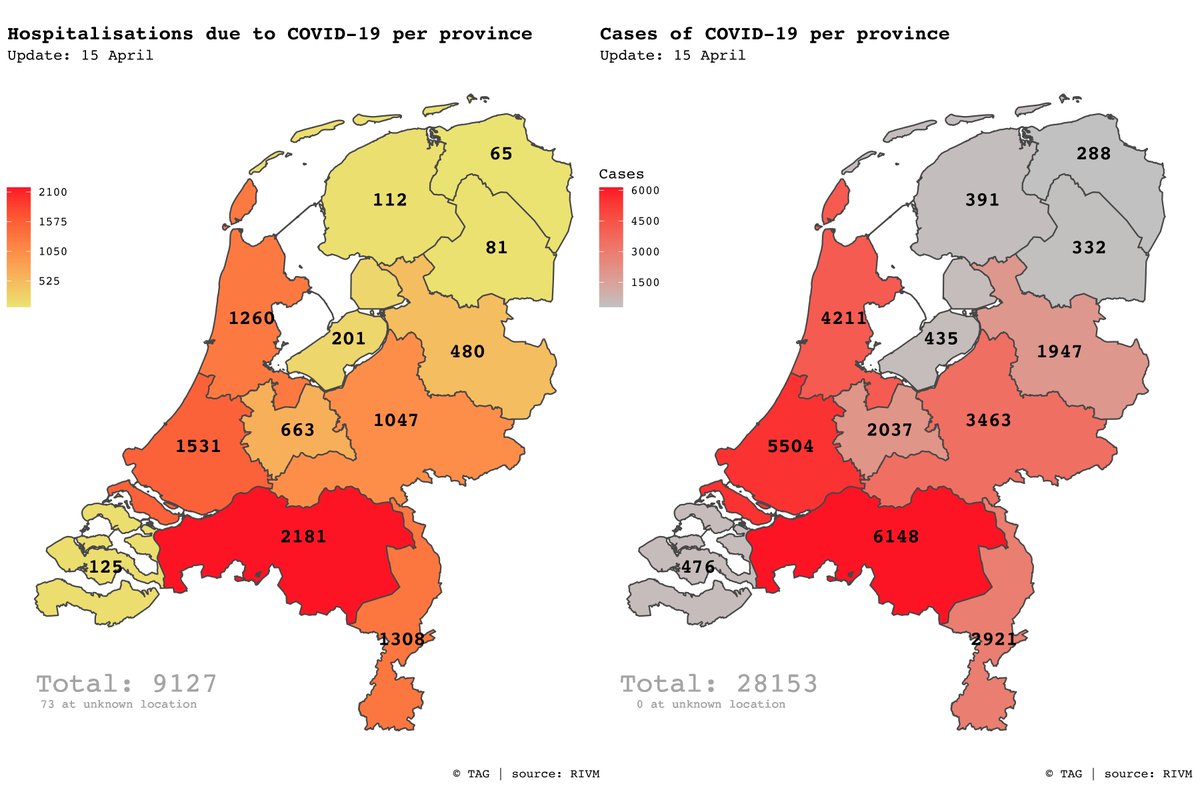
Absolute new number of reported cases, fatalities and hospitalisations per Dutch province. Cumulative numbers per province are in parentheses.
3/9
#coronakaart #COVID19NL
3/9
#coronakaart #COVID19NL
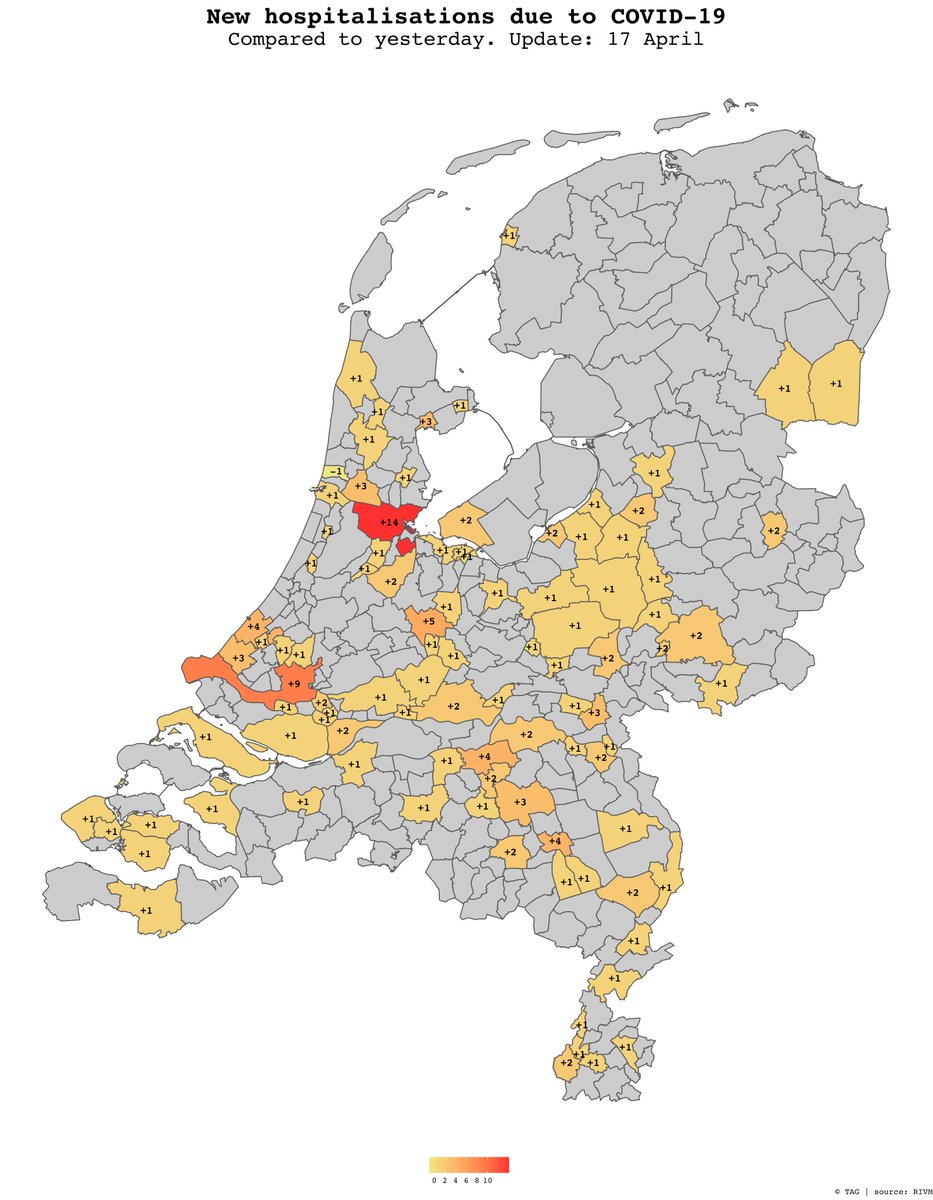
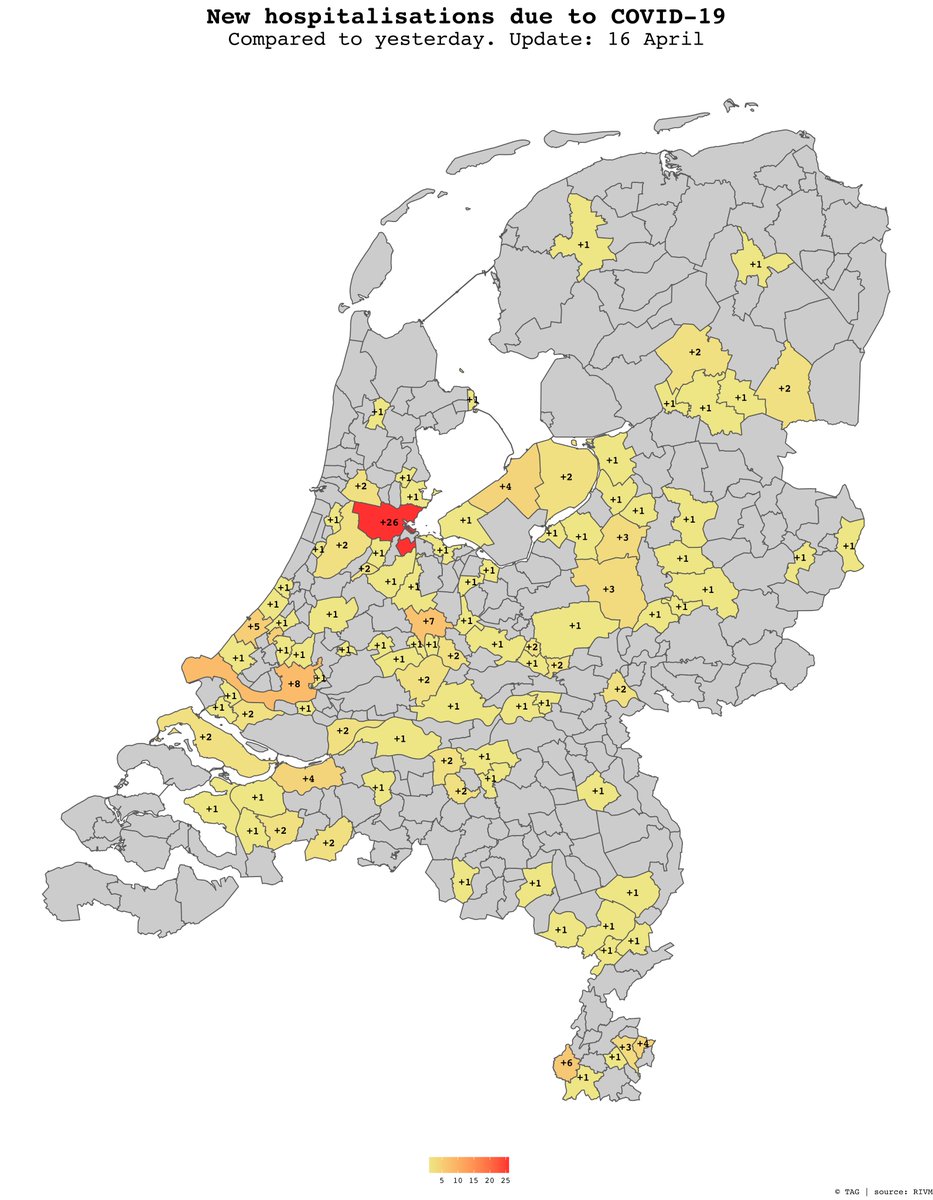
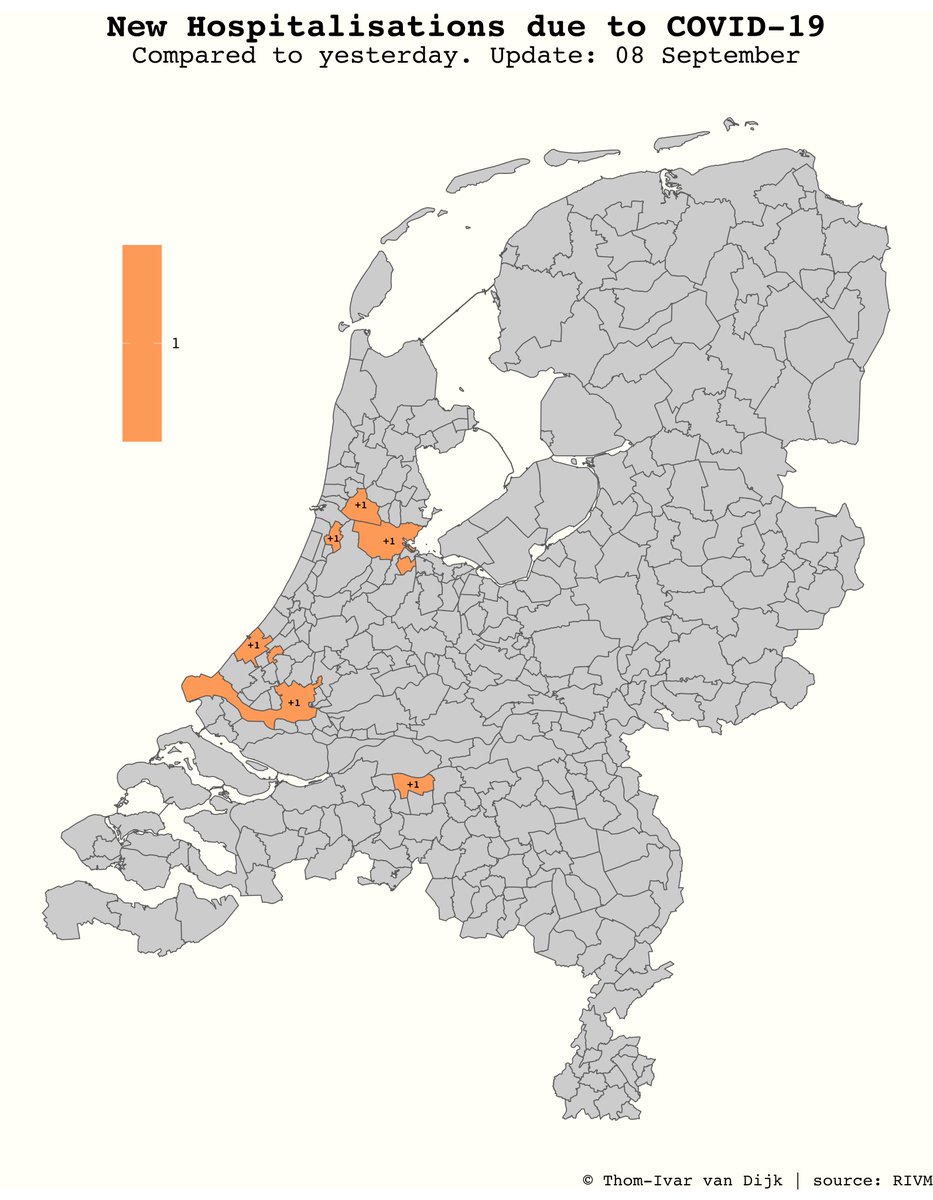
6 municipalities report at least one new hospitalisation due to COVID-19, compared to yesterday.
6 new hospitalisations are located and 0 hospitalisations are removed.
4/9
#coronakaart #COVID19NL
6 new hospitalisations are located and 0 hospitalisations are removed.
4/9
#coronakaart #COVID19NL
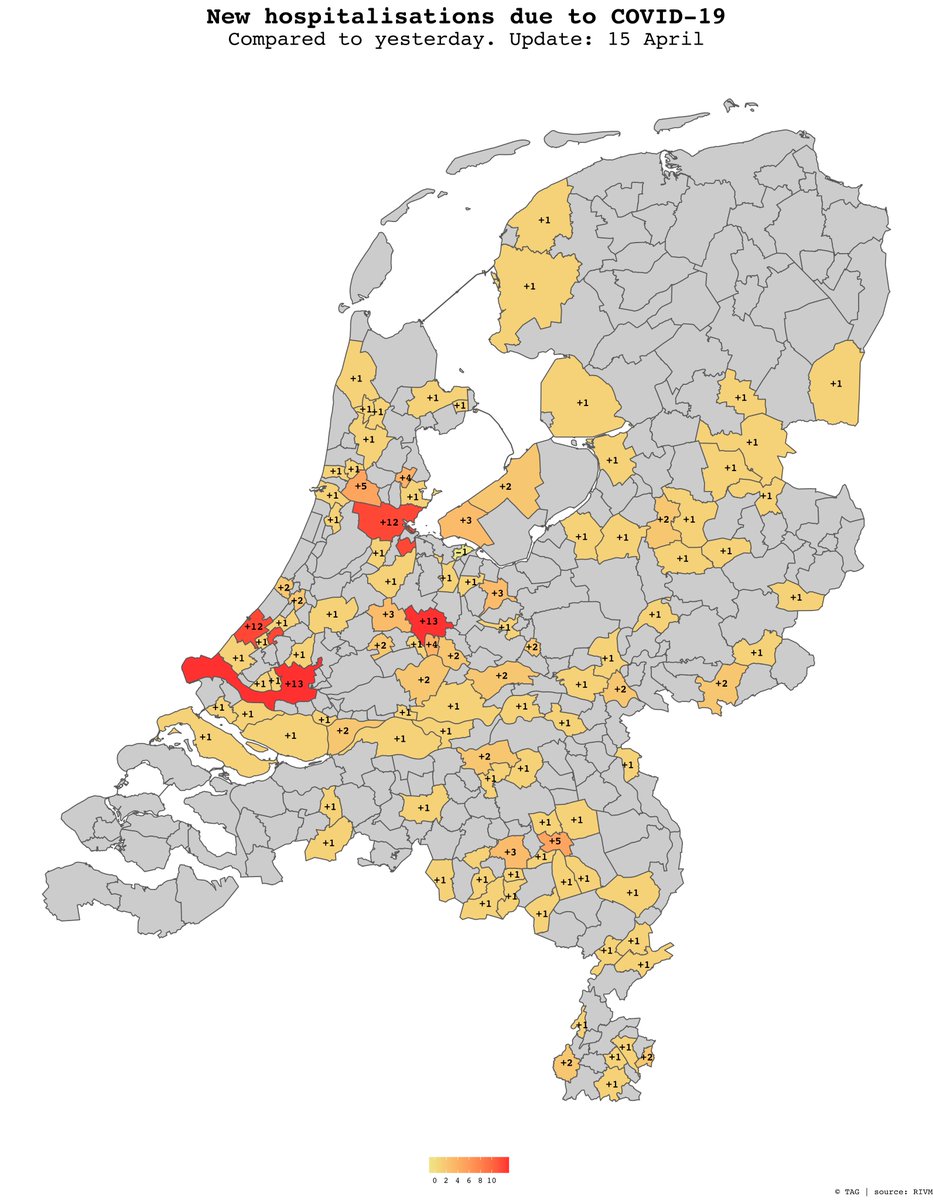
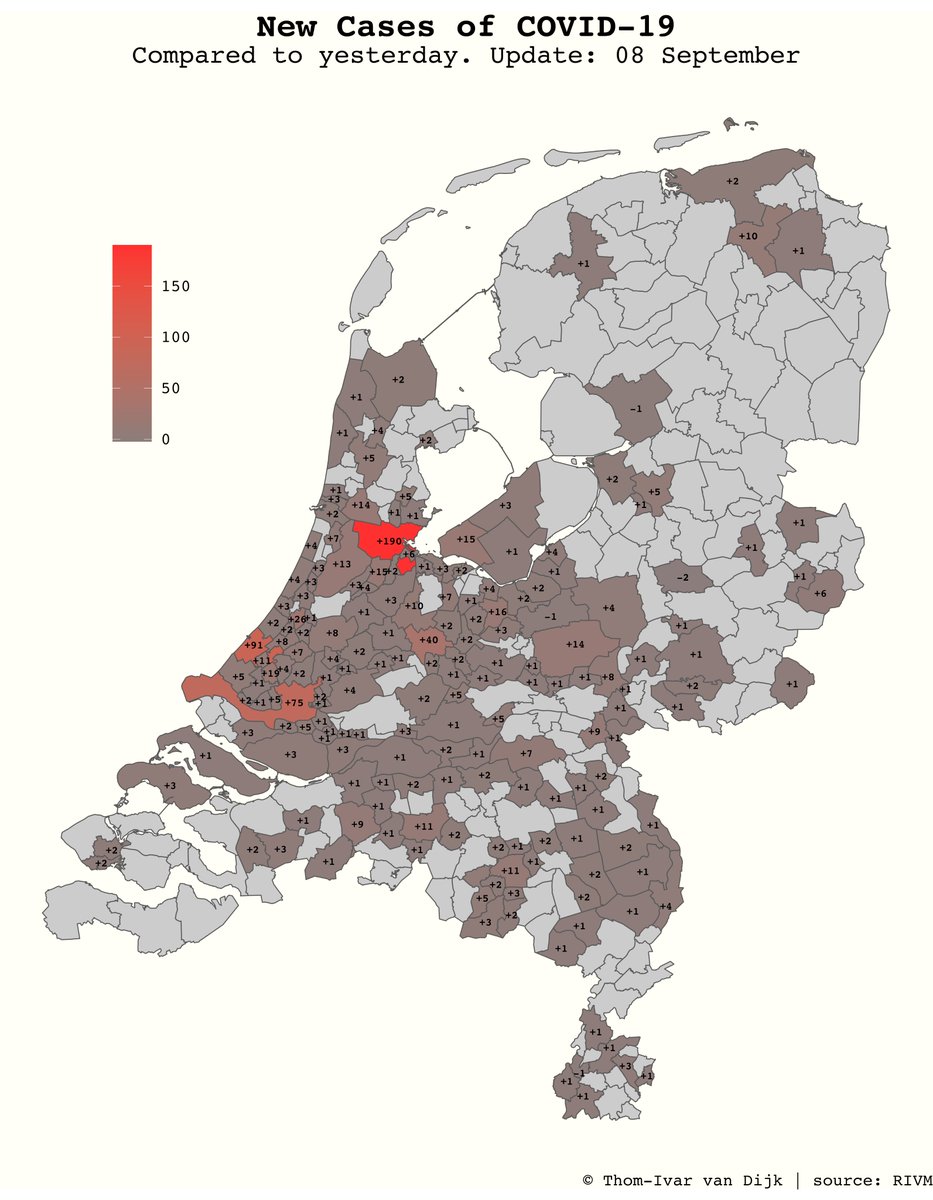
180 municipalities report at least one new case of COVID-19, compared to yesterday.
956 new cases are located and 5 cases are removed.
The biggest increase is in Amsterdam (+190), 's-Gravenhage (+91) and Rotterdam (+75).
5/9
#coronakaart #COVID19NL
956 new cases are located and 5 cases are removed.
The biggest increase is in Amsterdam (+190), 's-Gravenhage (+91) and Rotterdam (+75).
5/9
#coronakaart #COVID19NL
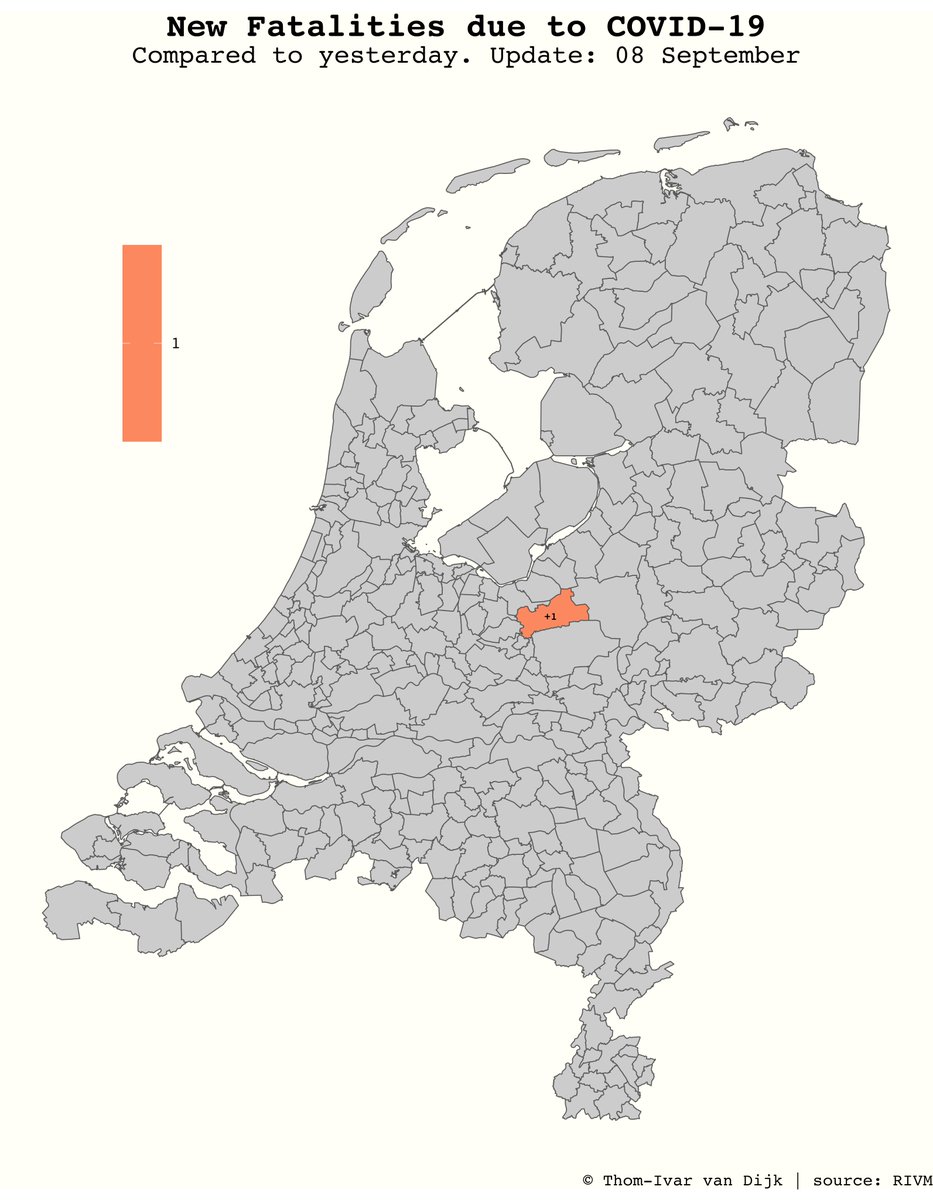
1 municipality reports at least one new fatality due to #COVID19, compared to yesterday.
1 new fatality is located and 0 fatalities are removed.
6/9
#coronakaart #COVID19NL
1 new fatality is located and 0 fatalities are removed.
6/9
#coronakaart #COVID19NL
The municipalities with the highest number of new cases, compared to yesterday and last week. Reported as new cases per 100,000 inhabitants.
7/9
#COVID19NL
7/9
#COVID19NL
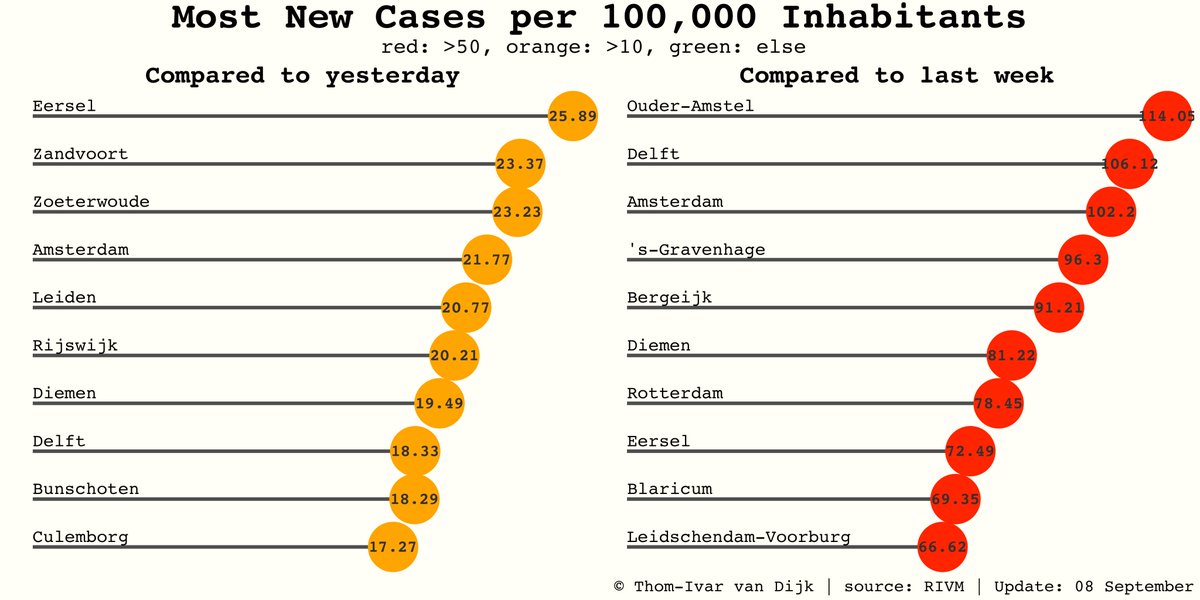
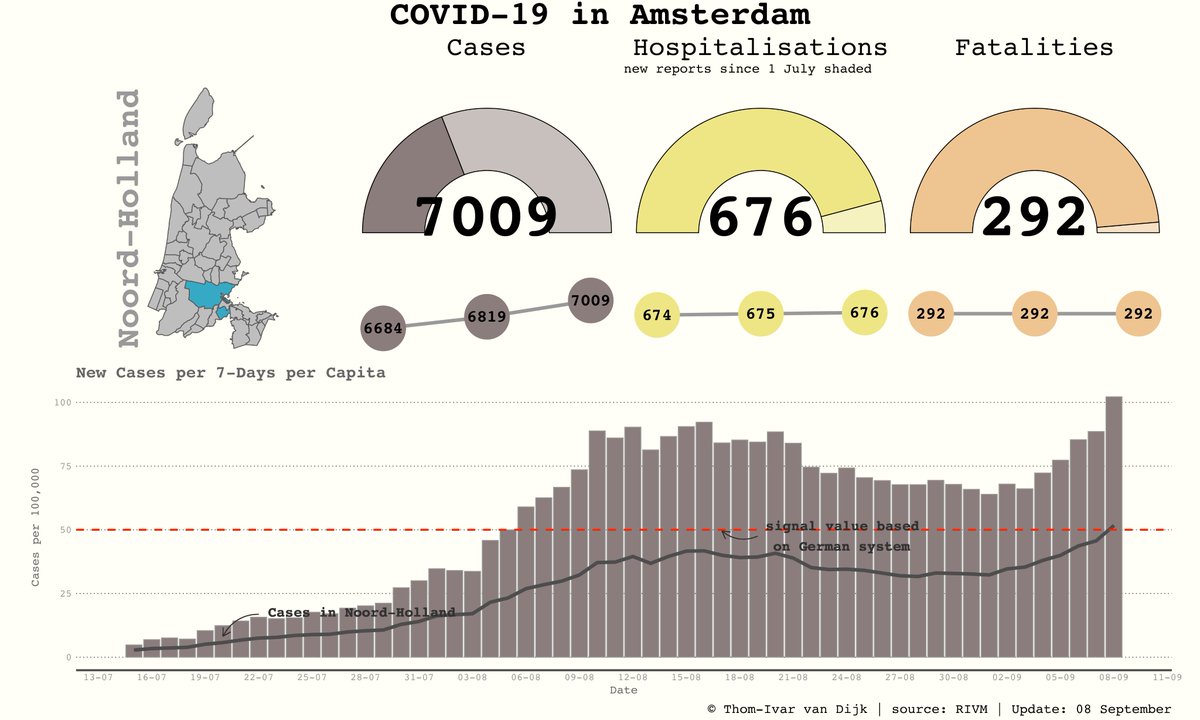
A large increase in cases per 100.000, compared to yesterday, is in Amsterdam (+21.77).
Note that an increase of 50 per 100.000 compared to last week is considered as a warning signal in Germany.
(Graphs for other municipalities available on request)
8/9
#COVID19NL
Note that an increase of 50 per 100.000 compared to last week is considered as a warning signal in Germany.
(Graphs for other municipalities available on request)
8/9
#COVID19NL
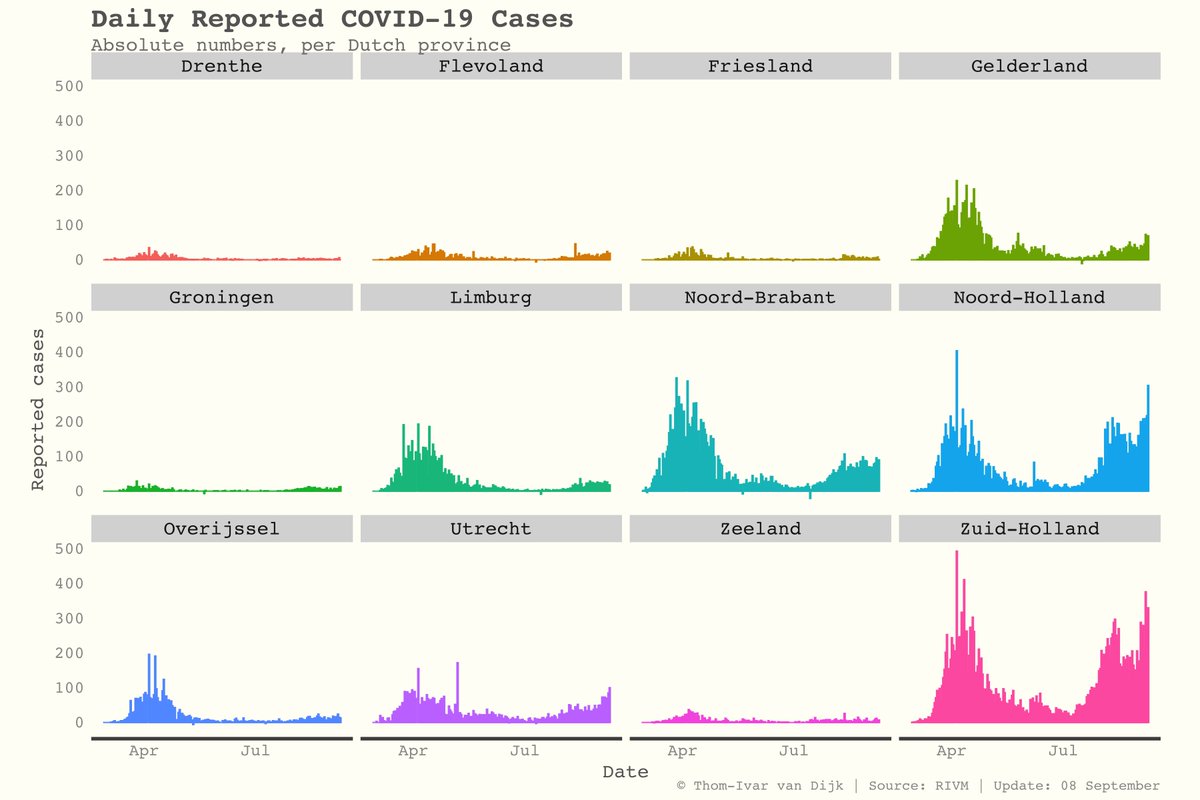
New reported COVID-19 cases per Dutch province over time. The graph shows the absolute number of newly reported cases, as provided in the database of the RIVM.
9/9
#COVID19NL
9/9
#COVID19NL