Our headline estimates suggest that at any given time between 30 August and 5 September, around 1 in 1,400 people not in care homes, hospitals or other institutional settings in England would test positive for #COVID19, an average of 39,700 people ow.ly/290u50BnZPg Graphic text:  0.07% Estimated percentage of people with COV
The most recent modelled estimate suggests the number of infections has increased in recent weeks ow.ly/dX9E50BnZQY Chart title:  The most recent modelled estimate suggests the
During the most recent week, we estimate there were around 3,200 new #COVID19 infections per day in England, not including those living in institutional settings.

Our evidence suggests that the incidence rate for England has increased in recent weeks ow.ly/GS0u50BnZYM Chart title:  Evidence suggests that the incidence rate for
During the same week, we estimate that at any given time 1,200 people in Wales had #COVID19 (around 1 in 2,600 people) ow.ly/ecnK50Bo04N Graphic text:  0.04% Estimated percentage of people with COV
We’re inviting people to join the #COVID19 Infection Survey in England, Wales, Northern Ireland, and soon Scotland.

If you receive an invitation letter, you could play a crucial role in helping us to understand the spread of the virus.

Learn more ow.ly/npGp50Bo0ex

• • •

Missing some Tweet in this thread? You can try to force a refresh
 

Keep Current with Office for National Statistics (ONS)

Office for National Statistics (ONS) Profile picture

Stay in touch and get notified when new unrolls are available from this author!

Read all threads

This Thread may be Removed Anytime!

PDF

Twitter may remove this content at anytime! Save it as PDF for later use!

Try unrolling a thread yourself!

how to unroll video
  1. Follow @ThreadReaderApp to mention us!

  2. From a Twitter thread mention us with a keyword "unroll"
@threadreaderapp unroll

Practice here first or read more on our help page!

More from @ONS

2 Sep
The provisional number of deaths registered in England and Wales in the week ending 21 August 2020 (Week 34) was 9,631.

This was

▪️ 239 more than Week 33
▪️ 474 more than the five-year average for Week 34

➡️ow.ly/X0mp50Bfy1M Chart title: The number of deaths in England and Wales invol
The number of deaths registered in week 34 was 5.2% above the five-year average (474 deaths higher).

This is the second consecutive week that weekly deaths have been above the five-year average, however, the rise was not driven by #COVID19 ow.ly/Kwy950Bfy4V
Of the deaths registered in Week 34, 138 mention #COVID19 on the death certificate (1.4% of all deaths).
This has fallen since the previous week (Week 33) when 1.5% of all deaths mentioned COVID-19 ow.ly/VvYF50Bfya3 Chart title: The number of deaths not involving COVID-19 inc
Read 11 tweets
21 Aug
We’ve published our monthly mortality data for July 2020.

These data are not directly comparable with our weekly data on deaths registered in England and Wales, as weeks do not aggregate exactly into calendar months ow.ly/eyts50B5iPn
In July 2020, there were 38,179 deaths registered in England, 576 more than the five-year average for July.

In Wales, there were 2,548 deaths registered, 69 more than the five-year average for July ow.ly/k7WZ50B5j4R
July 2020 had more weekdays (when most deaths are registered) than most years from 2015-2019.

As a result, while the weekly number of deaths registered was below that week’s five-year average, more deaths were registered overall than the average for July ow.ly/pZGV50B5jaT
Read 9 tweets
13 Aug
We have investigated the link between air pollution and #COVID19 deaths in England.

We found some evidence to suggest a correlation, but it is likely to be lower than that found in other studies ow.ly/bizl50AYelG Does exposure to air pollution increase the risk of dying fr
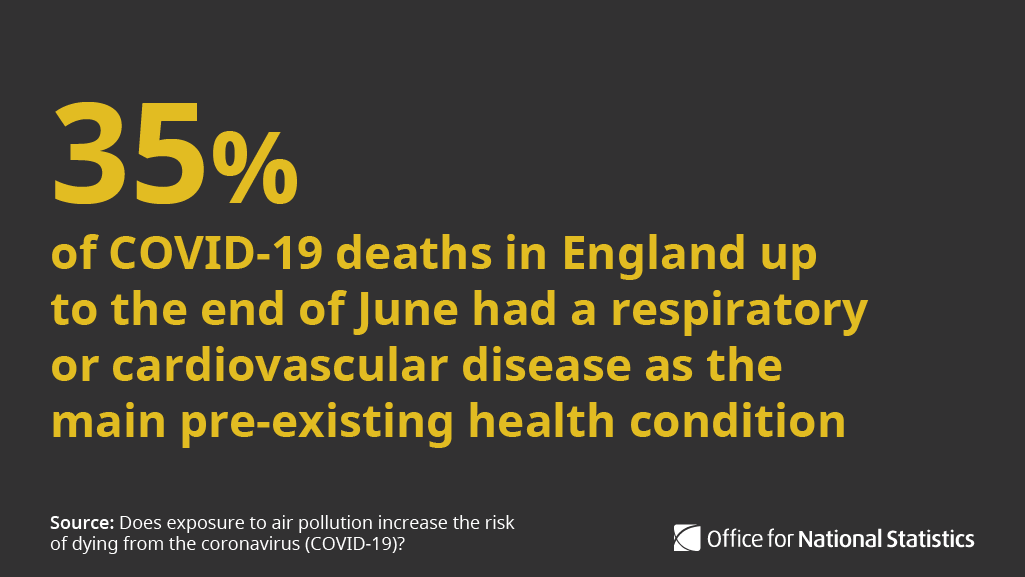
Exposure to air pollution can cause breathing difficulties and other lung and heart conditions.

More than one-third of #COVID19 deaths in England up to the end of June had a respiratory or cardiovascular disease as the main pre-existing health condition ow.ly/80qc50AYepI 35% of COVID-19 deaths in England up to the end of June had
While #COVID19 deaths were more common in highly polluted areas early in the pandemic, this trend decreased as the number of deaths rose ow.ly/Znw650AYesK
Read 5 tweets
12 Aug
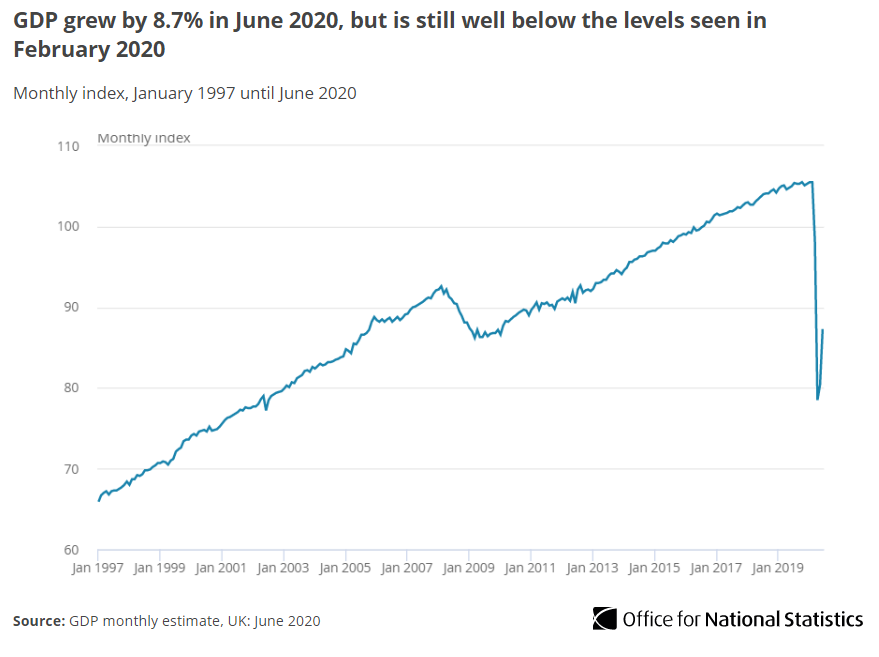
Our latest GDP estimates for June show that the UK economy is now 17.2% smaller than it was in February before the full impacts of the #coronavirus #COVID19 pandemic hit ow.ly/Wsom50AX8b9 Chart title: GDP grew by 8.7% in June 2020, but is still wel
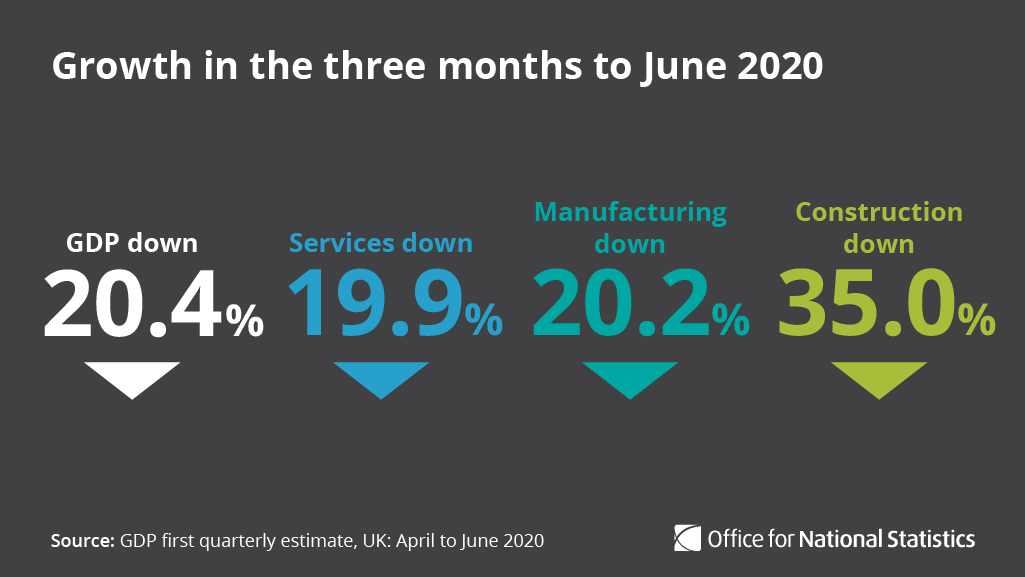
GDP fell 20.4% in Quarter 2 2020; with services (-19.9%) manufacturing (-20.2%) and construction (-35.0%) all experiencing record quarterly falls ow.ly/x96N50AX8dy Infographic text:  GDP down -20.4% Services down -19.9% Manu
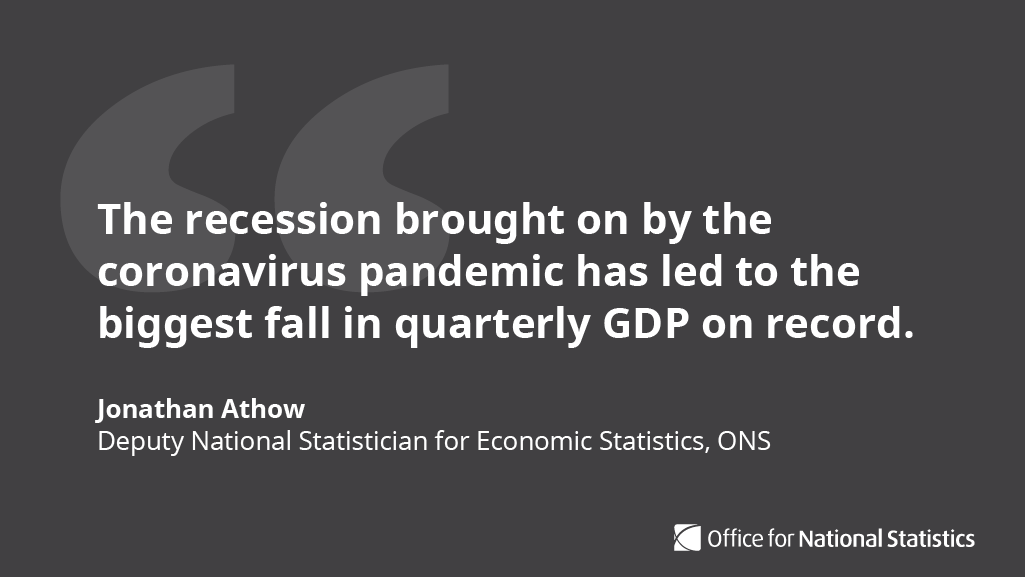
Commenting on today’s GDP figures for June and Quarter 2 @jathers_ONS said: ow.ly/grRF50AX8f1 1/2 Quote text: “The recession brought on by the coronavirus p
Read 11 tweets
30 Jul
For the first time, we’ve published comparisons of all-cause mortality between European countries, regions and local areas from January to June 2020 and compared with the five-year average ow.ly/dOMl50AM2IX
All-cause mortality voids the issue of different countries recording #COVID19 deaths in different ways.

This measure also considers indirect impacts of the pandemic, such as delayed access to healthcare ow.ly/lnLK30r1ANG
In the UK, excess mortality was seen in every local authority area during the peak weeks (week ending 3 April to week ending 8 May 2020).

However for other Western European countries excess mortality varied by local area in this time ow.ly/xWgr30r1AO2
Read 11 tweets
24 Jul
We’ve published updated analysis on #COVID19 deaths by local areas and deprivation.

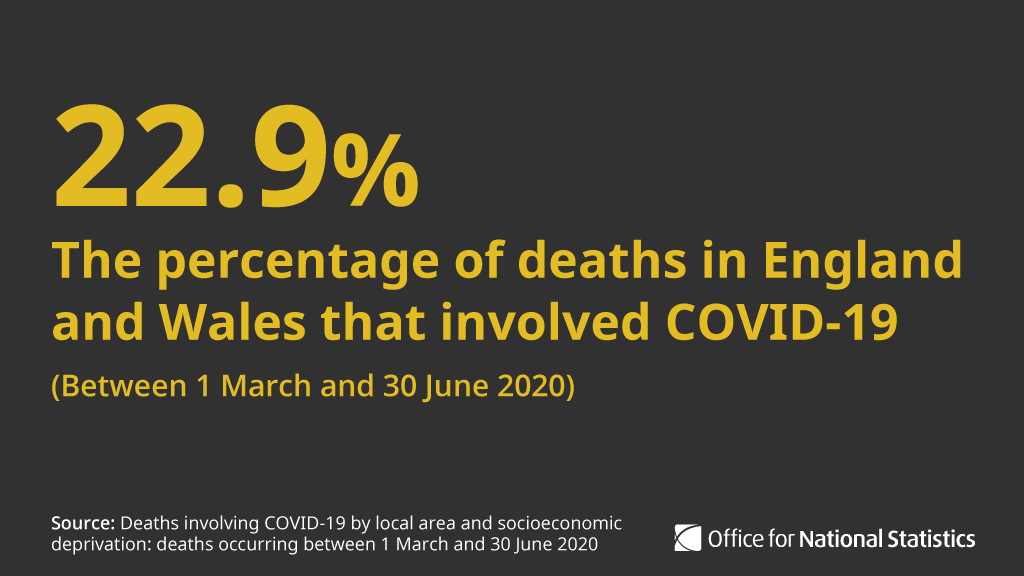
Between 1 March and 30 June 220,636 deaths occurred in England and Wales that were registered by 11 July.

Of those, 50,574 (22.9%) involved COVID-19 ow.ly/hwGA50AGVWv
We use “age-standardised mortality rates”, which allow for differences in the age structure of populations.

These allow us to make valid comparisons between different geographic areas ow.ly/qzZ030r0mtK
Between 1 March and 30 June there were 88.0 deaths involving #COVID19 per 100,000 people in England and Wales

▪️ 88.7 per 100,000 persons in England
▪️ 73.7 per 100,000 persons in Wales

➡️ ow.ly/CpmR30r0mur
Read 10 tweets

Did Thread Reader help you today?

Support us! We are indie developers!


This site is made by just two indie developers on a laptop doing marketing, support and development! Read more about the story.

Become a Premium Member ($3/month or $30/year) and get exclusive features!

Become Premium

Too expensive? Make a small donation by buying us coffee ($5) or help with server cost ($10)

Donate via Paypal Become our Patreon

Thank you for your support!

Follow Us on Twitter!