Pensjonerad Profile picture
Sep 14, 2020 12 tweets 5 min read Read on X
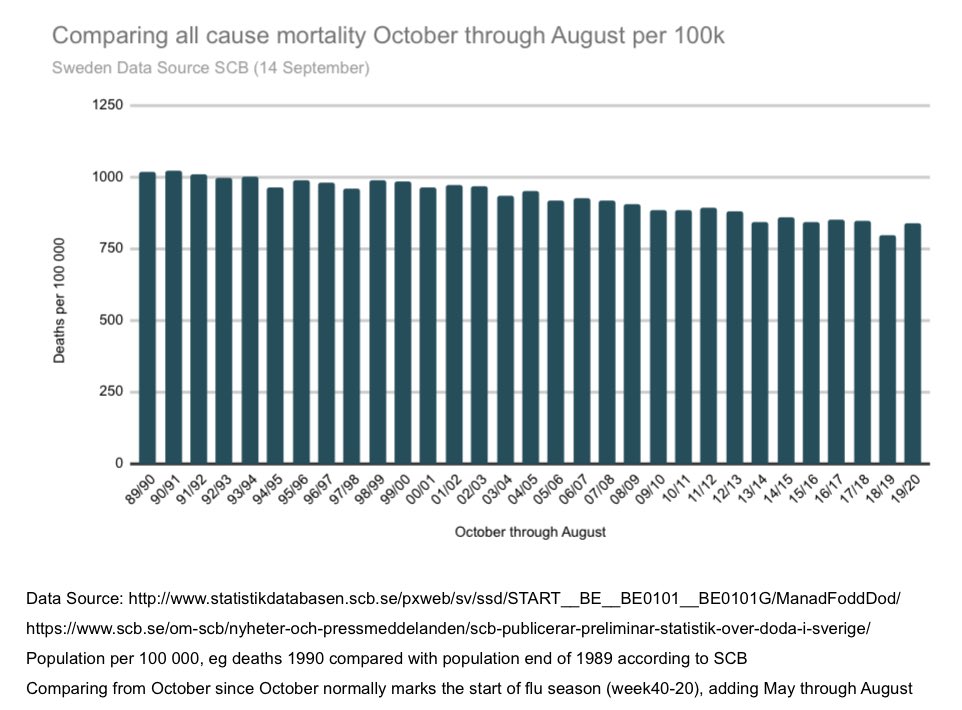
1/10 🇸🇪 Graphs updated including August. Only September left and this👇🏽 graph is complete. Comparing October through August looking at all cause mortality.

Following tweets will focus on all cause mortality in Sweden:
-No adjustments
-Crude adjustments
-ASMR
-Average
-Trend
+
2/10 Link to my previous thread will be in last tweet, containing more details on Swedish #covid19 data. This thread is shorter and focus on all cause mortality. Here we see January through August. 2020 similar to eg 2012, 2013 & 2015. +
3/10 Looking at rolling three months average we see that current short trend is down since spike in April and that the long trend in general is downwards as well probably due to better general health and better health services. +
4/10 Without adjusting for population growth we see that 2020 rise above average of 2015-2018 with as much as 2019 dips below, difference is 13 days of death. +
5/10 When looking at the same graph but adjusting for crude population growth the one year that is noticeable is 2019. #covid19sweden +
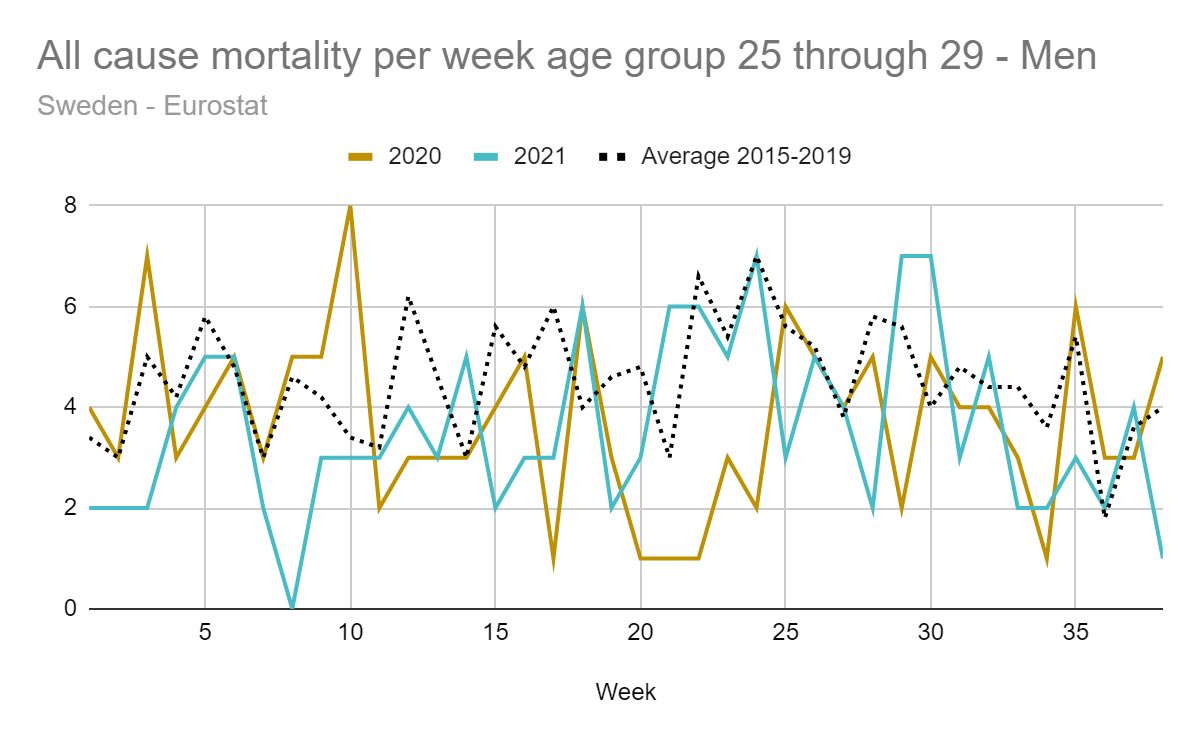
6/10 Additionally looking at age standardised mortality rates in Sweden between 2000 and 2020 (eurostat data week 1 through 34) we notice that so far year 2020 isn’t as apocalyptic as one would think. +
7/10 This is despite the bump between April and March due to #COVID19. Gladly we see that number of #covid19 deaths have plummeted and last 10 weeks have been at or below average deaths of 2015-2019. +
8/10 Finally two graphs looking at trend and average of past 20 years. April, as noticed above, is the month where the spike really occurred. +
9/10 It’s more pronounced when comparing to trend of past 20 years. However, both July and August have now been experiencing low all cause mortality. +
10/10 As indicated earlier👆🏽 this thread was shorter than my previous threads. More data can be found in threads linked below👇🏽
#COVID19SWEDEN
10/10.1 Additional graph to correct horisontal title in first tweet.

10/10.2 adding, thank you for input on graphs in tweet 6, 8 & 9:) @TTBikeFit

• • •

Missing some Tweet in this thread? You can try to force a refresh
 

Keep Current with Pensjonerad

Pensjonerad Profile picture

Stay in touch and get notified when new unrolls are available from this author!

Read all threads

This Thread may be Removed Anytime!

PDF

Twitter may remove this content at anytime! Save it as PDF for later use!

Try unrolling a thread yourself!

how to unroll video
  1. Follow @ThreadReaderApp to mention us!

  2. From a Twitter thread mention us with a keyword "unroll"
@threadreaderapp unroll

Practice here first or read more on our help page!

More from @HaroldofWorld

Feb 22, 2022
1/4 🇸🇪 🇩🇰 so many things happening globally but I think there is room for the Nordic age standardised mortality rate comparison. Last year I envisioned that I wouldn’t be interested in putting together this graph again since everything would be different re restrictions. >> Image
2/4 Little did I know that anti-vaxxer was going to be the most used derogatory term of the year and vacc.passports were going to be introduced only to be removed after they showed little to know benefit.

Currently all restrictions are dropped and life returns to normal…>> Image
3/4 In terms of ASMR, both Danes and Swedes seems to have survived yet another year despite the fact that everyone was supposed to die from either viruses or vaccines.

I will add Norway and Finland (maybe Scotland) to my graph when official figures are out and maybe this time >>
Read 4 tweets
Feb 4, 2022
1/6 🇸🇪 When we lift restrictions it’s worth reflecting on one of the measures, the vaccine passports implemented to restrict unvaccinated. Although rather limited in its application, they were nonetheless implemented. This was at a point when vaccine coverage were already… >>
2/6 pretty high. It now stands at 83,6% fully vaccinated in +12yo and ca 75% in age group 18-29. Older age groups have high coverage with around 90%.

This means that for the age group 18-29, with low covid related mortality, ca 25% have been excluded from certain activities >>
3/6 And not because they are criminal, but because… they spread more than others? Data suggests that isn’t the case (as seen below) or is it because the young tend to end up in ICU very often? >>
Read 6 tweets
Jan 11, 2022
1/9 In the before times, it was speculated that the Swedish experience during 2020 would result in lower mortality during 2021, this - for various reasons (excess mortality 2020 and 💉…) - seems to have become the case >>
2/9 It was also agreed that covid posed much less risk for younger people… now my 20 something year old colleagues - some of whom have had covid - are expecting to get boosted for the betterment of who exactly? >>
3/9 Amongst many things, my humble belief is that the arrival of the available vaccines (of which no evil shall be spoken) makes most sense in the elderly population, i.e the 1 perhaps two most leftward age columns👇🏽 >>
Read 9 tweets
Nov 1, 2021
1/5 🇸🇪comparing covid19 deaths unvacc and vacc (1+2 doses) between July and mid October.

Age group below 70: Ca 1,6 times as many non-vaccinated have died comp to vaccinated.

All ages: ca 4,8 times as many vaccinated have died compared with unvaccinated >>
2/5 comparing from reported covid cases in each group (vacc/non-vacc)

Age group below 70: 0,14% CFR in vacc group compared with 0,07% in non-vacc group.

Age group above 70: 8,81% CFR in vacc group compared with 13,20% in non vacc group >>
3/5 based on subpopulation ie average of population vacc vs non-vacc during the period.

All ages: 0,0047% death rate in vacc group compared with 0,0021% death rate in non-vacc.

& lastly a comp of age group below 70 but combining FoHM data with less reliable source >>
Read 5 tweets
Oct 6, 2021
1/8 🇸🇪 FOhM have chosen to pause the Moderna vaccine for those under 30 due to increased risk of… and it actually not being worth it🤭 In any case, the pandemic so far, in terms of mortality hve been looking quite mild for the young. This extends to the period of vaccinations >> ImageImage
2/8 And as I mentioned the other day, irregularities will stand out but might be due to many many factors.

Historic reference—> I read somewhere that some 400 individuals ended up with narcolepsy after the swine flu debacle. This was, at the time, a rather significant impact >> ImageImage
3/8 Now, however, we have learned that it was after all not such a big deal and the fuss made about it was exaggerated… >> ImageImage
Read 8 tweets
Sep 28, 2021
1/4 🇸🇪 -21, the year when reported AEs from vaccines exploded, why? Perhaps nobody new it was supposed to be done prior to 2021😐

Over 78k reports have been filed to Läkemedelsverket of suspected AEs. Ranging from mostly mild headaches to rare worse AEs (severe AEs in graph) >>
2/4 on a “normal” year it seems far less reports are being filed. Up until now it ca 10k covid related reports have been processed (priority given to severe AEs) and of those some 6k are considered severe AEs. See graph above👆🏽 >>
3/4 Depending on what the remaining not yet processed reports say we are bound to at least surpass previous years in reported severe adverse effects and deaths (already surpassed). >>
Read 4 tweets

Did Thread Reader help you today?

Support us! We are indie developers!


This site is made by just two indie developers on a laptop doing marketing, support and development! Read more about the story.

Become a Premium Member ($3/month or $30/year) and get exclusive features!

Become Premium

Don't want to be a Premium member but still want to support us?

Make a small donation by buying us coffee ($5) or help with server cost ($10)

Donate via Paypal

Or Donate anonymously using crypto!

Ethereum

0xfe58350B80634f60Fa6Dc149a72b4DFbc17D341E copy

Bitcoin

3ATGMxNzCUFzxpMCHL5sWSt4DVtS8UqXpi copy

Thank you for your support!

Follow Us!

:(