Chester W. Keltner (1909-1998) was a Chicago grain trader. He worked with successful traders who back-tested trading systems. He talked about Ten-Day Moving average trading rule in his book 'How to Make Money in Commodities' in 1960.
He did not claim that he invented the strategy so origin of this idea is uncertain. But people started referring it as Keltner channel after the book.
There are two versions of Keltner channel. First is explained by Keltner in his book, and the other one is a modified version.
There are two versions of Keltner channel. First is explained by Keltner in his book, and the other one is a modified version.
I will use 10-day period to explain the indicator. It can be calculated using any other period.
First format: There are three parts of Keltner channel explained by Keltner in his book:
1-ATP
2-Range
3-Channel
First format: There are three parts of Keltner channel explained by Keltner in his book:
1-ATP
2-Range
3-Channel
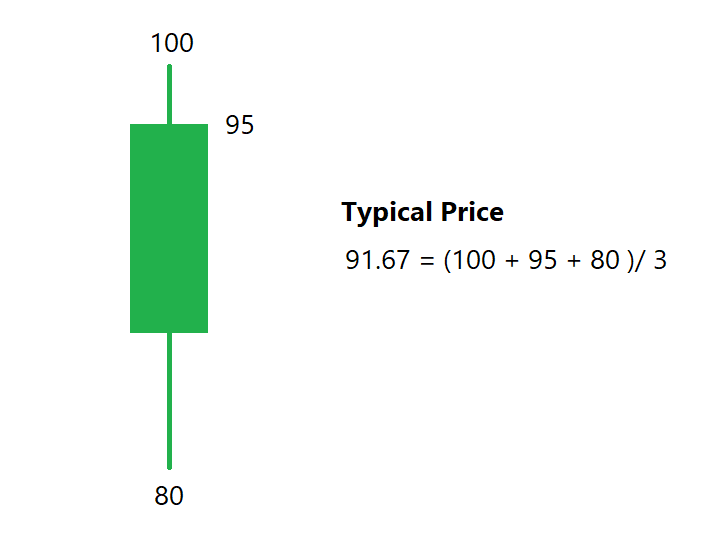
ATP: ATP is Average Typical price. Keltner calculated bands on Typical price instead of closing or High, Low price.
Typical price = (High + Low + Close) / 3
Average of Typical price of last 10 days is Average Typical Price (ATP). ATP is a Middle band of the indicator.
Typical price = (High + Low + Close) / 3
Average of Typical price of last 10 days is Average Typical Price (ATP). ATP is a Middle band of the indicator.
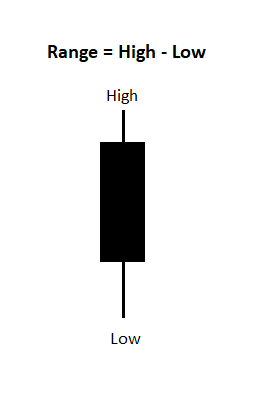
Range of any candle is a difference between the High and Low price.
We can calculate average of last 10 bar’s range.
We can calculate average of last 10 bar’s range.
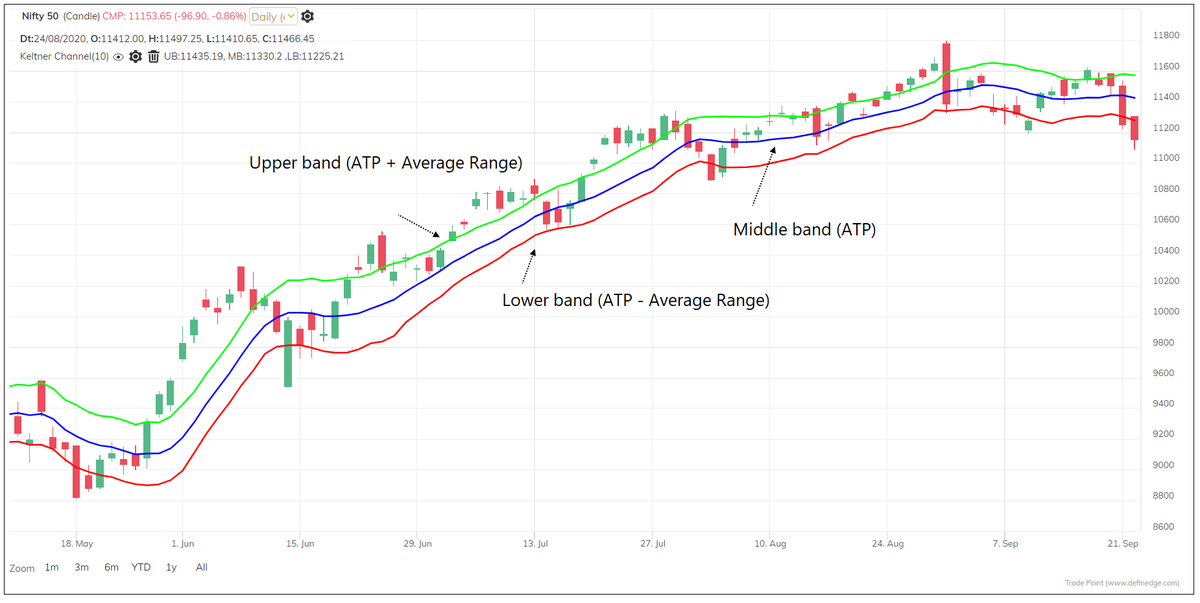
Keltner Channel:
Eg,
10-bar ATP of Nifty is 11000
10-bar Average range of Nifty is 100 points
Upper band = 11100 (ATP + Average range)
Lower band = 10900 (ATP – Average range)
Eg,
10-bar ATP of Nifty is 11000
10-bar Average range of Nifty is 100 points
Upper band = 11100 (ATP + Average range)
Lower band = 10900 (ATP – Average range)
Range is volatility. So, we can call them volatility bands.
The indicator was modified by Linda Raschke in 1980s.
Below are modifications:
1 – EMA instead of ATP
2 – ATR instead of Range
3 – ATR Multiplier range
The indicator was modified by Linda Raschke in 1980s.
Below are modifications:
1 – EMA instead of ATP
2 – ATR instead of Range
3 – ATR Multiplier range
EMA on closing price is calculated instead of Typical price.
EMA gives more weightage to recent data.
10-day EMA is a middle band of the modified version.
Average True Range (ATR) is a popular indicator devised by J. Welles Wilder.
EMA gives more weightage to recent data.
10-day EMA is a middle band of the modified version.
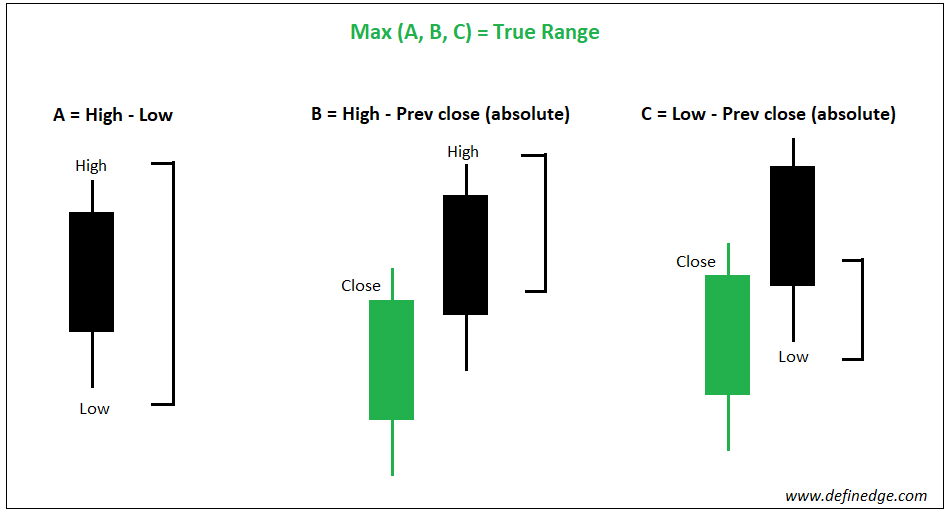
Average True Range (ATR) is a popular indicator devised by J. Welles Wilder.
True Range = Max of (Current High – Current Low, Current Low – Prev Close, Current High – Prev Close).
Calculate Average True range of last 10 bars. Multiply this value by ATR Multiplier to calculate the bands. Default ATR multiplier value is 2.
Calculate Average True range of last 10 bars. Multiply this value by ATR Multiplier to calculate the bands. Default ATR multiplier value is 2.
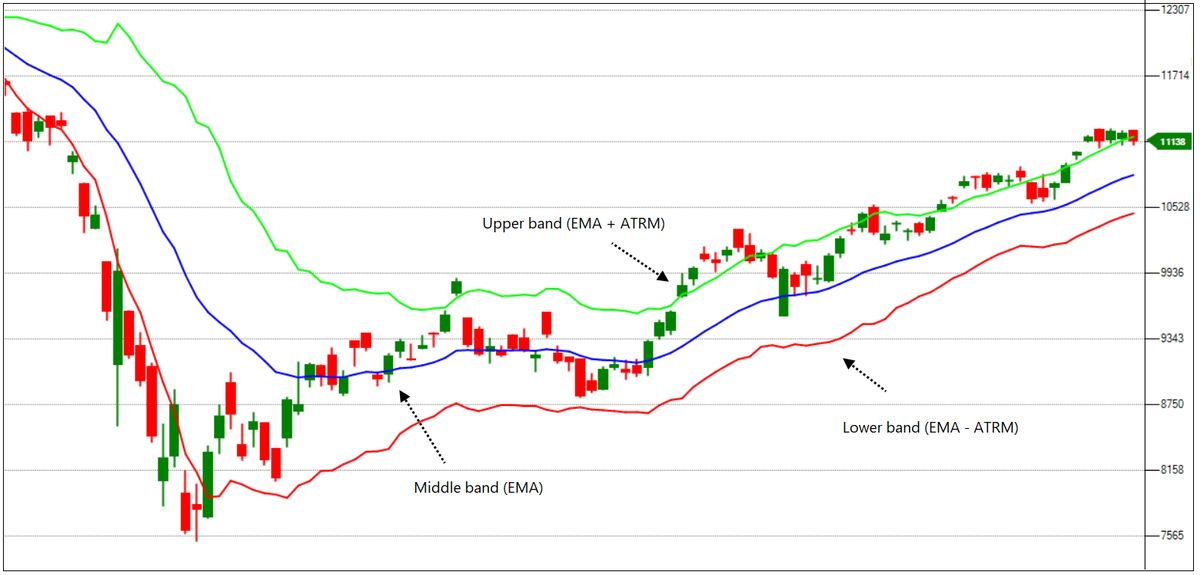
Keltner Channel - ATR:
Eg,
10-bar EMA of Nifty is 11000
10-bar ATR of Nifty is 100 points
ATR Multiplier is 2
Upper band = 11200 (EMA + (ATR * Multiplier))
Lower band = 10800 (EMA + (ATR * Multiplier))
Eg,
10-bar EMA of Nifty is 11000
10-bar ATR of Nifty is 100 points
ATR Multiplier is 2
Upper band = 11200 (EMA + (ATR * Multiplier))
Lower band = 10800 (EMA + (ATR * Multiplier))
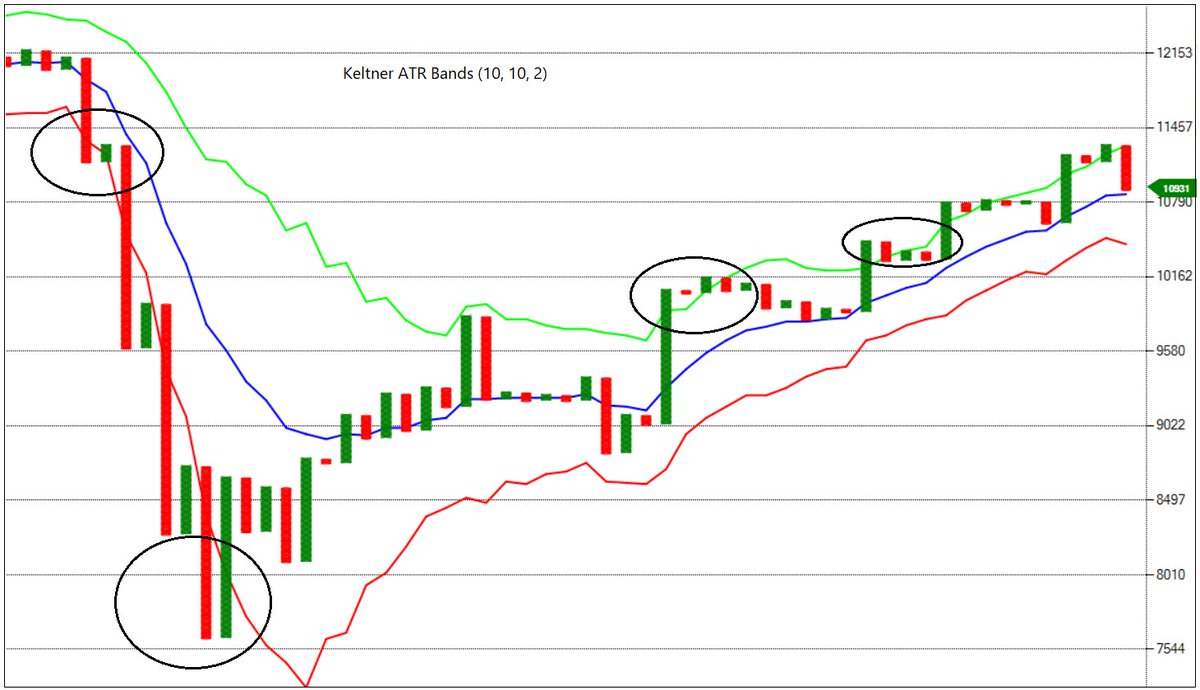
Clear about both the versions of Keltner channel? Most of the software plot this new version of indicator as Keltner channel indicator. We plot both the versions in TradePoint.
ATR is a popular choice for stoploss placement -
ATR is a popular choice for stoploss placement -
ATR in this indicator is calculated from the moving average and remember moving average smoothens trend.
So, basically these Keltner channels are ATR bands. Bollinger band uses standard deviation, Keltner channel uses ATR. Both are volatility-based channel indicators.
So, basically these Keltner channels are ATR bands. Bollinger band uses standard deviation, Keltner channel uses ATR. Both are volatility-based channel indicators.
You need to define 3 parameters in the indicator:
1-Length of moving average
2-ATR period
3-ATR multiplier
10 or 20 period moving average & 10-day ATR period is recommended. It can be experimented as per the preference.
Now, let's dissect & understand more about the indicator
1-Length of moving average
2-ATR period
3-ATR multiplier
10 or 20 period moving average & 10-day ATR period is recommended. It can be experimented as per the preference.
Now, let's dissect & understand more about the indicator
Moving average is a basic indicator we plot on the chart to identify the trend. ATR is indicator that measures the volatility.
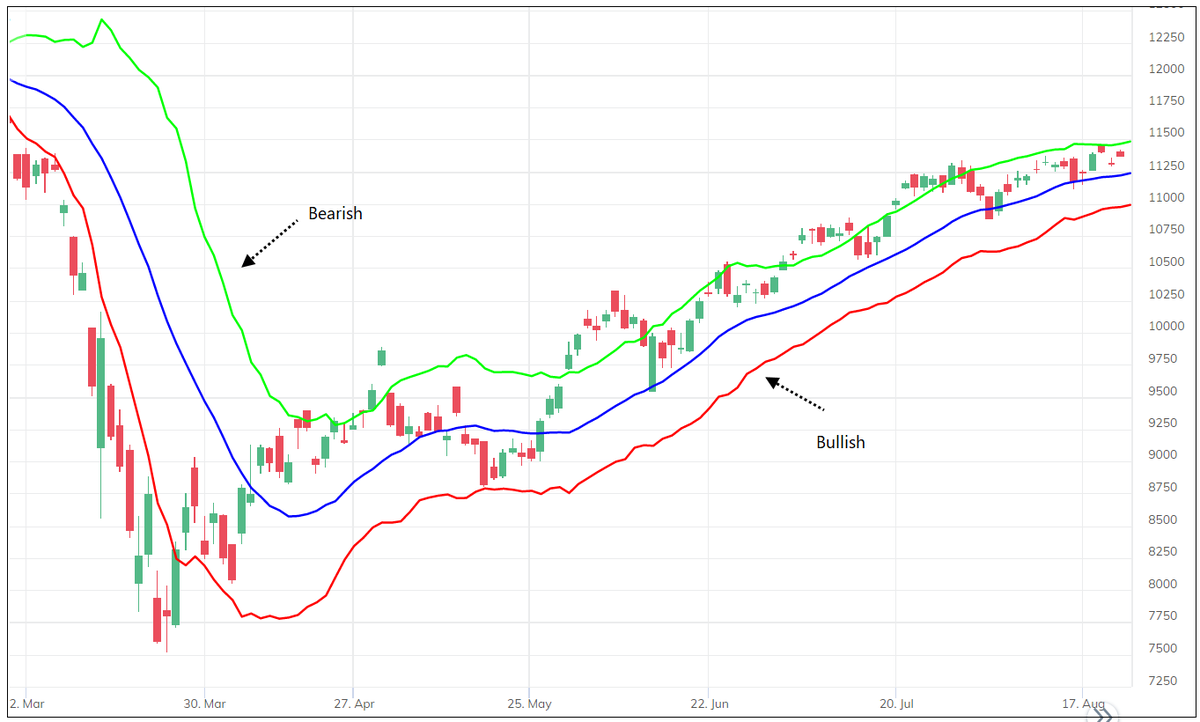
•Price > MA = Bullish
•Price < MA = Bearish
•Rising MA = Bullish
•Falling MA =Bearish
•Rising ATR = Volatile
•Falling ATR = Narrow range
•Price > MA = Bullish
•Price < MA = Bearish
•Rising MA = Bullish
•Falling MA =Bearish
•Rising ATR = Volatile
•Falling ATR = Narrow range
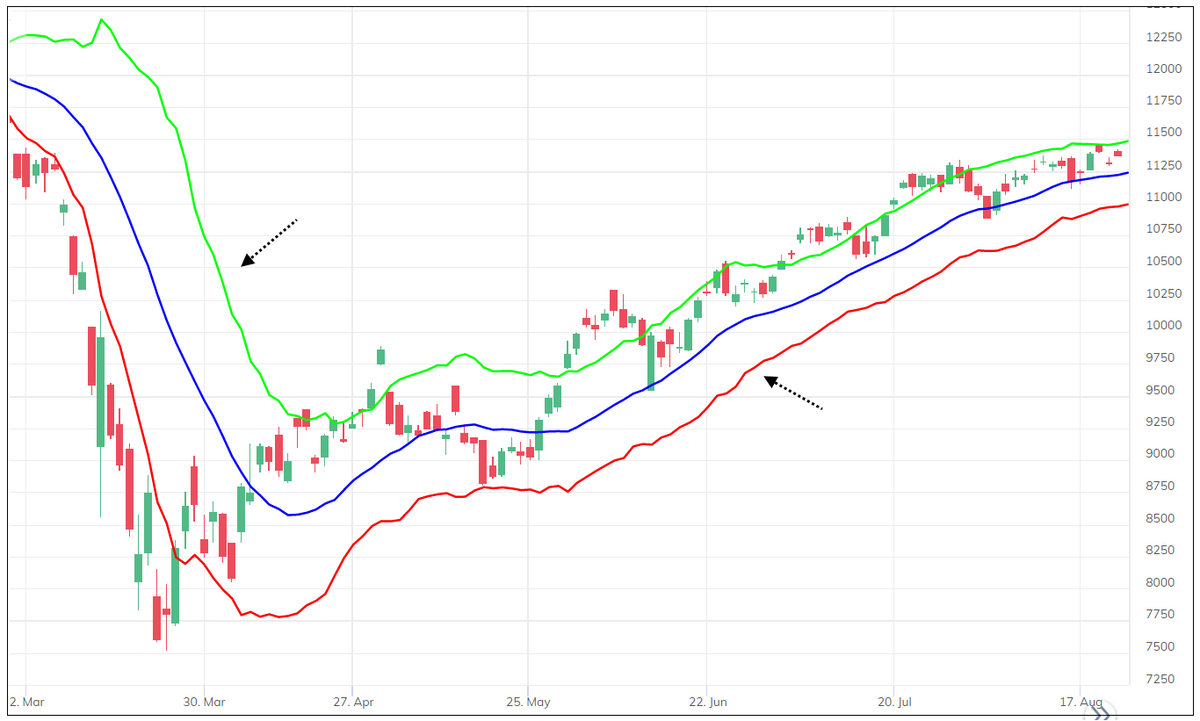
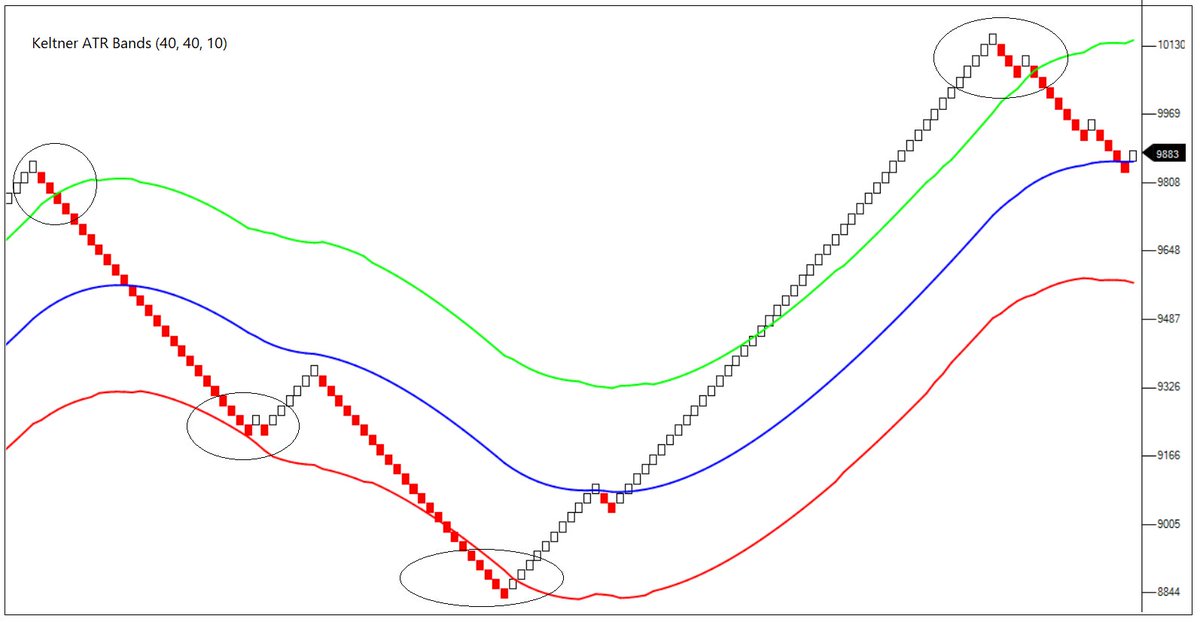
Remember, Keltner channels are calculated using the middle band.
We calculate middle band first in this case. So, rising channel mean EMA is rising (uptrend), and falling channel means EMA is falling (downtrend).
ATR Multiplier (ATRM) decides the range or width of bands
We calculate middle band first in this case. So, rising channel mean EMA is rising (uptrend), and falling channel means EMA is falling (downtrend).
ATR Multiplier (ATRM) decides the range or width of bands
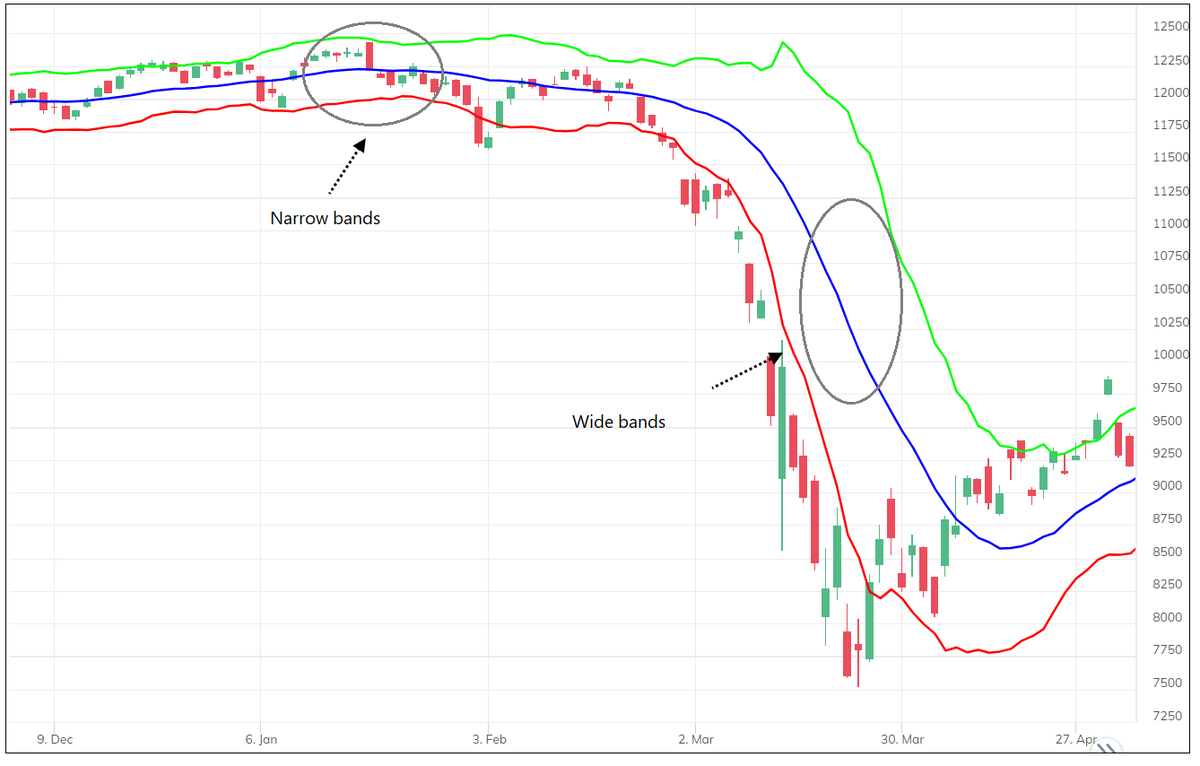
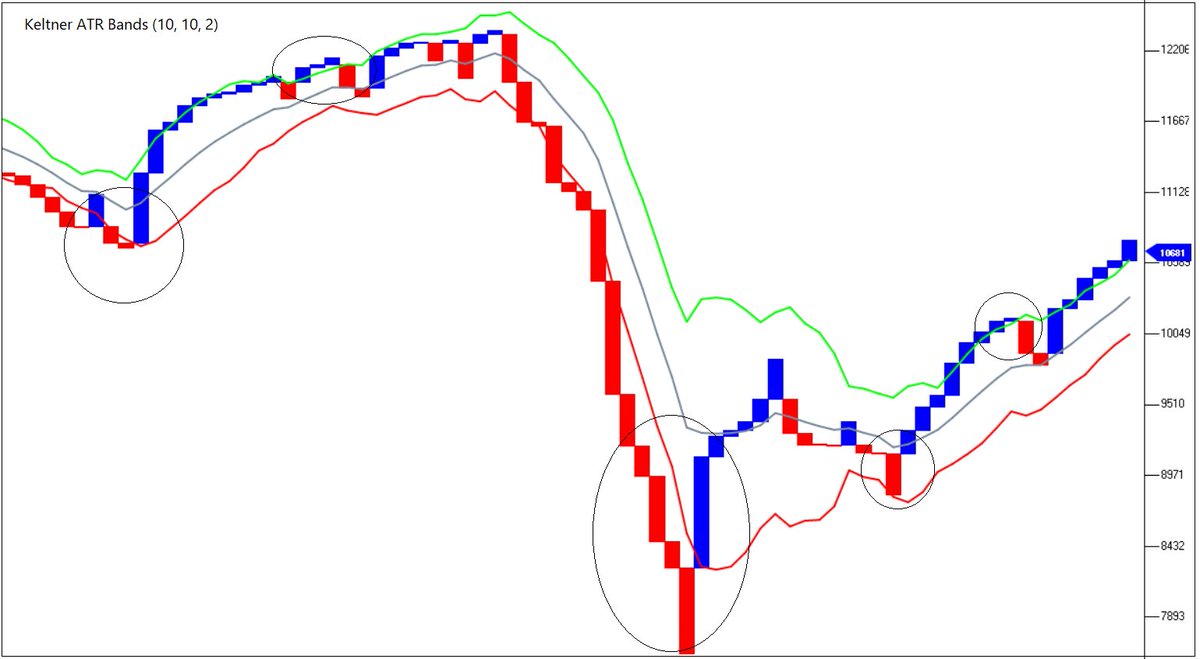
When price is above middle band & both bands are rising = Price is above MA & it is rising
When price is below middle band & both bands are falling = Price is below MA & it is falling
Difference bw bands is high = Volatility is high
Difference bw bands is low = Narrow range
When price is below middle band & both bands are falling = Price is below MA & it is falling
Difference bw bands is high = Volatility is high
Difference bw bands is low = Narrow range
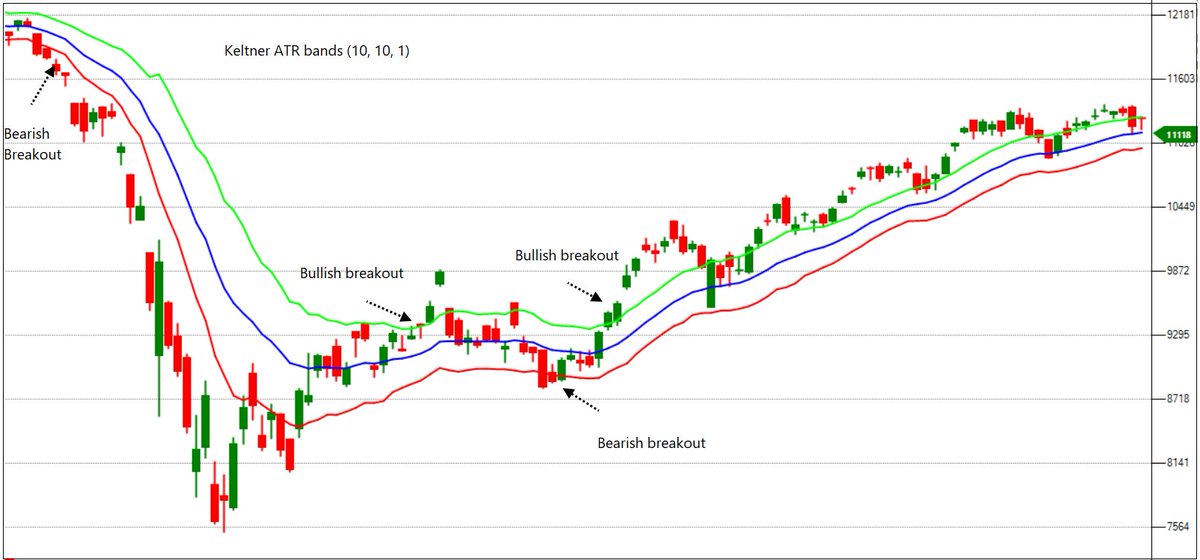
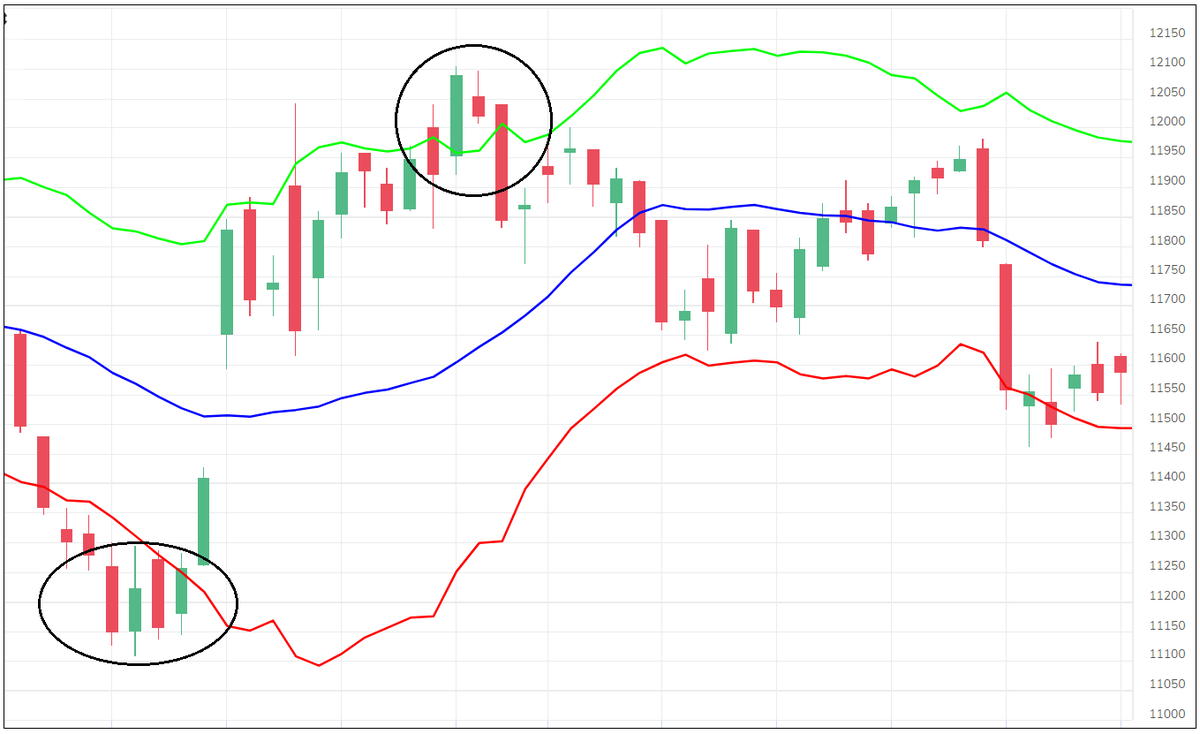
In simple words, implement bullish strategies when price is above upper band and bands are expanding. And vice versa. Isn't it?
Price closing above upper band is bullish because it shows volatility range breakout.
Price closing above upper band is bullish because it shows volatility range breakout.
This Band breakout strategy is useful but narrow bands when volatility is low & moving average is hovering around price can result in whipsaws. Behaviour of band changes as per the ATR multiplier used.
I recommend strategy A when ATRM is 1 & strategy B when ATRM is 2 or more.
I recommend strategy A when ATRM is 1 & strategy B when ATRM is 2 or more.
Strategy A: When ATR Multiplier is 1.
• Buy when price closes above upper band and follow the stop-loss of lower band.
• Sell when price closes below lower band and follow the stop-loss of upper band.
This is a SAR method (Stop and Reverse).
• Buy when price closes above upper band and follow the stop-loss of lower band.
• Sell when price closes below lower band and follow the stop-loss of upper band.
This is a SAR method (Stop and Reverse).
Strategy B: When ATR multiplier is 2 or more.
• Buy when price closes above upper band and follow the stop-loss of middle band.
• Sell when price closes below lower band and follow the stop-loss of middle band.
These are just to give idea about possibilities &
• Buy when price closes above upper band and follow the stop-loss of middle band.
• Sell when price closes below lower band and follow the stop-loss of middle band.
These are just to give idea about possibilities &
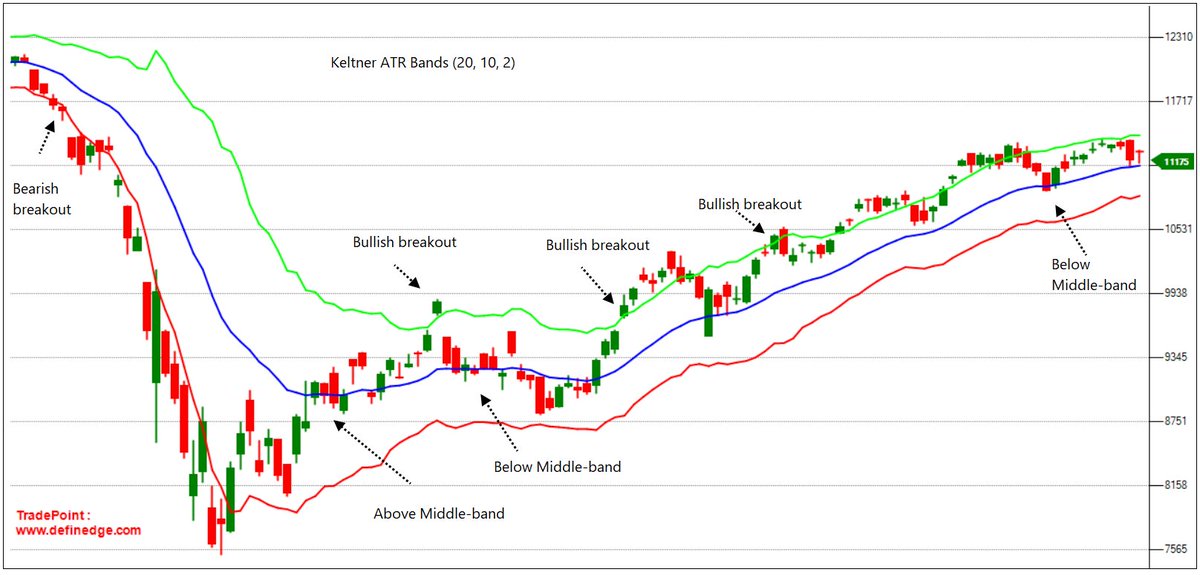
- explain the logic of indicator. Some other indicator can be used in combination with Keltner bands.
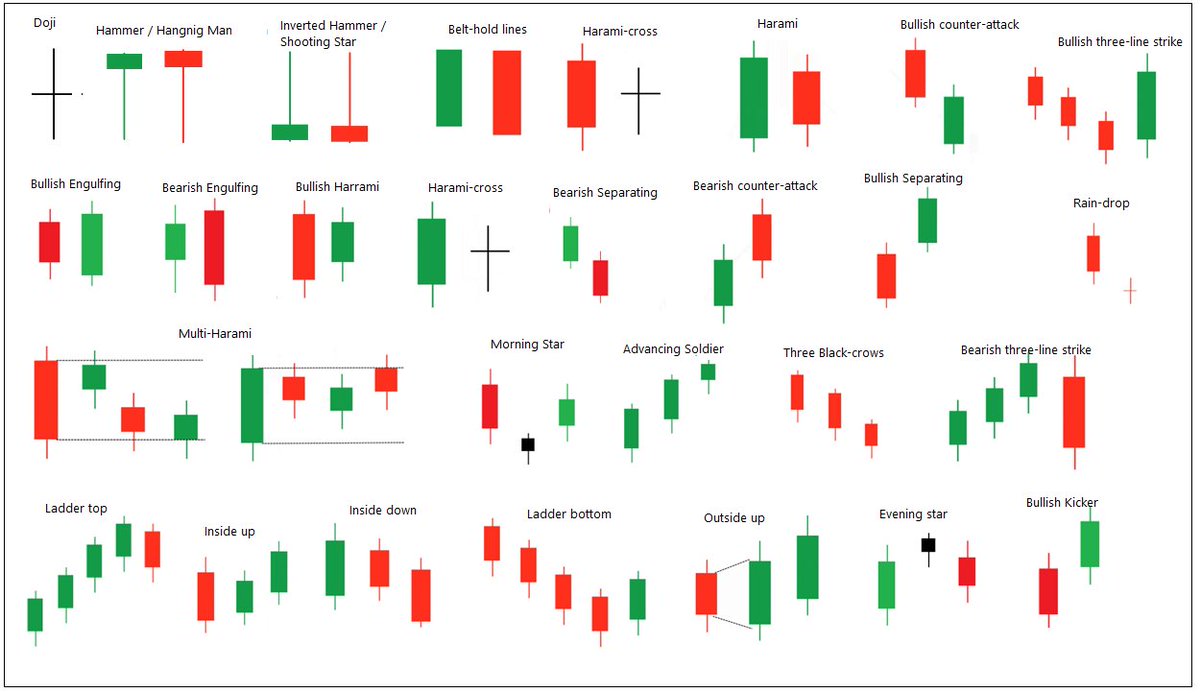
It is applicable on all types of charts and it can be traded with confirmation of price patterns as well. Continuation & reversal price patterns near band extremes are useful.
It is applicable on all types of charts and it can be traded with confirmation of price patterns as well. Continuation & reversal price patterns near band extremes are useful.
If you are following ATR, then you should explore this indicator. Experiment with parameters. Someone did that and indicator is modified. Logic of indicator remains same, volatility bands from average price. Formula was adapted to new possibilities.
<End of thread>
<End of thread>
• • •
Missing some Tweet in this thread? You can try to
force a refresh