India Vix has started rising, so I expect a bumpy ride ahead. Nifty has broken all supports. I was expecting a little more consolidation at upper levels, but it broke all supports pretty soon. Way Ahead? I don't know right now. 1/n...
@rohit_katwal We have formed LLLH so we are bearish. India Vix is at a resistance ready to rise. Being Friday, I will not carry forward position. I don't want to sell in the middle even if more drop is expected. Neither I want to catch a falling knife. Expecting Inside Bar. 2/n..
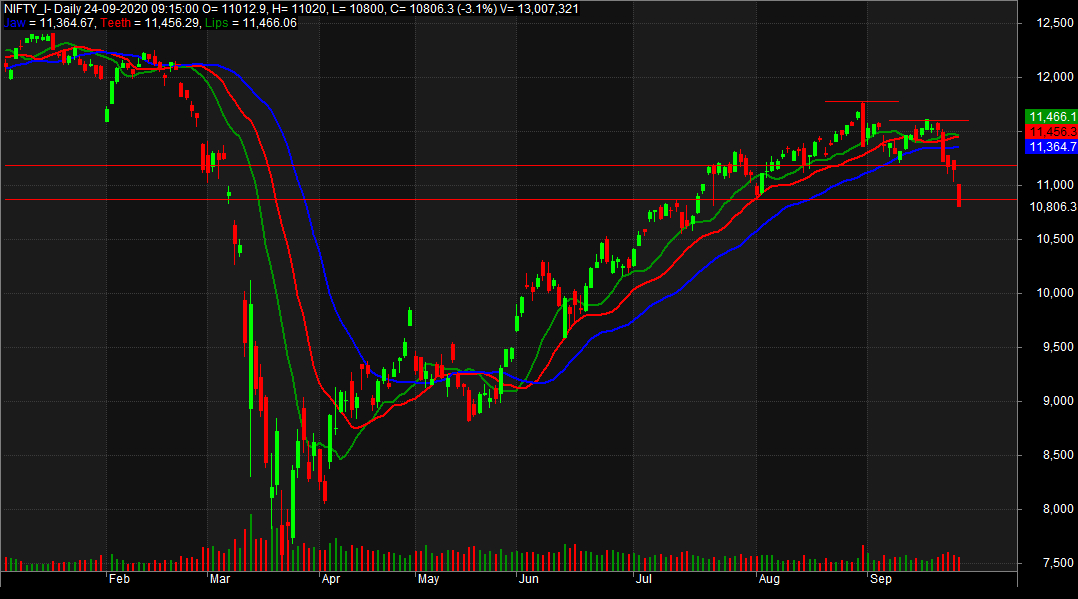
@rohit_katwal Selling is intense with volumes/short buildup. 11000 CE witnessed intense writing on weekly/monthly so should act as a temporary resistance now. Bearish view negates above 11250 which seems unlikely for now. Ideal strategy is to let Nifty Bounce and wait for 3/n...
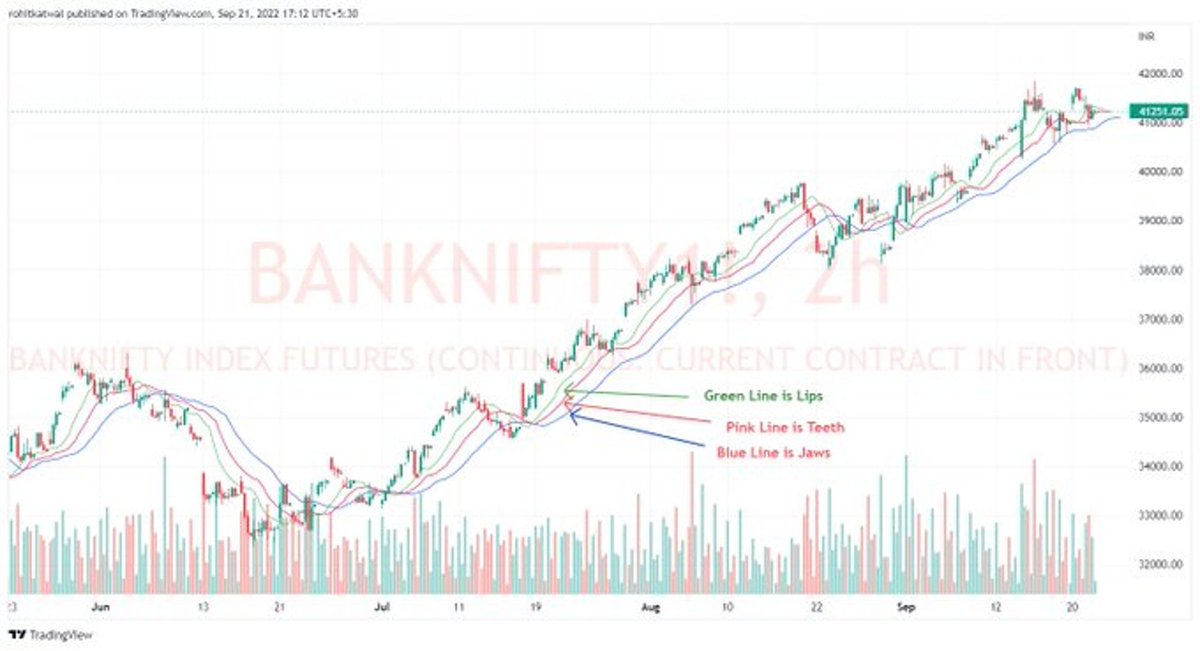
@rohit_katwal some consolidation and breakout before picking a direction. I am also looking at Vix as it is forming an interesting chart now. Its ready for explosion or cool off.
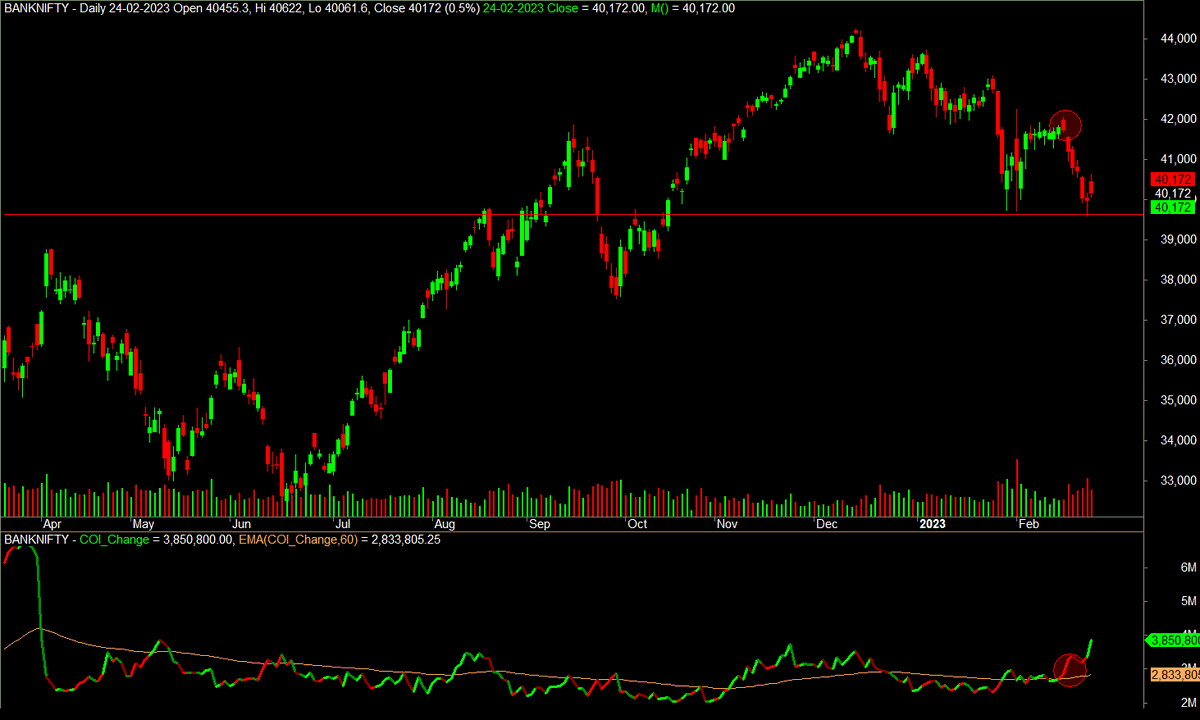
Check Bank Nifty COI and crazy shorts are added. Now I am looking at sustenance. 4/n...
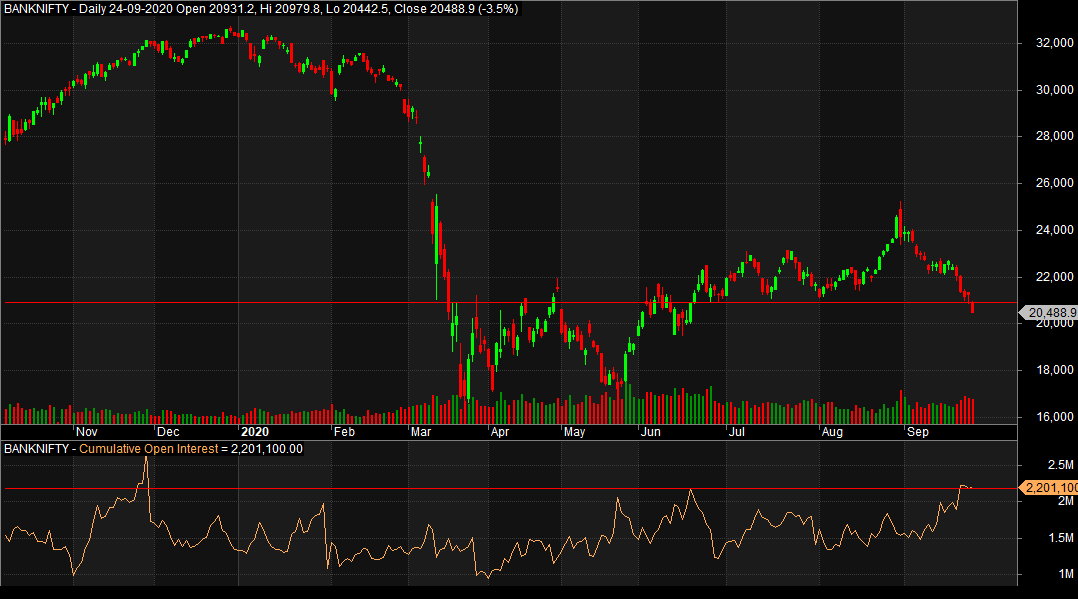
@rohit_katwal In short, very tricky place to be in. I am hoping to get an entry by Monday. If I don't, I am willing to sit this one out till I get one. On every rise, I will look for short or sideways trade. Considering longs only above 11250/22800.
• • •
Missing some Tweet in this thread? You can try to
force a refresh
Going forward, I am extremely cautious on BANKNIFTY.
I really was rooting for BANKNFITY to be bullish in coming days. Break of 39700 will take BANKNIFTY towards 37500 levels.
This is 1 Month Chart of BANKNIFTY. Break of 39700 (Support) will push prices further down.
On Daily Charts, we are standing at a support and gave a dead cat bounce. COI did not recede from this point but as you can see there has been continuous selling. At support, either this gives a bounce or indicative of incoming sell off.
MACD and ADX on Hourly Chart at support are getting sideways. Not bullish but just sideways.
Below 0 Line, MACD bullish is still a sideways market. ADX receding from 40-50 level below its EMA again a sideways sign.
At support, I will create positions will slight caution!
And yes, I am rightly worried. Its a neighbouring state.
This has been happening for past few months now. My immediate question was, what is the central government doing? I have no expectations from AAP. Or uprising of people of Punjab against such elements, as people themselves chose AAP. Many I talked with are regretting it now.
Today AAP might be the biggest threat to National Security. With Jammu and Kashmir stabilized, AAP might open a new frontier for Indian Government.
But no news media is showing this. Or Algorithms are not even picking it up. Why? Vested interest? But again back to question 1...
William's Alligator is probably the most underrated indicator in moving average category.
Alligator follows the premise that market is sideways for 70% of the time and trending only 30% of the time.
This is where William's Alligator can be a great tool for traders.
Why William's Alligator can be a great tool for traders?
It can identify Bullish, Bearish and Sideways market pretty easily. Problem is, traders don't know how to use it effectively. Alligator has three lines:
1. Lips - Fastest Line 2. Teeth 3. Jaws - Slowest Line
Book Interpretation is when Lips Crosses above Jaws, it's a buying opportunity and when below its a shorting opportunity. And when three lines are crisscrossing, instrument is sideways.
BUT this does not make it a tradeable indicator in practice. Here is what should be done.
I have no sympathies for #Scammers who were duping people with lakhs and crores of screenshots.
At first, I along with friends of mine were in awe of how they were generating this much return. For almost, 2 years I worked a lot and tried to break the code.
Do read and retweet.
A lot of ideas were worked upon on Amibroker may it be ITM Selling of Option, Option Doublers in 2 - 3 days, Intraday Option Buying, Future Holygrail and what not. In the process we were able to make Option Chain on Amibroker, calculate option greeks on Amibroker and what not.
But no definite system was built.
If we cracked up Option Buying or burst moves, it was difficult to ascertain position-sizing. For eg. position sizing average size, doesn't make the profit so lucrative. And if the position-size is big, loss could be 70% in 3 trades.
To understand options, three concepts are required: 1. Intrinsic / Extrinsic value 2. Time / Theta Decay 3. Implied Volatility
Option Value = Intrinsic + Extrinsic (Value)
Intrinsic Value - Value of Option if it were exercised today at CMP.
Extrinsic Value - Total Value of time in the option.
ATM and OTM options are 100% extrinsic value. ITM options have more intrinsic and less extrinsic value.
ITM Options: Intrinsic Value = Price of Underlying Asset -
Strike Price
For eg.
Nifty is at 11,416. 11400 CE of 29 Oct 2020 is at 224.40/-.
Intrinsic Value is = 11416-11400 = 16
Extrinsic Value is = 224.40-16 = 208.40.