Nearly 23,000 Covid-19 cases were reported today. This is due to a delay.

Analysis thread.
Public Health England have released a statement. It is here: gov.uk/government/new…

First, note that the Department of Health and Social care is the data controller for Pillar 2 tests. It passes these data to Public Health England, and DHSC are responsible for the data.
The statement says:
"we have identified that 15,841 cases between 25 September and 2 October were not included in the reported daily COVID-19 cases"
It continues
"Every one of these cases received their COVID-19 test result as normal and all those who tested positive who were advised to self-isolate."

This _sounds_ fine, but...
"NHS Test and Trace and PHE have worked to quickly resolve the issue *and transferred all outstanding cases immediately into the NHS Test and Trace contact tracing system* "
"All outstanding cases were immediately transferred to the contact tracing system by 1am on 3 October and a thorough public health risk assessment was undertaken to ensure outstanding cases were prioritised for contact tracing effectively."
The implications are that nearly 16,000 people were not contacted by NHS Test and Trace until this error was identified. Some of these cases go back to 25 September.
This is an absolute scandal. These individuals will not have had their contacts identified and those contacts may have become infectious and may have been spreading the virus.
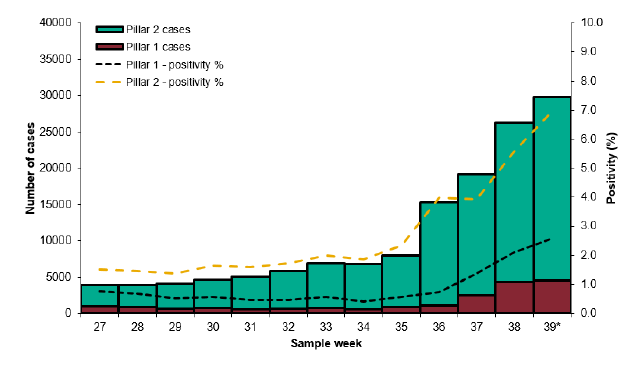
It is also clear that the testing element of NHS Test and Trace is inadequate. Positivity in some areas of the country have exceeded 15%. The World Health Organization sets 5% as a threshold above which not enough testing is being performed.
The commercial NHS Test and Trace system has failed. Local authority Directors of Public Health supported by Public Health England are the experts in public health. They should be given control of the resources currently within NHS Test and Trace.
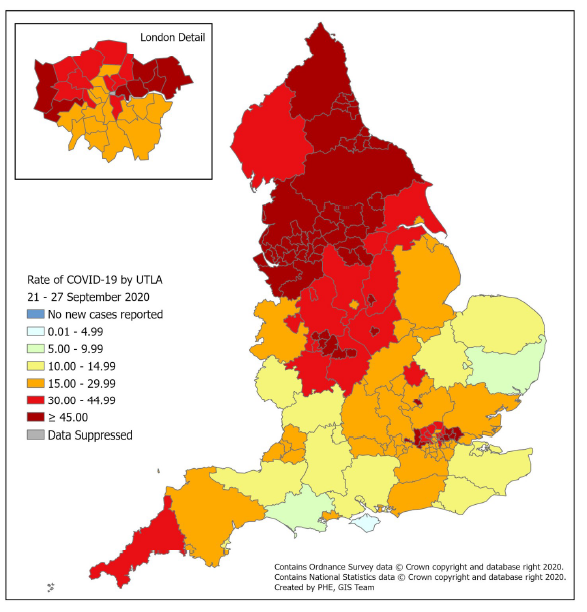
This is a map of the cases per 100,000 population reported in the last 7 days (which includes the 15,841 additional cases) Credit: @BavPay
This is a map of the cases per 100,000 population reported in the last 7 days for London (which includes the extra cases) Credit: @BavPay
Here is my interview with @SkyNews earlier today, prior to the release of the PHE statement

Here is my interview with @SkyNews today talking about the implications of the data delay


I will also be on @iaindale on @LBC at 7:10pm this evening.

• • •

Missing some Tweet in this thread? You can try to force a refresh
 

Keep Current with Dr Duncan Robertson

Dr Duncan Robertson Profile picture

Stay in touch and get notified when new unrolls are available from this author!

Read all threads

This Thread may be Removed Anytime!

PDF

Twitter may remove this content at anytime! Save it as PDF for later use!

Try unrolling a thread yourself!

how to unroll video
  1. Follow @ThreadReaderApp to mention us!

  2. From a Twitter thread mention us with a keyword "unroll"
@threadreaderapp unroll

Practice here first or read more on our help page!

More from @Dr_D_Robertson

5 Oct
We may be systematically underestimating R by excluding students in halls of residence. A Thread
We know that data on the Government Coronavirus dashboard is unreliable (see this thread)
We also know that we are not doing enough testing as the positivity rate is so high (7% overall for Pillar 2 tests and up to 15% in some areas such as Liverpool) (see this thread)
Read 9 tweets
4 Oct
New York compared with Liverpool: Schools

A Thread
The @WSJ is reporting that

"New York City on Wednesday will close public schools and nonessential businesses in parts of Brooklyn and Queens that have registered a week-long spike in coronavirus cases"

wsj.com/articles/new-y…
Let's look at New York and then compare to a UK city, Liverpool.
Read 13 tweets
3 Oct
.@NAOorguk @CommonsSTC - can you investigate the delays in today's Covid reporting? If it's just a delay in reporting, that's one thing, but if these are delays into NHS Test and Trace system, that's another thing entirely. Would be good to see age/source of delayed cases
It is important to understand the reason for the delay. If this is a reporting delay, that is bad enough, but if there have been delays in putting these cases into the NHS Test and Trace database, that can have serious implications for spreading the disease
We also need to know if there is commonality in the source of these cases. We have seen that private testing and university testing has been carried out, and it is still not clear how these results (both positive and negative) are being routed into the DHSC system.
Read 7 tweets
2 Oct
The latest Covid surveillance report has been published by Public Health England. Here is my commentary. The main point is that Covid is now widely established, not only in the north and the midlands but also north London and for the first time in Cornwall Image
The data is for week 39 (between 21 September and 27 September. First, positivity. This is the number of positive cases divided by the number of tests. It's now around 7%. THIS MEANS THAT NOT ENOUGH TESTS ARE BEING PERFORMED (@WHO recommend this does not exceed 5%) Image
Age pyramid of cases in the last two weeks. Mostly capturing younger people. Image
Read 15 tweets
2 Oct
Well done to @OfficialUoM for publishing positive Covid cases at the university. manchester.ac.uk/coronavirus/ca… This draws attention to the university, and raises questions as to why this hasn't been updated for a few days. But it is a good thing to be public, and should be encouraged. Image
.@sheffielduni also publish data - well done, particularly for keeping the info up to date. sheffield.ac.uk/autumn-term-20… Image
We can see apparent outbreaks at other universities. Here's the location of @UniofExeter (21-27 September cases) - would be good to have a dashboard of cases. Image
Read 8 tweets
1 Oct
Comment on the proposed Merseyside / Liverpool 'lockdown'. Let's look at Liverpool. #merseyside #liverpool
Some say that cases are plateauing and therefore there isn't a problem. From the data, this could be the case. Image
Liverpool is at around 150 cases per 100,000 in the last PHE report Image
Read 7 tweets

Did Thread Reader help you today?

Support us! We are indie developers!


This site is made by just two indie developers on a laptop doing marketing, support and development! Read more about the story.

Become a Premium Member ($3/month or $30/year) and get exclusive features!

Become Premium

Too expensive? Make a small donation by buying us coffee ($5) or help with server cost ($10)

Donate via Paypal Become our Patreon

Thank you for your support!

Follow Us on Twitter!