Some weekly #torontorealestate sales numbers in this thread. Firstly, week over week pattern this year continued to follow same as last year (only couple of deviations on here, main one being Labour Day one week later this year). /1 Image
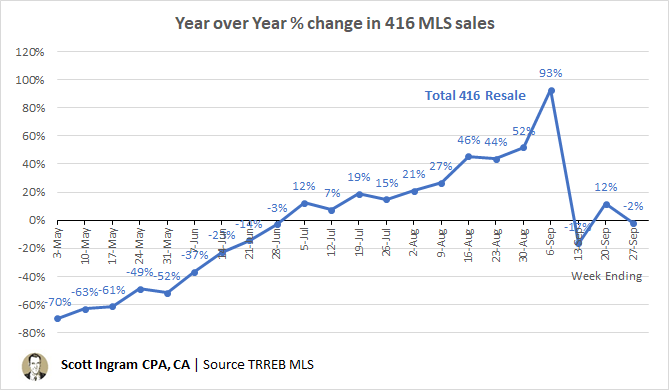
The total sales in the 416 in the past 4 weeks cumulative have been just 1% below 2019, with this week being flat. /2 Image
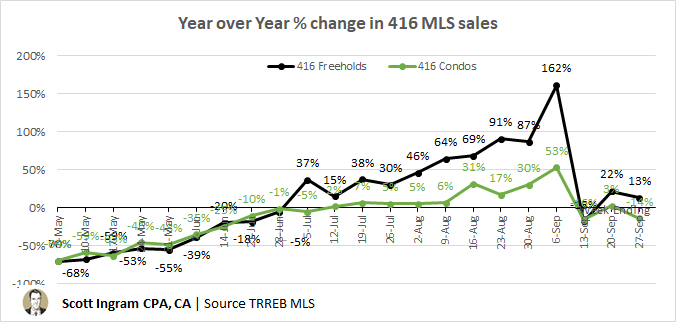
But "tale of two cities" continues, with freehold (lowrise houses) selling stronger than last year and condos (apts and townhouses combined) selling weaker of late (and didn't show the huge "pent-up demand" that houses did. /3 Image
Here are the absolute numbers, with freeholds higher than condos the last 3 weeks. Fall is usually a boost period for houses (condos aren't as seasonal), but still it's abnormal for house sales to be > condos (full year numbers usually 60/40 for condos). /4 Image
Here's what I mean with freehold seasonality. Can see is transacting at higher volumes than 2019, but should be on the way down now until end of year. /5 Image

• • •

Missing some Tweet in this thread? You can try to force a refresh
 

Keep Current with Scott Ingram CPA, CA

Scott Ingram CPA, CA Profile picture

Stay in touch and get notified when new unrolls are available from this author!

Read all threads

This Thread may be Removed Anytime!

PDF

Twitter may remove this content at anytime! Save it as PDF for later use!

Try unrolling a thread yourself!

how to unroll video
  1. Follow @ThreadReaderApp to mention us!

  2. From a Twitter thread mention us with a keyword "unroll"
@threadreaderapp unroll

Practice here first or read more on our help page!

More from @areacode416

6 Oct
TRREB has released its September #torontorealestate numbers. They like to accentuate the stats that would indicate everything is awesome, but let me point out 5⃣ STATS SHOWING MARKET COOLING ❄️ /1 Image
First let me say it's not a COLD market yet by any means. But problem is everyone just likes to look at YoY change. When you think about it, 12 months is a somewhat arbitrary period to compare to. So September sales are way ⬆️(42%) and average prices are also ⬆️ (14%) /2 Image
1⃣ AVERAGE YoY PRICE GROWTH IS SLOWING.

In July it was +16.9%
In August it was +20.1%
In September that slowed right down to +14.0%

Note a good chunk of the price growth is due to mix (less condo apts, more detached). /3
Read 10 tweets
29 Sep
Bonus Tuesday #torontorealestate chart content. Here's an update weekly 416 sales year-over-year. Can see how unusually down was during COVID, then unusually up when things started re-opening. Spike week ending 9/6 was b/c normal week this year but Labour Day week last year. /1
Reverse is true for week ending 9/13 (includes Labour Day this year). That blue line was condo and freehold combined. This is separated. Can see the big YoY sales increases really driven by freeholds. /2
Here's a look at the absolute numbers underlying the freeholds. Post-June is consistently higher than last year. /3
Read 4 tweets
29 Sep
Tuesday - who's ready for some 416 Active Listings?

First up, Condos. Added 179 listings in the last week (⬆️3.0%). Slower growth than last 2 weeks. We're going to have a new record at the end of the month (for any month). Of course, way more condos built now than 25 yrs ago. /1 Image
Last year, condos peaked the week before this one and then declined each week until January. Not sure when active listings are going to stop growing this time. At least it's slowing down a little. Added 179 last week. Average for 19 weeks preceding was +200. /2
Freeholds added 52 this week (⬆️1.9%). Still 84 below what was at this time last year (while Condos more than double). Houses normally decline now through end of year except for slight bump after Thanksgiving. Can see is less "fresh" listings here than couple weeks ago. /3 Image
Read 6 tweets
24 Sep
Looked at 416 condo MOI right as of today, and compared Downtown (C1 and C8 are south of Bloor between roughly Dufferin and DVP) and rest of city.

DT definitely smarting more (I've def seen ⬇️ price pressure). Is 45% of listings, but was only 29% of sales in last 30 days. /1 Image
FOR LEASE: DT is 62% of active listings and 58% of leases in last 30 days. For all talk about terrible rental market, it's not like leases have stopped. Has been nearly 3800 in last 30 days. Might be some people shuffling from A to B to take advantage of lower rents. /2
Non-DT had 2.4x the sales in the last 30 days as DT.

For leases, there's still more DT activity, with 1.4x more leases in last 30 days than non-DT. /3
Read 4 tweets
23 Sep
Weekly 416 Sold Over Asking numbers. Haven't shared in a while.
Freeholds still chugging along at numbers only seen in record-sales year 2016. Took sharp upturn last week (but one week doesn't mean trend, could be blip). /1 Image
Same in 20% over asking. Strongest numbers since 2016 for last 3 months. I track this as one indicator of market heat 🔥. In years I've tracked, the peaks for these stats have coincided with frothiest periods (spring 2017 (red), Feb/Mar 2020), and drops in uncertain times. /2 Image
Condos also showing all-time highs in last 3 months. Part due to "delayed spring" catch up of sales activity. This one doesn't seem to jive with growing weakness in the market. Could be a shift in WHY agents use this strategy... /3 Image
Read 4 tweets
22 Sep
Weekly live look-in at 416 Active Listings 👀
Bit less Freehold inventory than last couple of years.
Way more Condo inventory than last couple of years.
Let's look a bit deeper... /1 Image
The following two charts are on the same scales. Amount of 30+ day listings are in the same ballpark, but you can see percentage of "fresh" listings is a lot higher on Freehold (30.6% vs. 23.8%). /2 ImageImage
Rolling 30 days of sales held even for Condos, but listings rose again, so MOI edged up. Now highest since May 19, when it was on the way down from COVID peak. Freehold held same as R30 sales +3.5% from last week, and listings +2.4%. /3 Image
Read 5 tweets

Did Thread Reader help you today?

Support us! We are indie developers!


This site is made by just two indie developers on a laptop doing marketing, support and development! Read more about the story.

Become a Premium Member ($3/month or $30/year) and get exclusive features!

Become Premium

Too expensive? Make a small donation by buying us coffee ($5) or help with server cost ($10)

Donate via Paypal Become our Patreon

Thank you for your support!

Follow Us on Twitter!