Colorado is committing suicide.
CDC excess death data shows since June 20 more than twice as many Coloradans have died from @GovofCO @CDPHE and local restrictions than have died from Covid.
310 with Covid, 787 from response.
Literally suicide.
Details follow.
1/9
CDC excess death data shows since June 20 more than twice as many Coloradans have died from @GovofCO @CDPHE and local restrictions than have died from Covid.
310 with Covid, 787 from response.
Literally suicide.
Details follow.
1/9

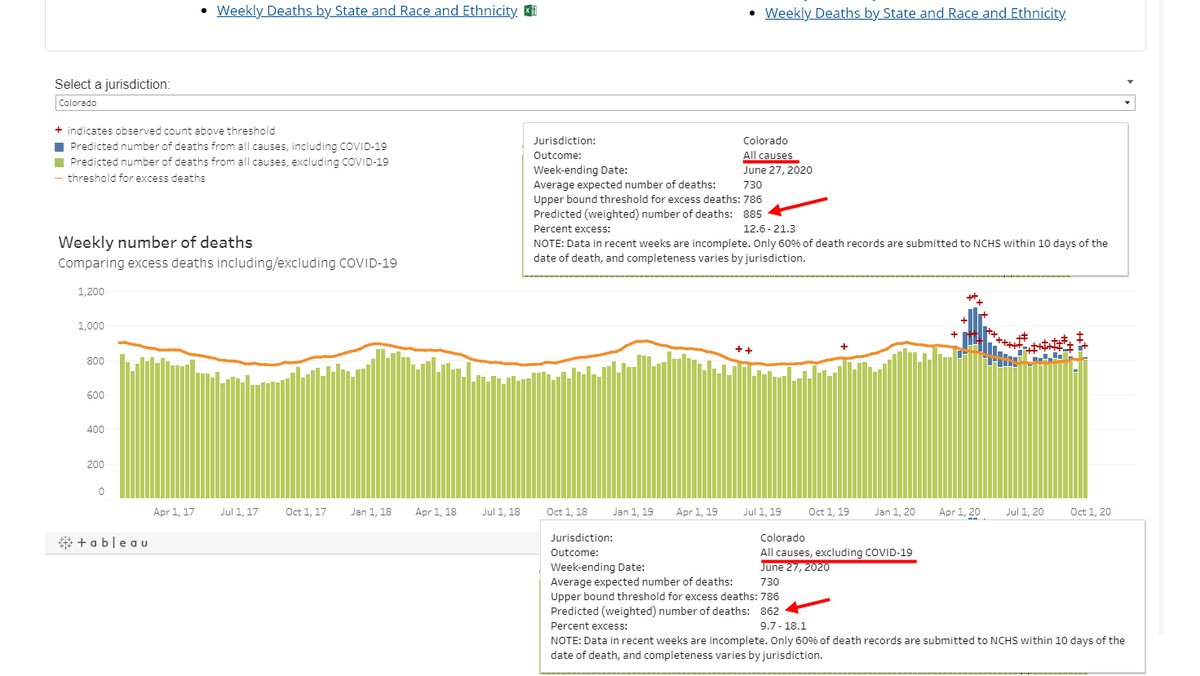
The CDC tracks the total number of deaths for the country and each state. Any deaths over the expected number of deaths are “excess” deaths.
Note: CDC data takes a while to collect and publish so data is through Aug 22.
Data here: cdc.gov/nchs/nvss/vsrr…
2/9
Note: CDC data takes a while to collect and publish so data is through Aug 22.
Data here: cdc.gov/nchs/nvss/vsrr…
2/9
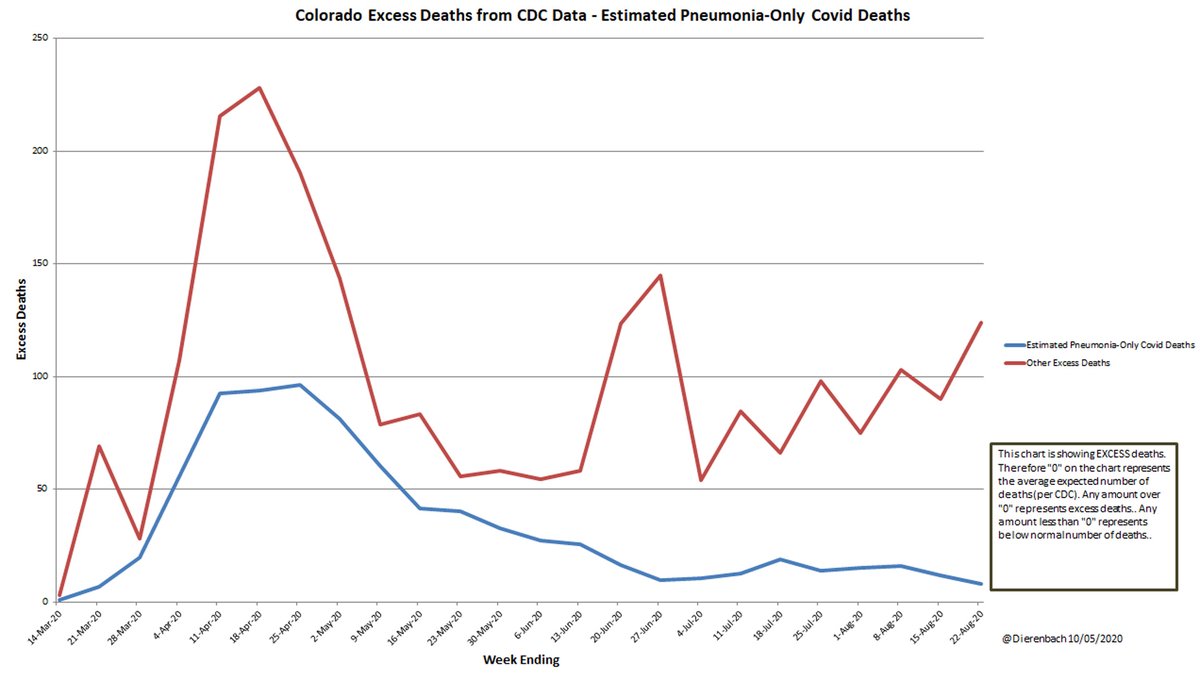
In CO, Covid caused a massive spike in excess deaths March-May. The BLUE line.
However, aside from Covid, CO saw above normal fatalities. The RED line.
The red line has exceeded the blue line since June 20. Since then, deaths from our response have exceeded Covid deaths.
3/9
However, aside from Covid, CO saw above normal fatalities. The RED line.
The red line has exceeded the blue line since June 20. Since then, deaths from our response have exceeded Covid deaths.
3/9
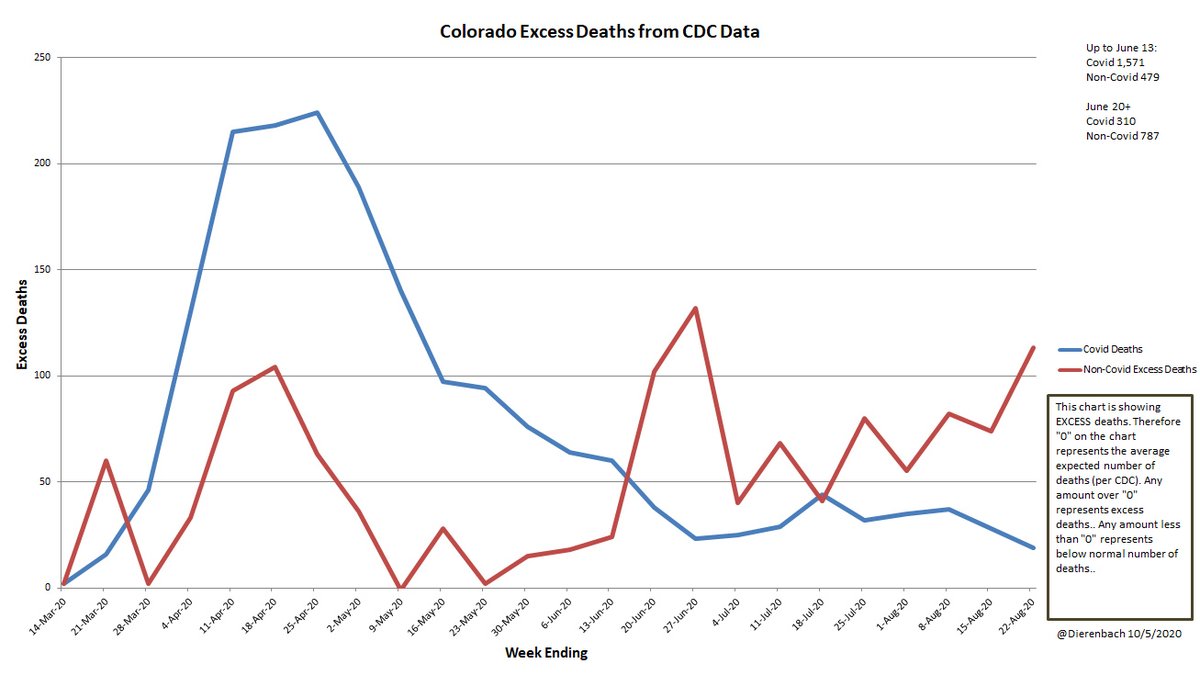
For example, CDC data shows week of June 27, CO average expected number of deaths is 730, yet 885 people passed. 862 Of those did not die with Covid.
That means there were 132 excess non-Covid deaths (862-730) and 23 Covid deaths that week (885-862).
4/9
That means there were 132 excess non-Covid deaths (862-730) and 23 Covid deaths that week (885-862).
4/9
@GovofCO claims his measures are saving lives, but they aren’t. They're literally killing more people than Covid.
It's time to stop this insanity & for all but the vulnerable, return to our normal healthy Colorado life style.
Ending the panic & restrictions will save lives
5/9
It's time to stop this insanity & for all but the vulnerable, return to our normal healthy Colorado life style.
Ending the panic & restrictions will save lives
5/9
There are many causes for the excess deaths. I wrote about some of them in June.
pagetwo.completecolorado.com/2020/06/11/die…
6/9
pagetwo.completecolorado.com/2020/06/11/die…
6/9
And yes, I am counting all of the non-Covid excess deaths as being caused by the reaction to Covid.
That is, if it weren’t for Covid and the insane reaction to Covid, Colorado would be experiencing an average number of deaths.
7/9
That is, if it weren’t for Covid and the insane reaction to Covid, Colorado would be experiencing an average number of deaths.
7/9
Also, some countries only count pneumonia deaths. The thinking is if one dies of Covid & a comorbidity is something it doesn’t typically cause (like dementia or circulatory disease), patient was likely seriously ill already. In contrast, Covid can cause pneumonia on its own.
8/9
8/9
CDC shows pneumonia as a comorbidity in about 43% of Covid deaths. If these are the only true Covid deaths & others are people who primarily die from other causes exacerbated by Covid, then:
Reaction deaths outnumber Covid deaths 3:1 (see graph)
We are killing ourselves.
9/9
Reaction deaths outnumber Covid deaths 3:1 (see graph)
We are killing ourselves.
9/9
• • •
Missing some Tweet in this thread? You can try to
force a refresh