(1/19) #covid19 Sweden. Respiratory illness IFR varies greatly with age. This season the demography-adjusted all cause mortality has been historically low in all available age brackets. A reminder that demography is a crucial factor in susceptibility that shouldn’t be overlooked. 


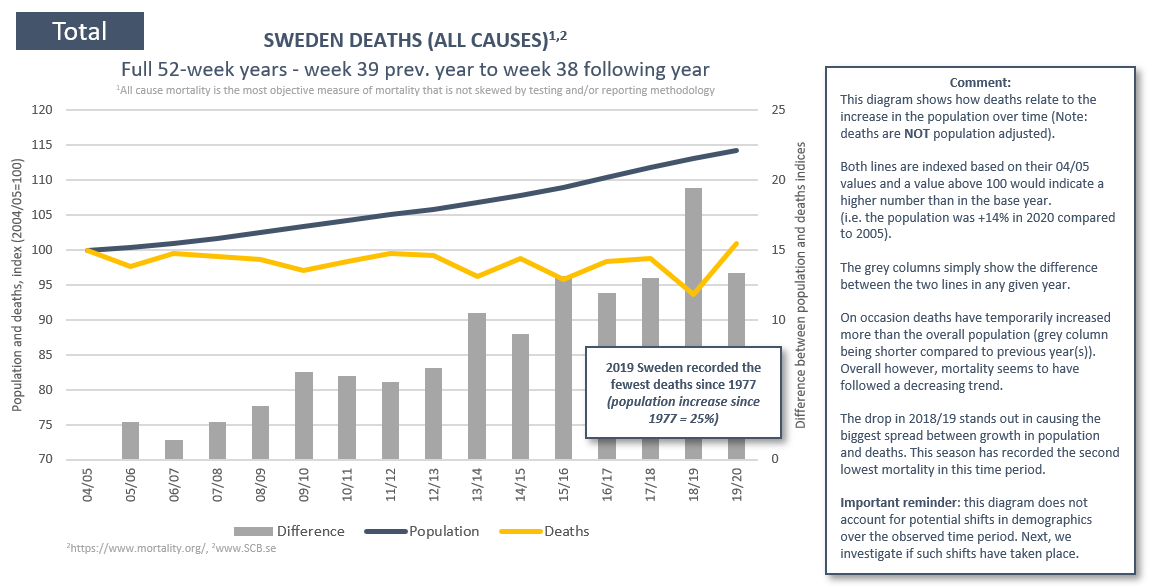
(2/19) We will explore two types of diagrams for each age bracket. The first type is straightforward. In the second one you would expect the yellow lines to follow the blue lines if mortality in that age bracket remained constant (and the grey columns to remain close to 0).
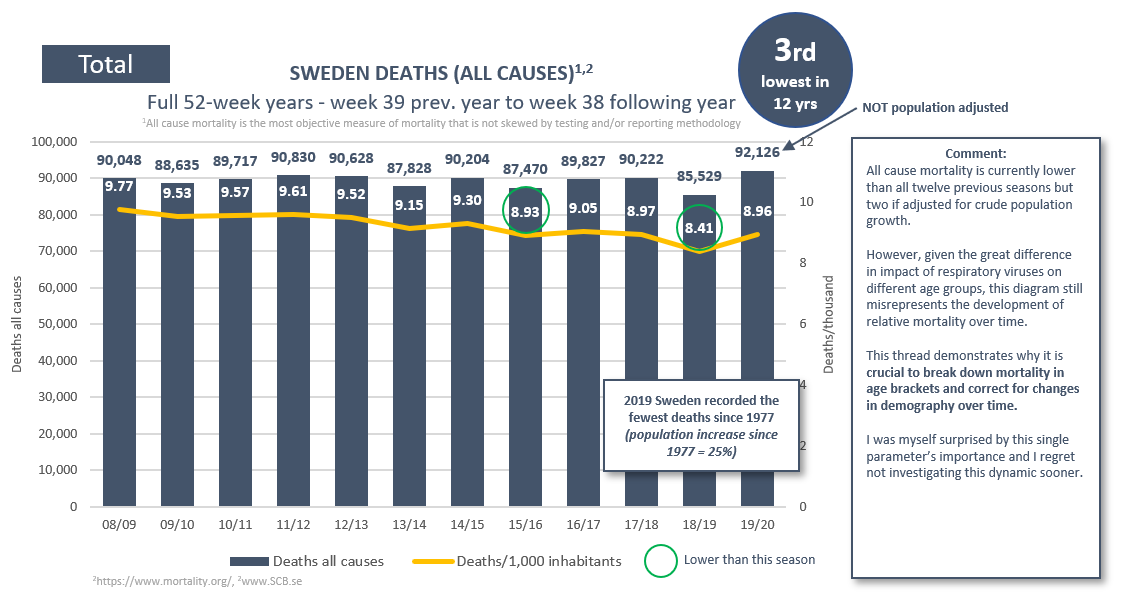
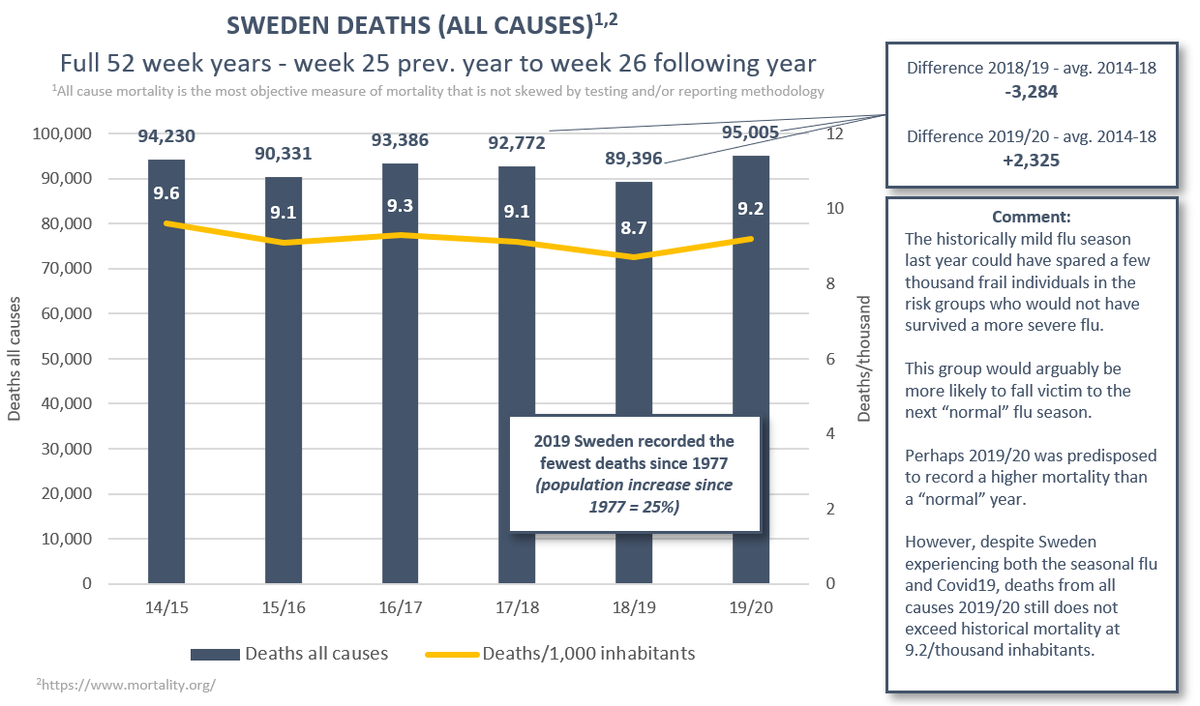
(3/19) This thread should help wean us off crude PFR measures. But it’s worth mentioning that simply adjusting for overall population growth puts this season’s mortality at the 3rd lowest over the past 12 seasons. Has there been any shifts in demography that could affect PFR?
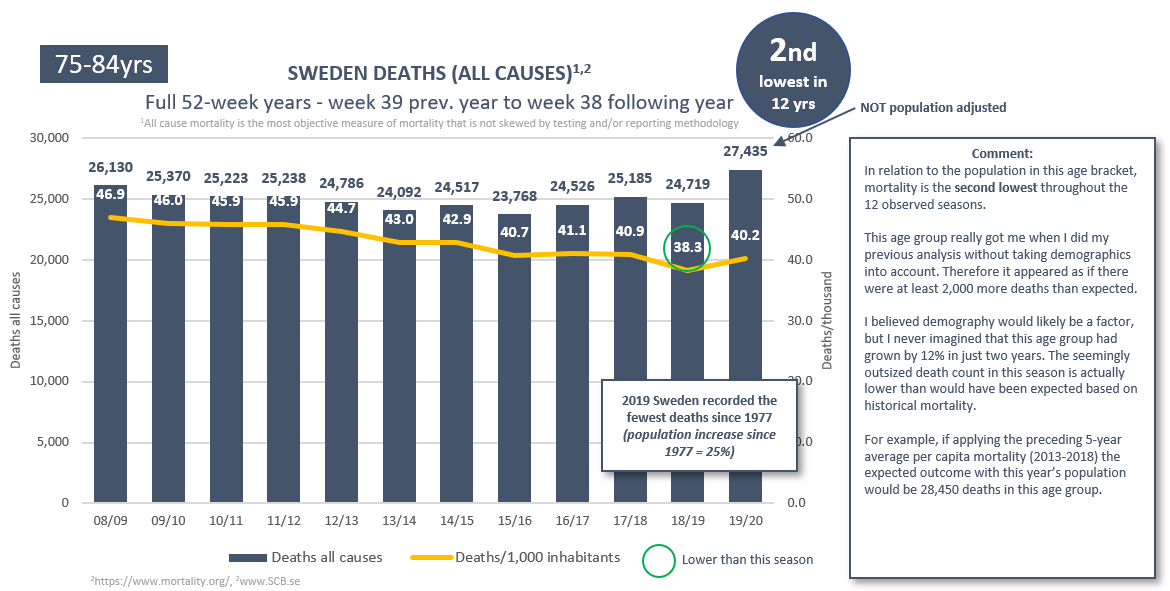
(4/19) For me, one of the greatest revelations from this dataset was to realize how badly I was about to misread the crude mortality data in the thread below. The 75-84 age bracket will therefore be more thoroughly scrutinized ahead.
https://twitter.com/EffectsFacts/status/1300151548899725313?s=20
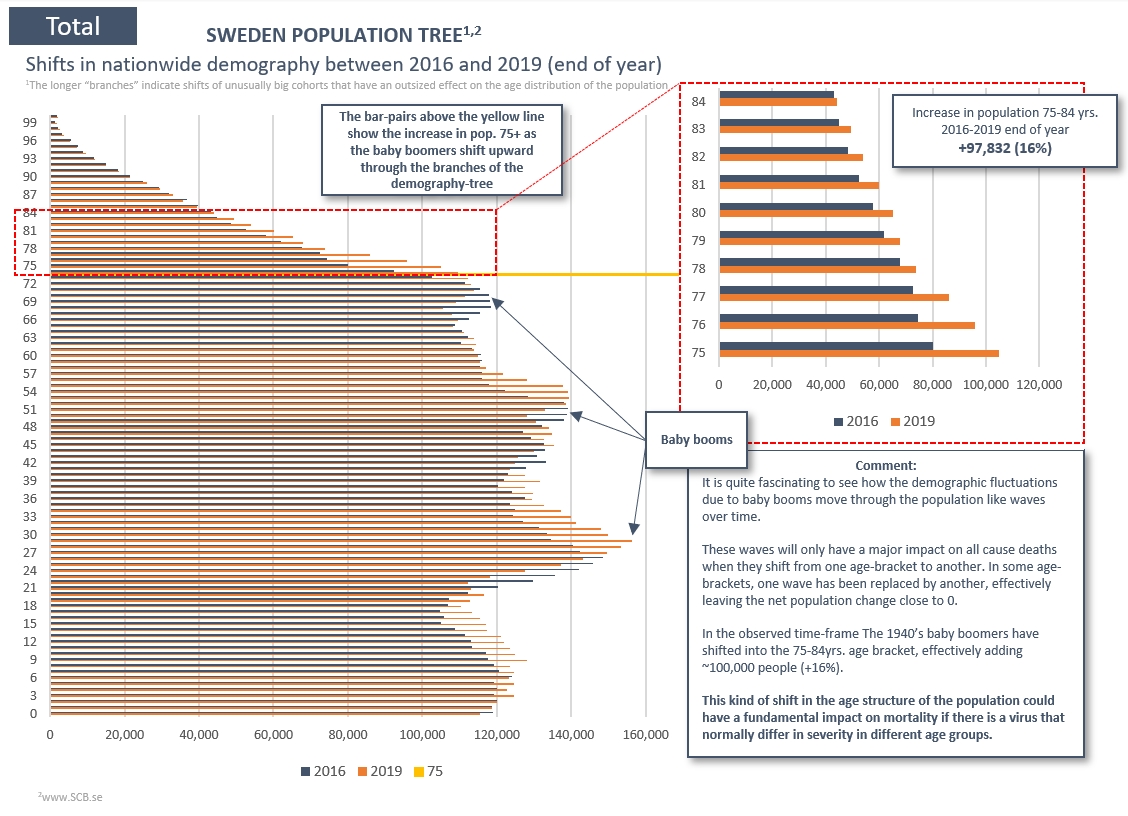
(5/19) Apparently, between 2016 and 2020 this segment of the population grew by almost 30%, adding 100k people. Based on a 5-year historical avg. of 42 deaths/1,000 ppl in this age group we could expect demographics alone to lead to an additional 4,200 deaths in this age group.

(6/19) Yet between 2016 and 2020 the increase in deaths amounted to 3,012. What initially appeared to be a remarkable spike in mortality in this age group turned out to be one of the least deadly seasons in recent history.
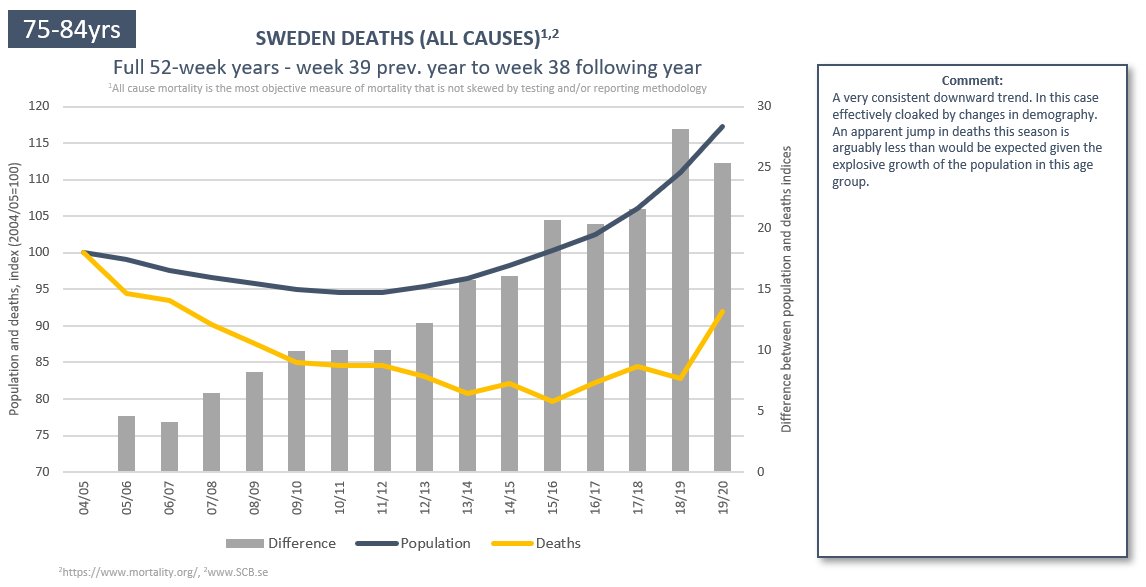
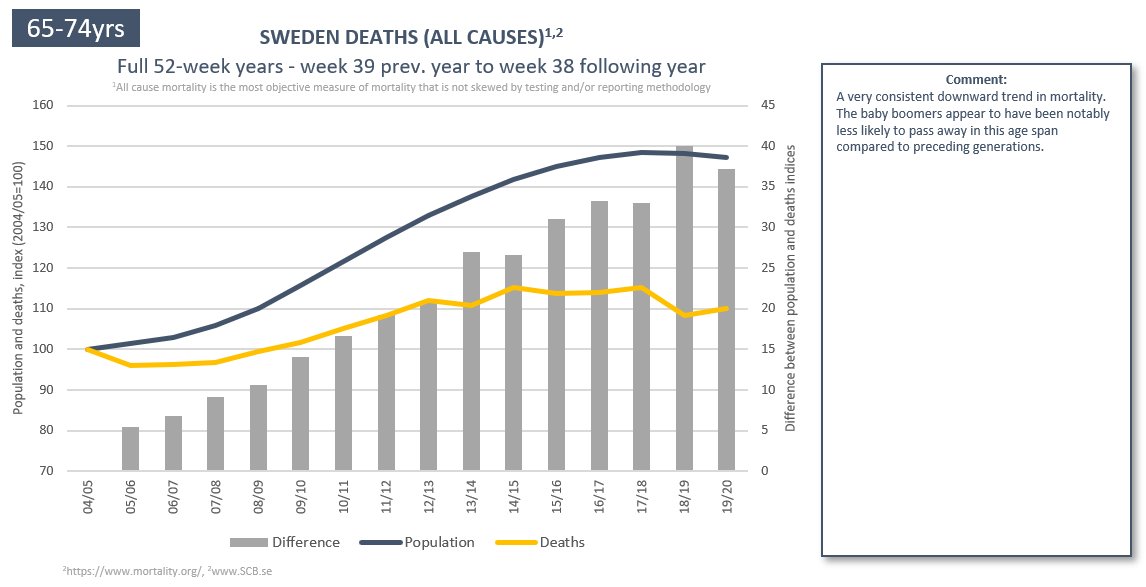
(7/19) We can observe how the 1940’s baby-boomers entered the 65-74 age span starting around 2005. Ten years later they begin to shift into the 75-84 age bracket, resulting in an incredible bolstering of the population 75-84 between 2016-2020.

(8/19) Observe the blue and yellow columns. They clearly illustrate the sequential shift of the 1940’s baby boomers flowing through the 65-74 and 75-84 age brackets. These growth rates compound, so six consecutive years of 2%-6% growth make for a notable change in demography.
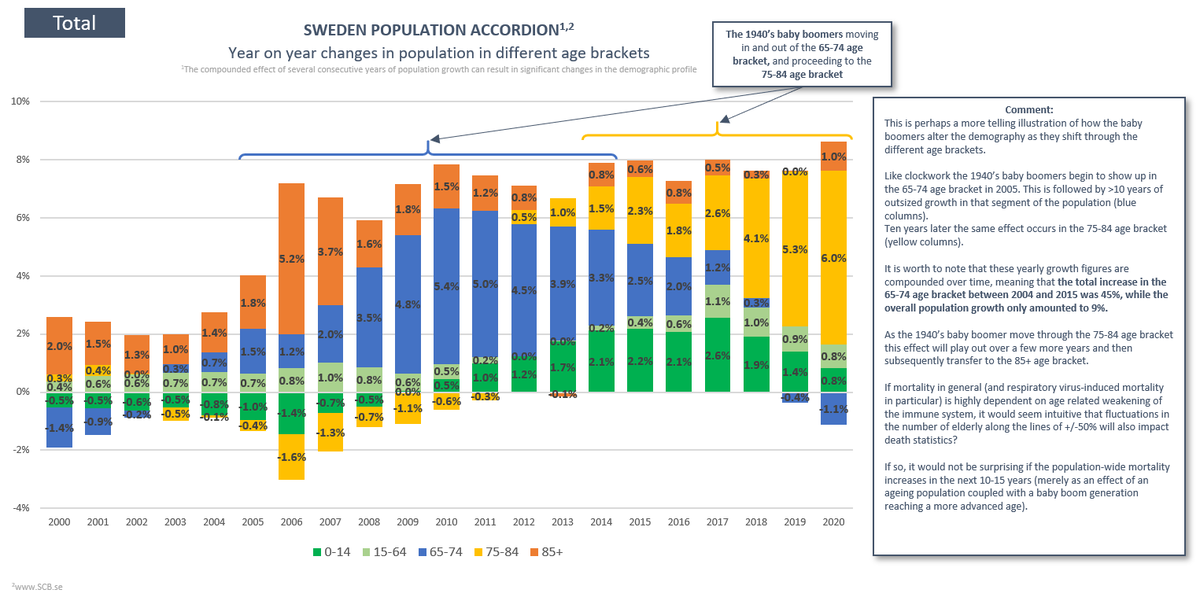
(9/19) If you are making any inferences on mortality without accounting for changes in demography, your analysis is bound to be flawed and your conclusions misleading. Notably, baby boom patterns can supercharge demographic changes and distort even the shortest time series.
(10/19) Let us proceed with a look at the remaining 4 age brackets.
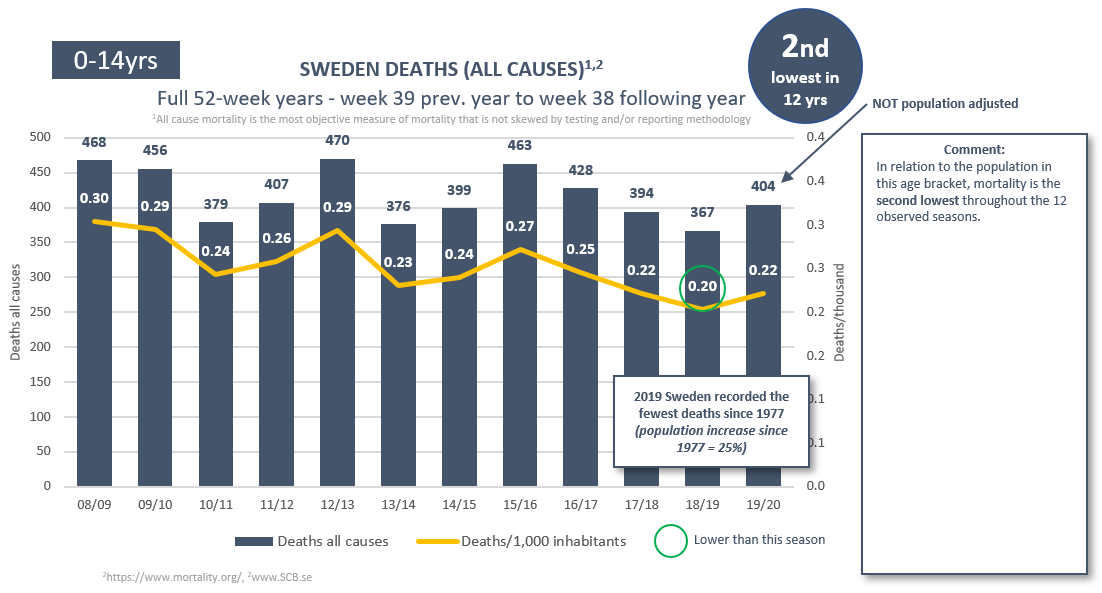
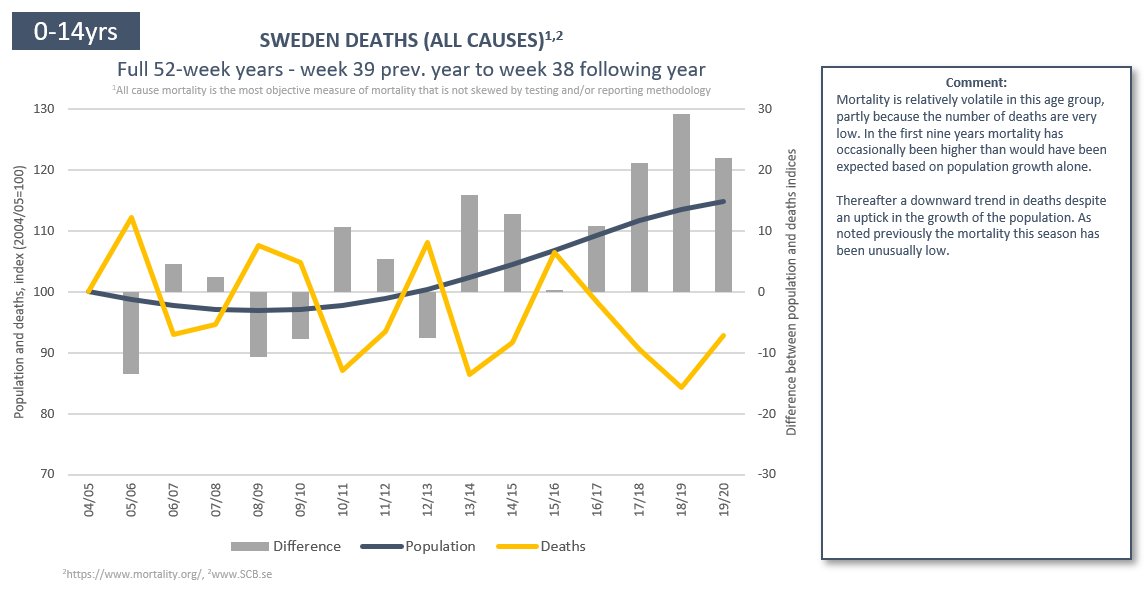
0-14 recorded the 2nd lowest mortality in the observed 12-year period. Open schools did not seem to coincide with an increase in mortality among school age kids.
0-14 recorded the 2nd lowest mortality in the observed 12-year period. Open schools did not seem to coincide with an increase in mortality among school age kids.
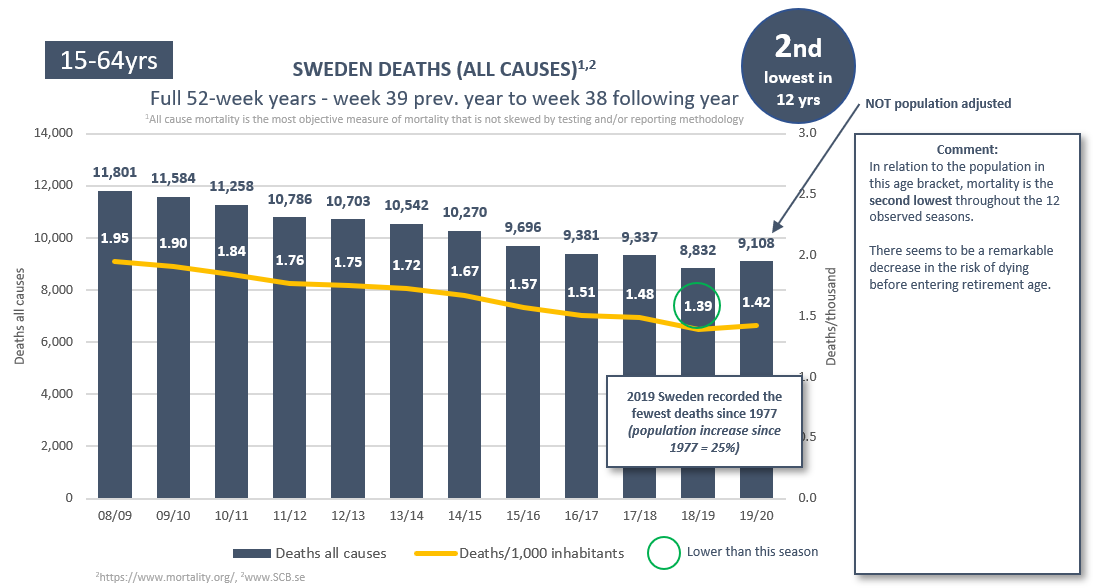
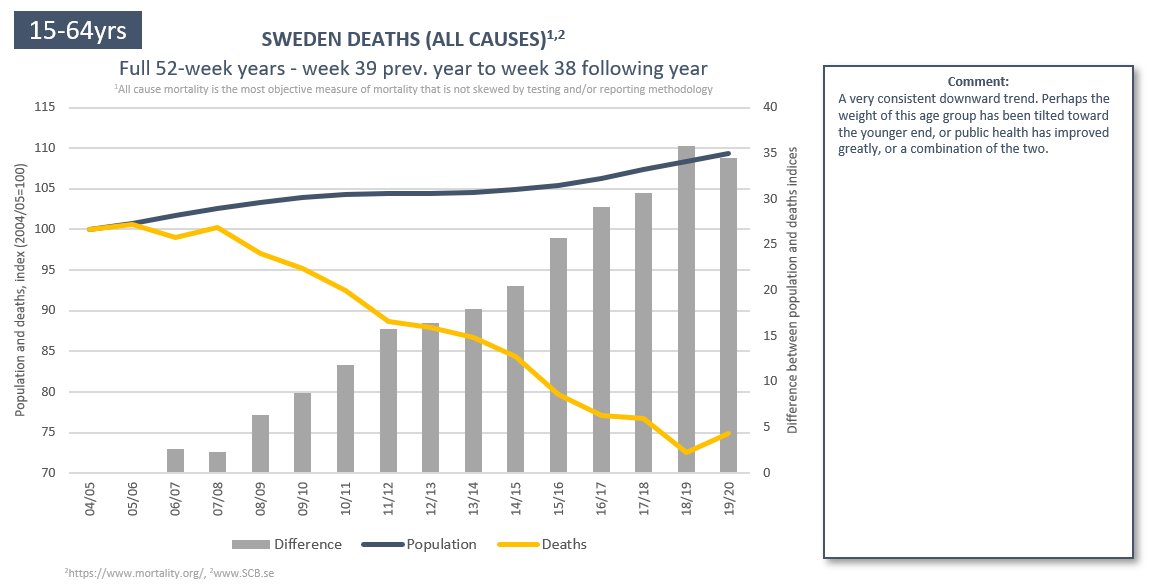
(11/19) 15-64 also recorded the 2nd lowest mortality in the observed 12-year period. Open schools did not seem to coincide with an increase in mortality among the working population.

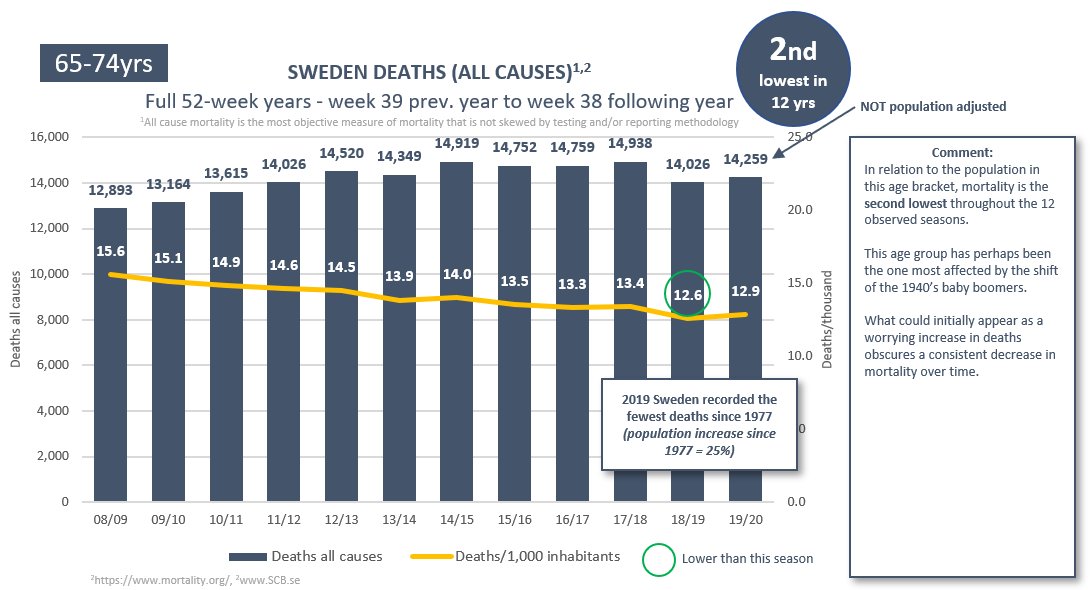
(12/19) 65-74 also recorded the 2nd lowest mortality in the observed 12-year period. Open schools did not seem to coincide with an increase in mortality among the newly retired.
(13/19) A reiteration from tweet 6: 75-84 also recorded the 2nd lowest mortality in the observed 12-year period. Open schools did not seem to coincide with an increase in mortality among the more experienced retirees.


(14/19) 85+ recorded the 6th lowest mortality in the observed 12-year period. Open schools did not seem to coincide with an increase in mortality among the oldest. In this group mortality is relatively stable over time and intra-year differences are relatively small.
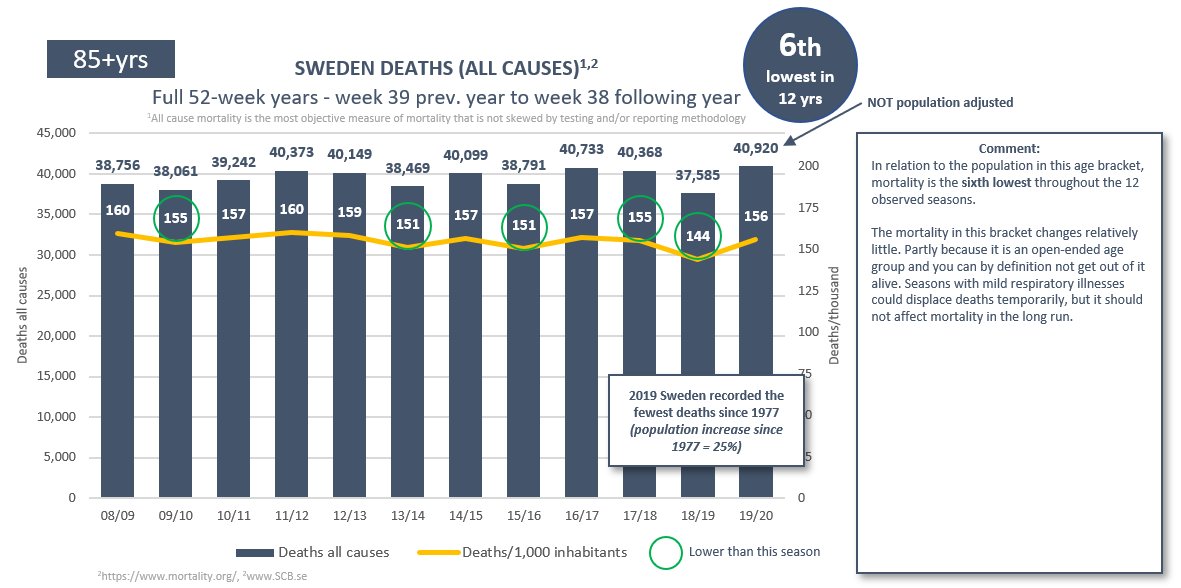
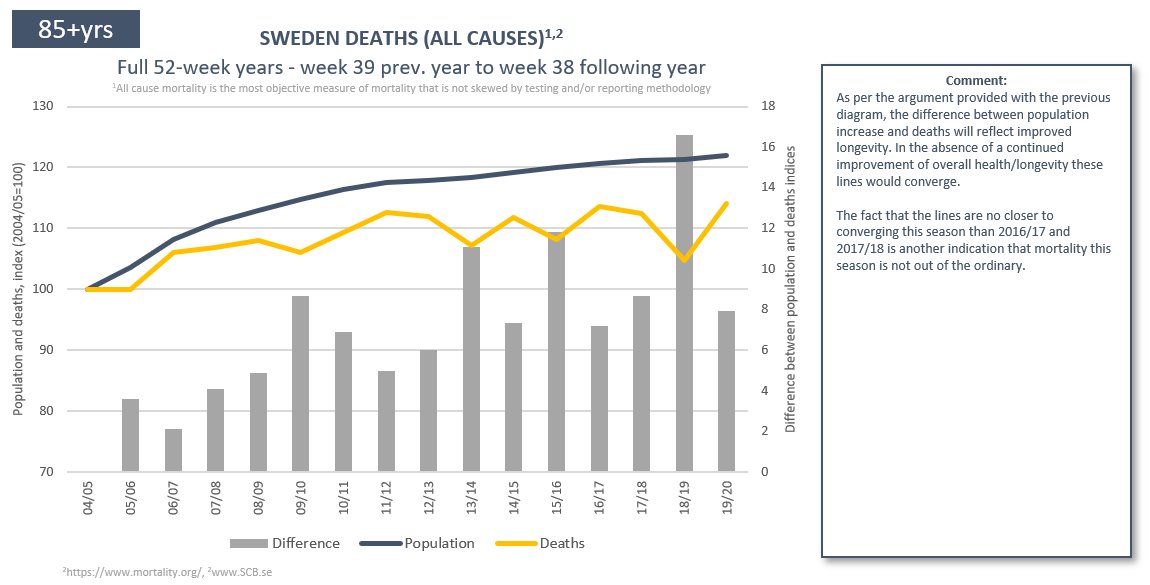
(15/19) Improved longevity can widen the gap between the population growth of this group and its deaths, but by definition no one is able to leave an open-ended age bracket other than by passing on.
(16/19) Lastly, a diagram summarizing the changes in population and deaths in each bracket this season compared to the more recent 2017/18 season. Deaths remain on par or below population growth. Short-term comparisons come with an apparent flaw...
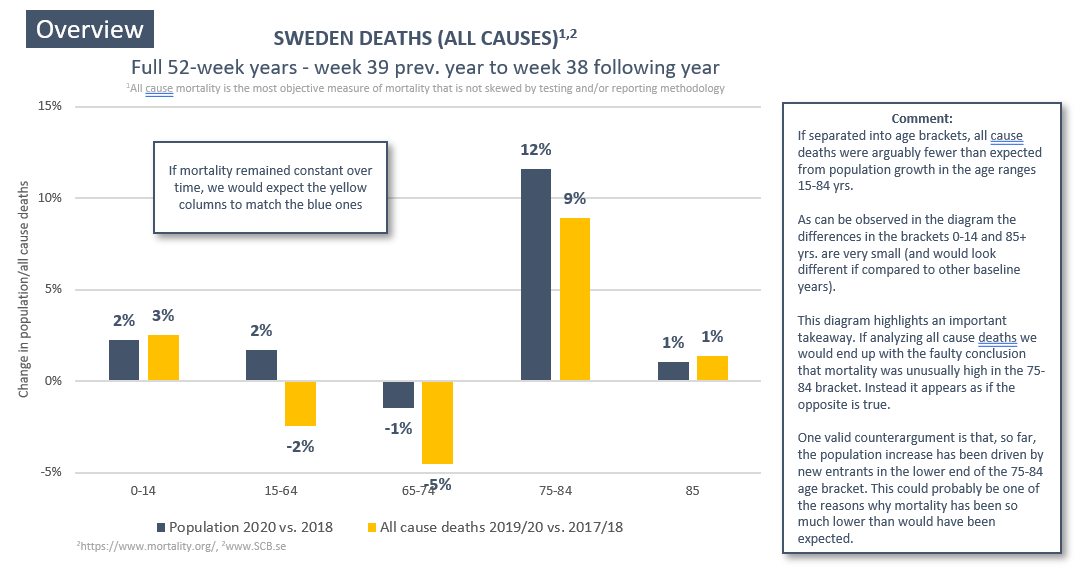
(17/19) An age bracket going through a big transition will likely be skewed towards being relatively younger or older than before, which would in turn affect mortality. I therefore ask that mortality statistics be published in tighter age brackets, or even 1-year increments.
(18/19) Only then could we make real attempts to minimize the noise caused by shifts demography.
(19/19) I haven’t been very active on Twitter for a while and perhaps this has been done already, but it would be great if others could provide insight into what the demographic changes look like in other countries and if/how it could affect our view on Covid19 mortality.
• • •
Missing some Tweet in this thread? You can try to
force a refresh