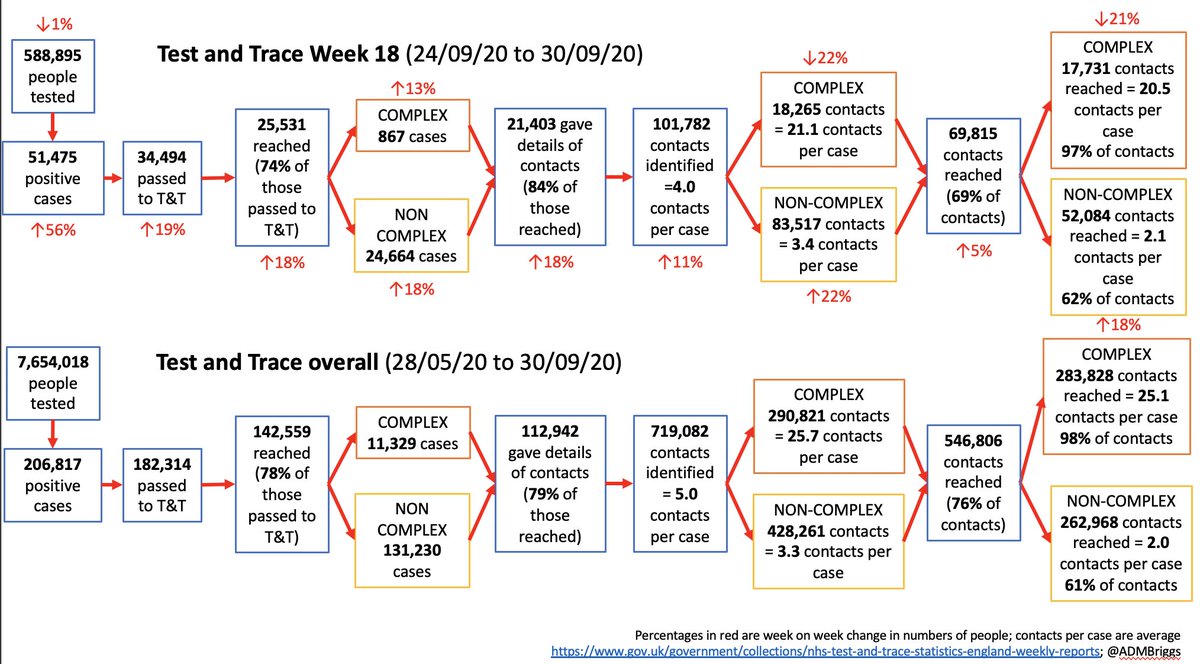
Week 18 Test & Trace data summary. 24/09/20 – 30/09/20.
And some of today's PHE surveillance rpt as well.
Not so good.
Cases, admissions, deaths up.
TT performance continues to worsen, not to mention Excelgate.
Summary in picture, detail in thread 👇
gov.uk/government/pub…
And some of today's PHE surveillance rpt as well.
Not so good.
Cases, admissions, deaths up.
TT performance continues to worsen, not to mention Excelgate.
Summary in picture, detail in thread 👇
gov.uk/government/pub…
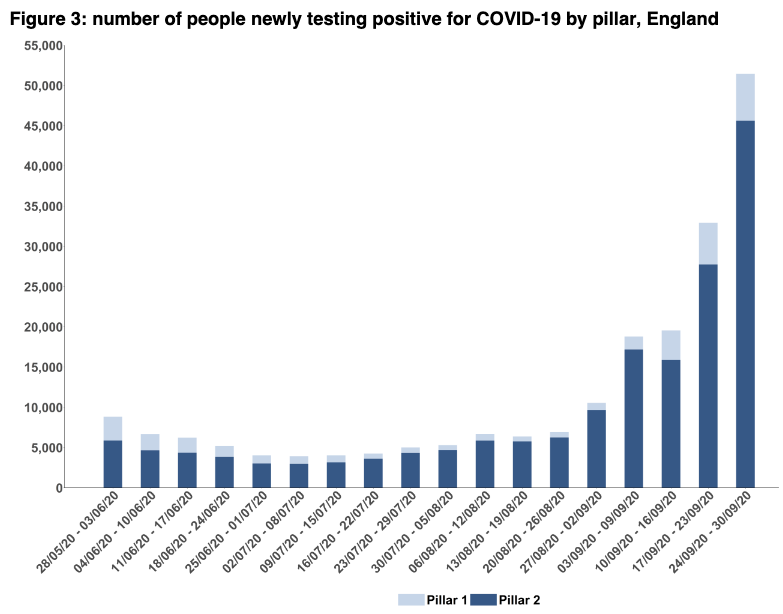
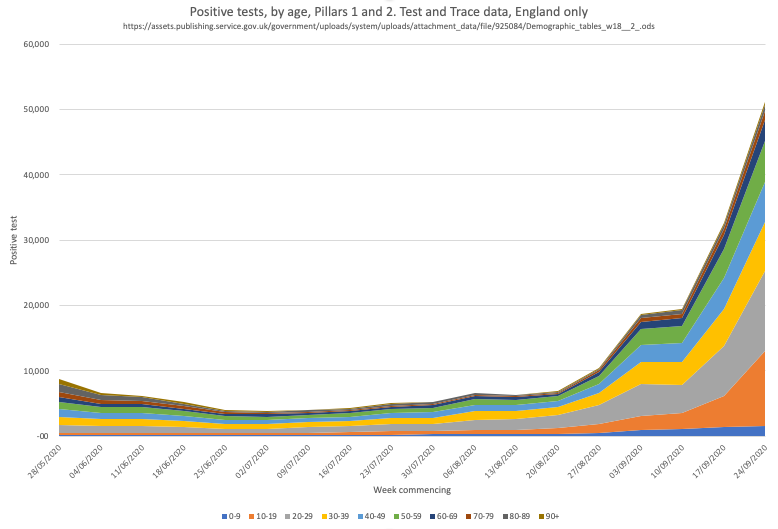
Cases in pillar 1 up 13% from 5,171 to 5,855 (NHS/PHE labs – outbreaks/hospital)
Cases in pillar 2 up 64% from 27,761 to 45,620 (community)
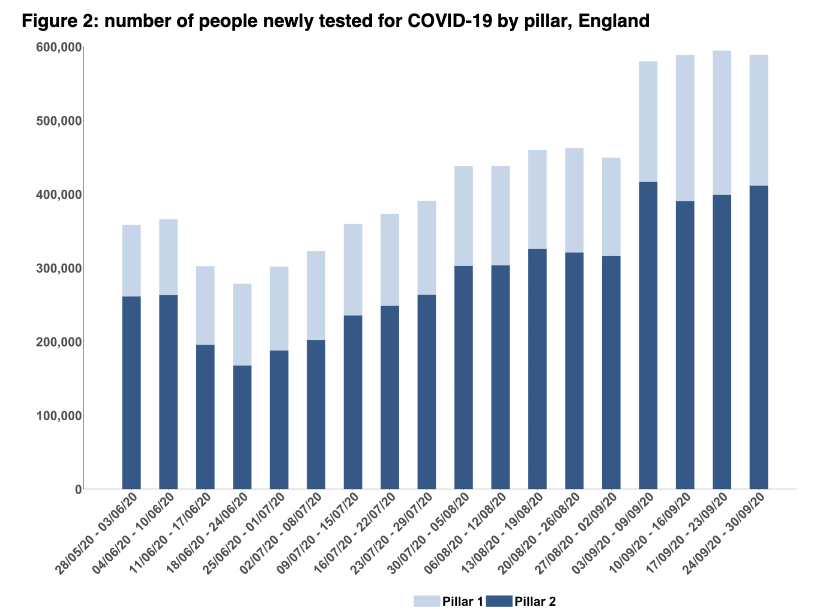
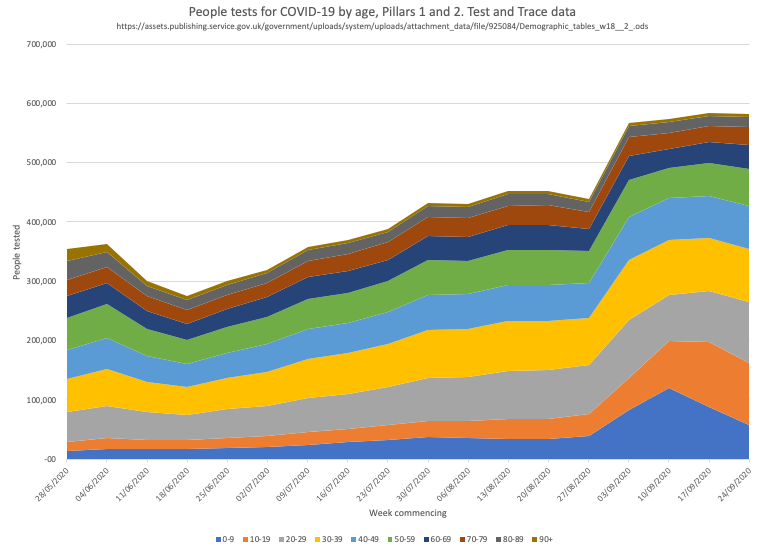
Number of new people tested – no change. This seems to have plateaued (see later in thread about this and positivity rates)
Cases in pillar 2 up 64% from 27,761 to 45,620 (community)
Number of new people tested – no change. This seems to have plateaued (see later in thread about this and positivity rates)
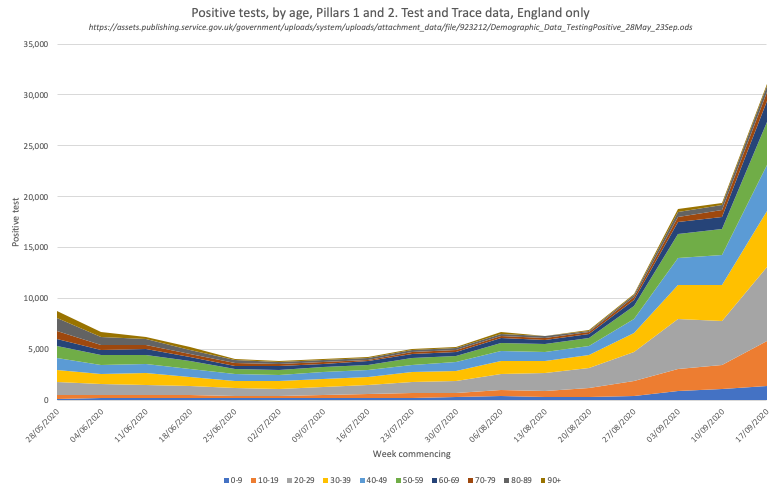
By age – rises in all age groups but note BIG jump in cases among 10-19yr olds.
This is alongside no change in number of new people age 10-19 tested.
This is alongside no change in number of new people age 10-19 tested.
But in T&T data you can never be counted more than once despite multiple tests, so you can’t calculate true positivity rates. (see this neat thread from @_johnbye)
https://twitter.com/_johnbye/status/1304320944983465984?s=20
However as of today, @PHE_uk have now started publishing genuine positivity rates (number of cases/number of people tested) and look at 10-19y/o for case rates and for positivity now overtaking 20-29y/o for data to 4th October. 👀👀👀
assets.publishing.service.gov.uk/government/upl…
assets.publishing.service.gov.uk/government/upl…
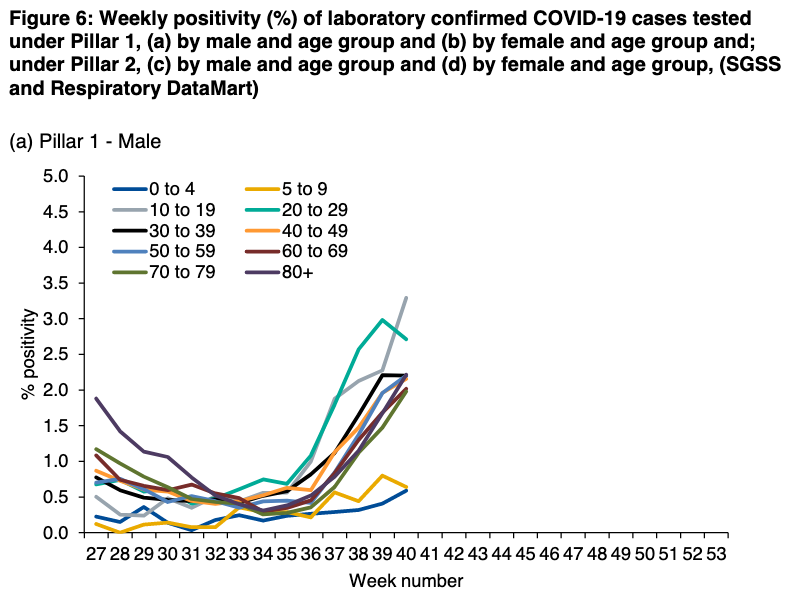

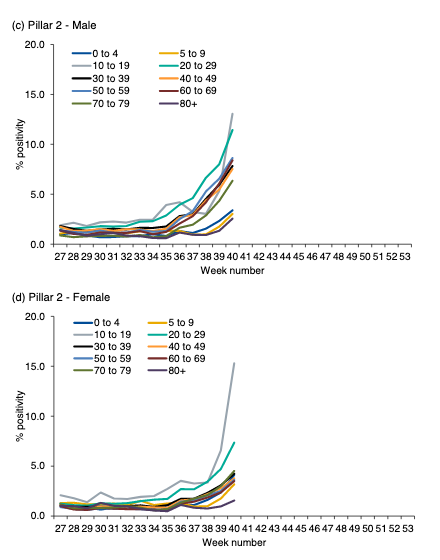
This is concerning.
It may well be a university student phenomenon (18-19 y/o) or it could secondary school kids. If the former, it fits with the headlines, if the latter, then more concerning about schools and keeping them open.
5-9y/o case rates still low.
It may well be a university student phenomenon (18-19 y/o) or it could secondary school kids. If the former, it fits with the headlines, if the latter, then more concerning about schools and keeping them open.
5-9y/o case rates still low.
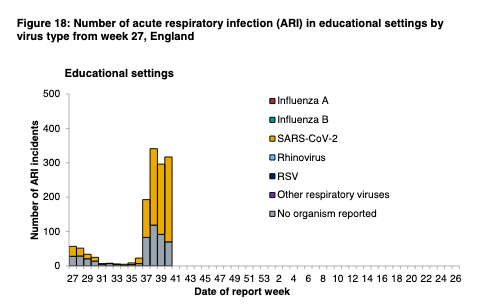
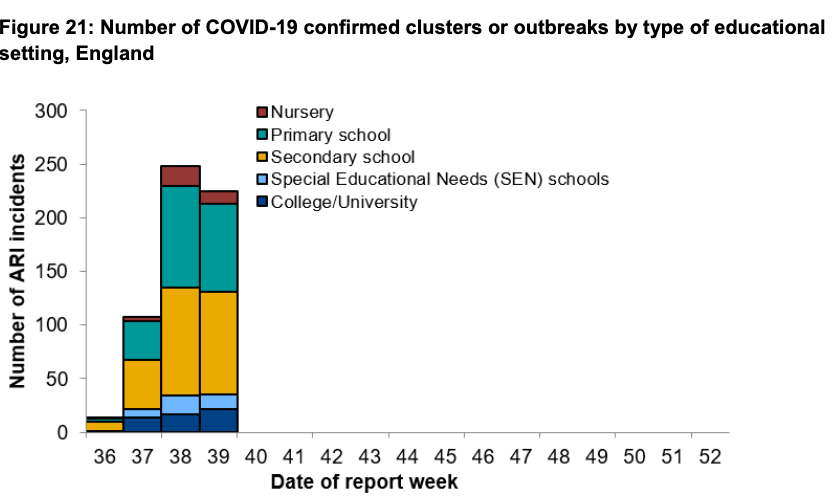
The PHE data show more COVID outbreaks/suspected outbreaks in educational settings, but this week's report doesn't break down b/w university and secondary school. PHE's report from the week before to 29th Sept does suggest still schools not unis (but this will change).
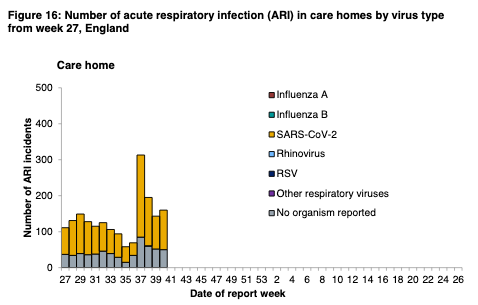
For evidence of cases moving into care homes, the news is still promising from today’s PHE report - only a small rise in number of outbreaks.
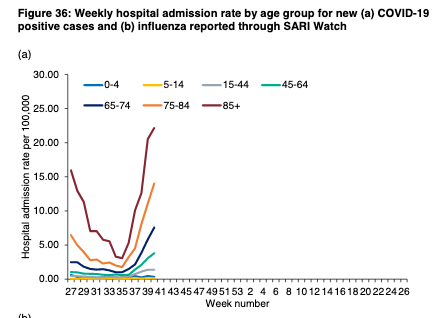
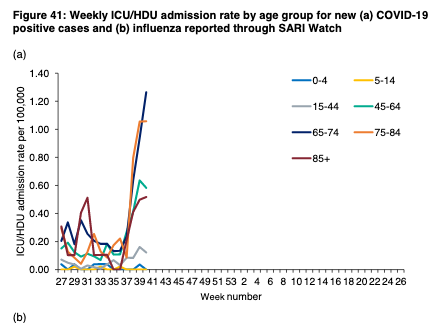
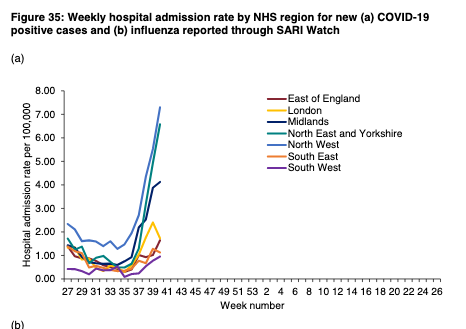
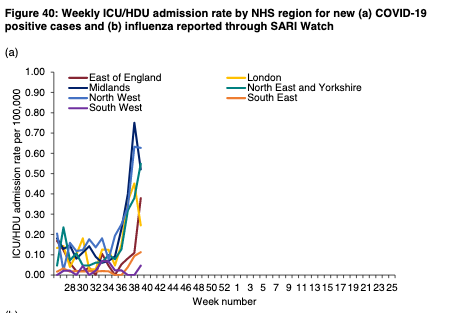
BUT hospitalisations and ICU admission are rising, esp among over 65 y/o.
Despite smaller case numbers, case rates are rising and this is now starkly showing in the hospital data.
Despite smaller case numbers, case rates are rising and this is now starkly showing in the hospital data.
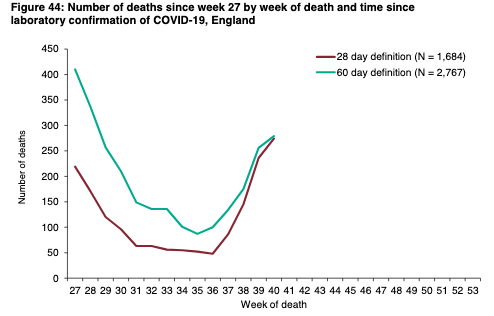
And mortality data.
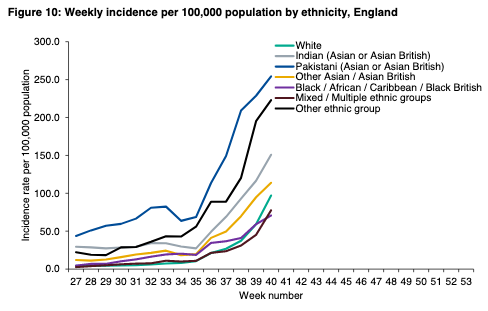
And the inequalities remain.
By ethnicity:
By ethnicity:
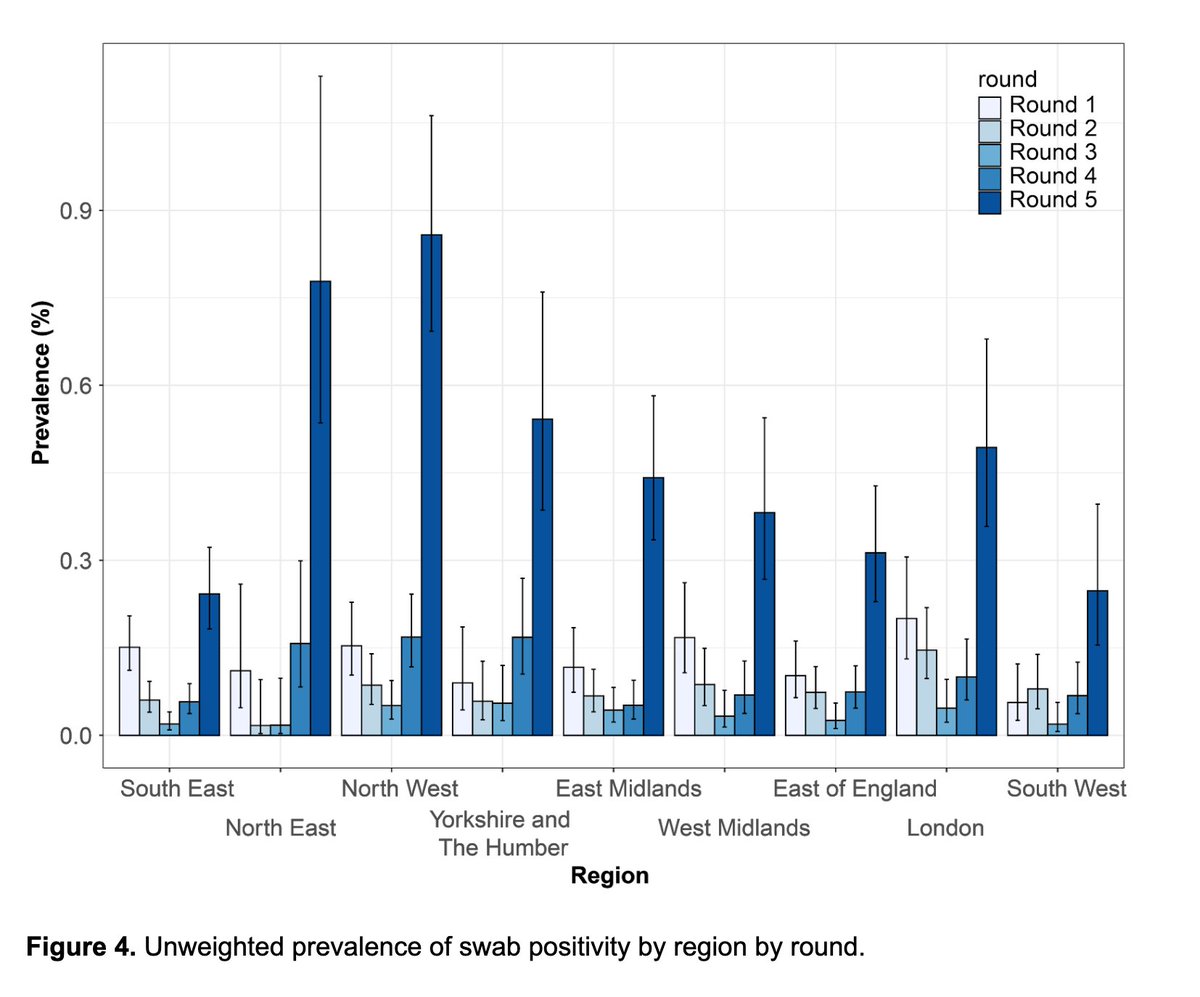
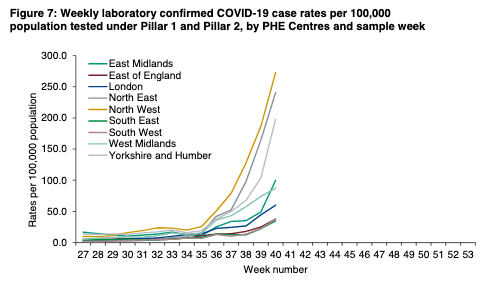
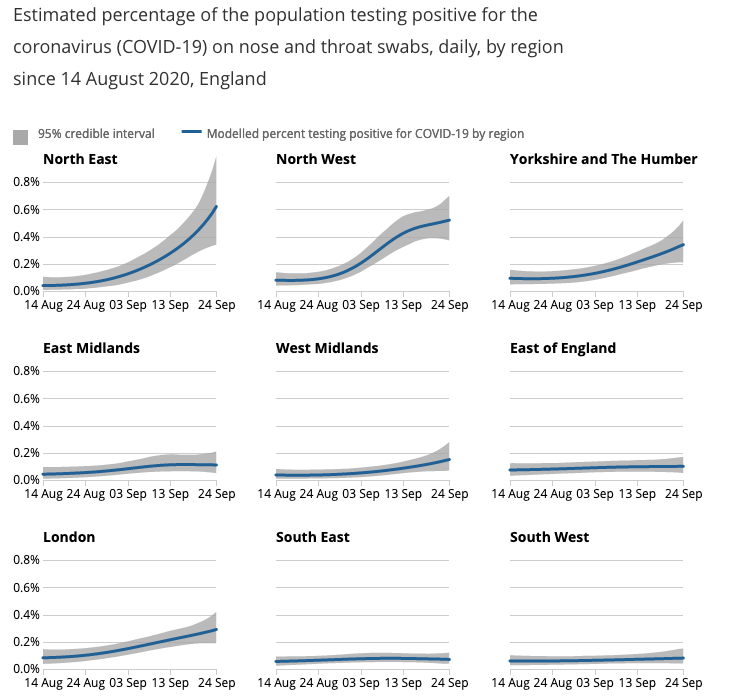
And by geography. The NW and NE are still significantly disproportionately affected both in terms of case rates, but also now hospital admissions, and deaths.

And @Dr_D_Robertson has done a good thread on the PHE report this evening which is worth looking at.
https://twitter.com/Dr_D_Robertson/status/1314243904879964160?s=20
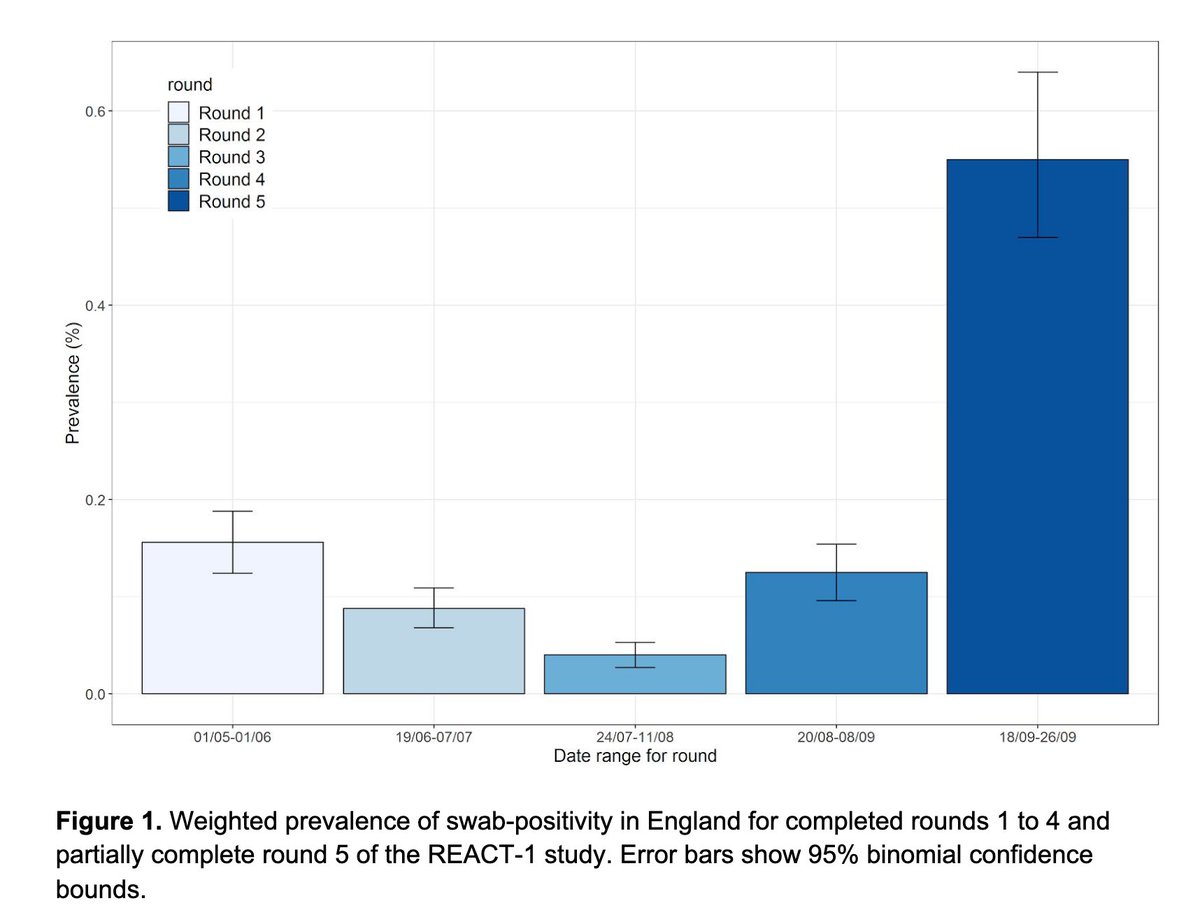
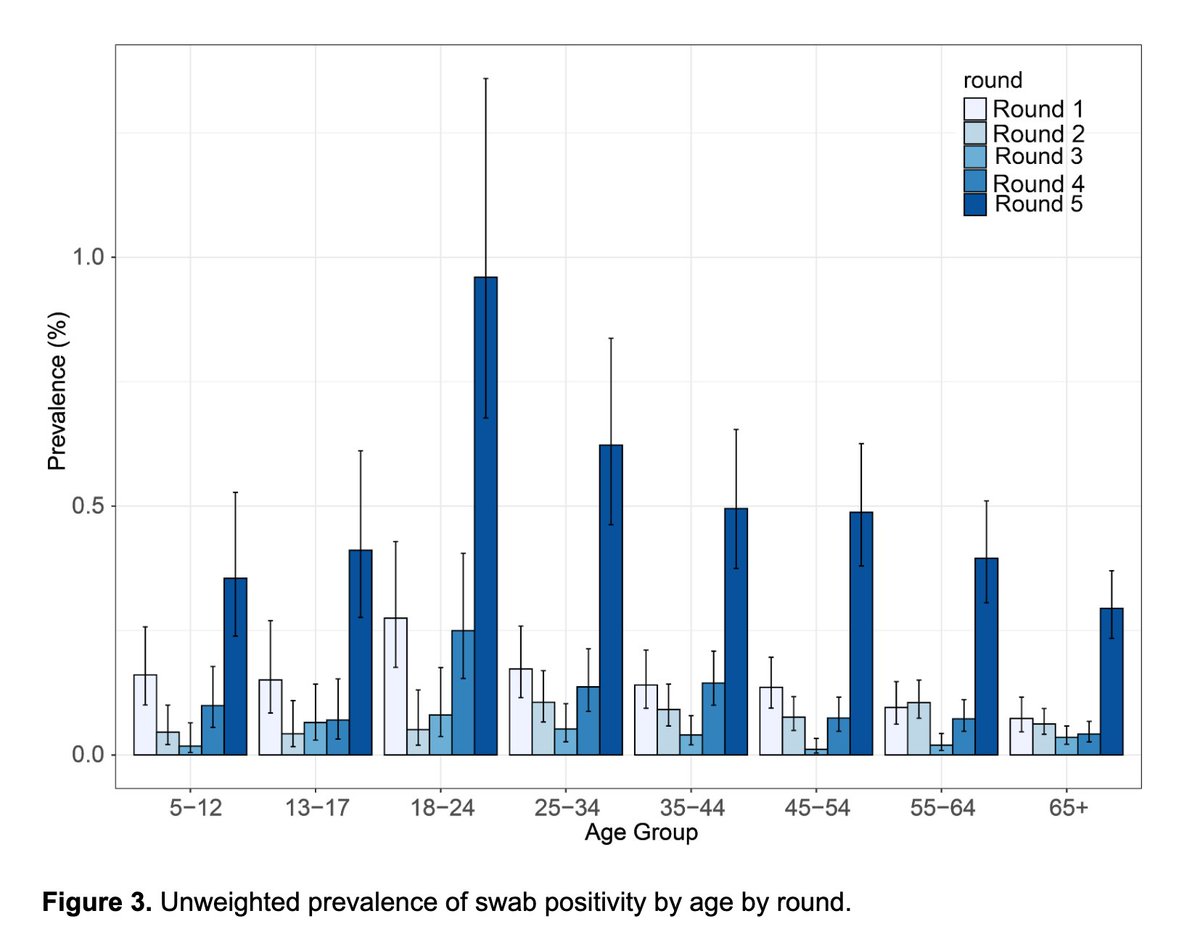
And whilst survey data suggest rate of growth of cases in the community may be slowing, these data - and the survey - illustrate how this varies by geography and demographic.
And it's now translating into morbidity and deaths.
And it's now translating into morbidity and deaths.

In terms of T&T performance, it’s poor.
Note: this week includes a lot of the 15.8k cases that were delayed in being transferred to TT.
This is a delay from test result, to test being transferred to T&T
This doesn't affect time from test to case receiving result.
Note: this week includes a lot of the 15.8k cases that were delayed in being transferred to TT.
This is a delay from test result, to test being transferred to T&T
This doesn't affect time from test to case receiving result.
And the T&T clock only starts once a case in the system, so the delay in transfer WON'T impact T&T turnaround times.
But, it may have impacted T&T if people perhaps being less able to remember contacts, or if less willing to engage because delayed.
Anyway, here's what happened,
But, it may have impacted T&T if people perhaps being less able to remember contacts, or if less willing to engage because delayed.
Anyway, here's what happened,
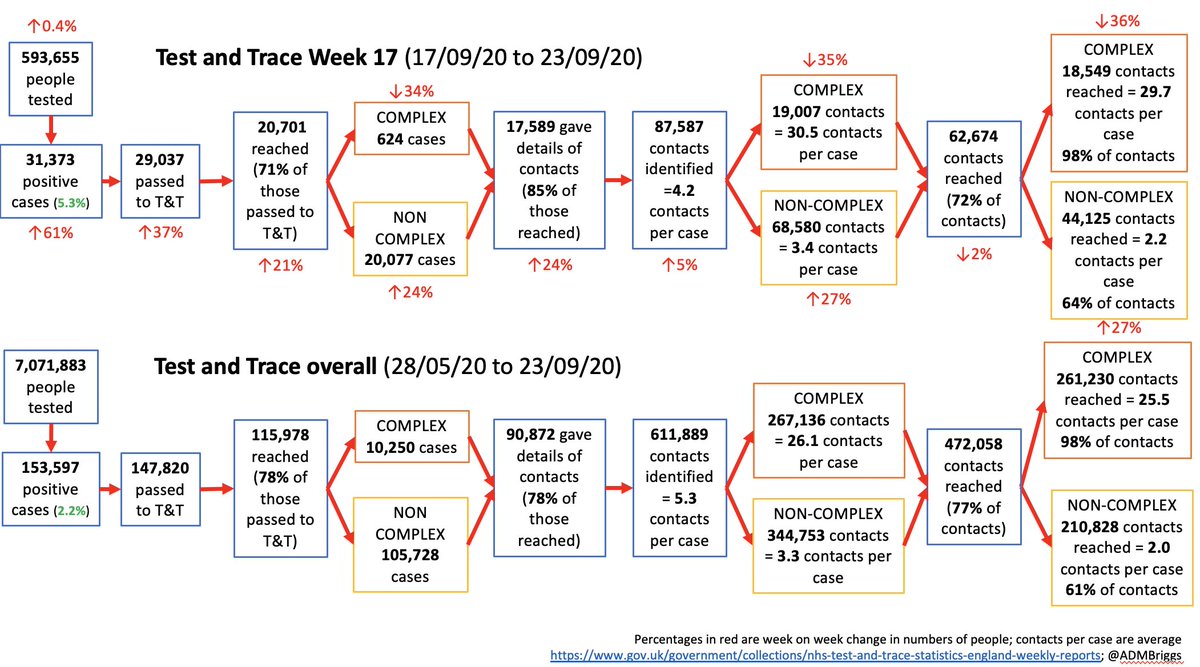
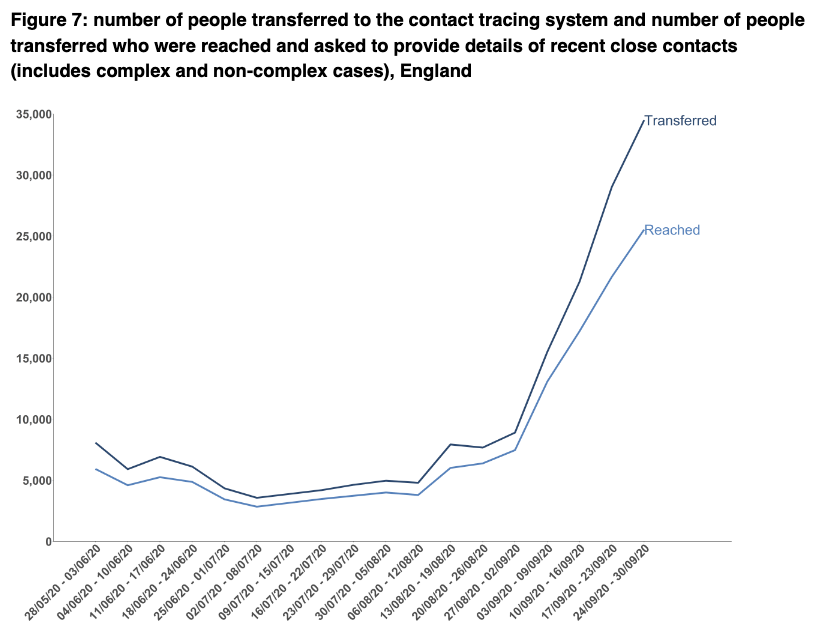
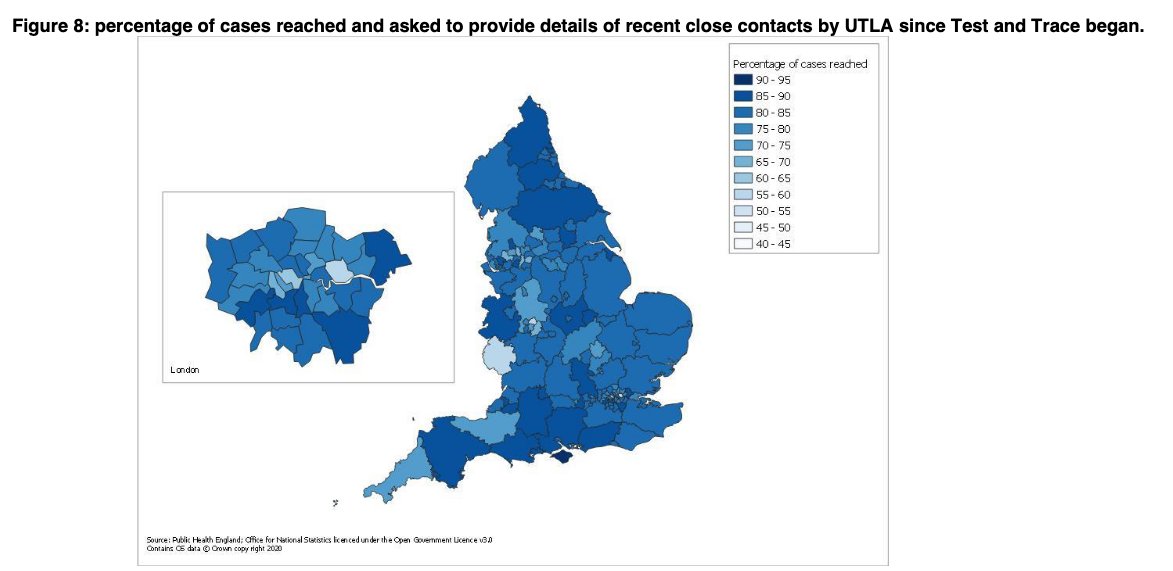
First, of 34,494 cases transferred, 74% reached which is same as last week but isn't great for T&T overall, it's usually in the 80s.
And the geographical variation is still there, but only cumulative since start of Test and Trace.
It would be great if we could see weekly data on this, it’s so important for understanding how T&T impacts local transmission, case rates, lockdowns.
It would be great if we could see weekly data on this, it’s so important for understanding how T&T impacts local transmission, case rates, lockdowns.
Of cases reached, 867 were complex (outbreaks, high risk settings) and 24,664 are non-complex.
And the number of people willing to provide details of contact remains high at 84%
And the number of people willing to provide details of contact remains high at 84%
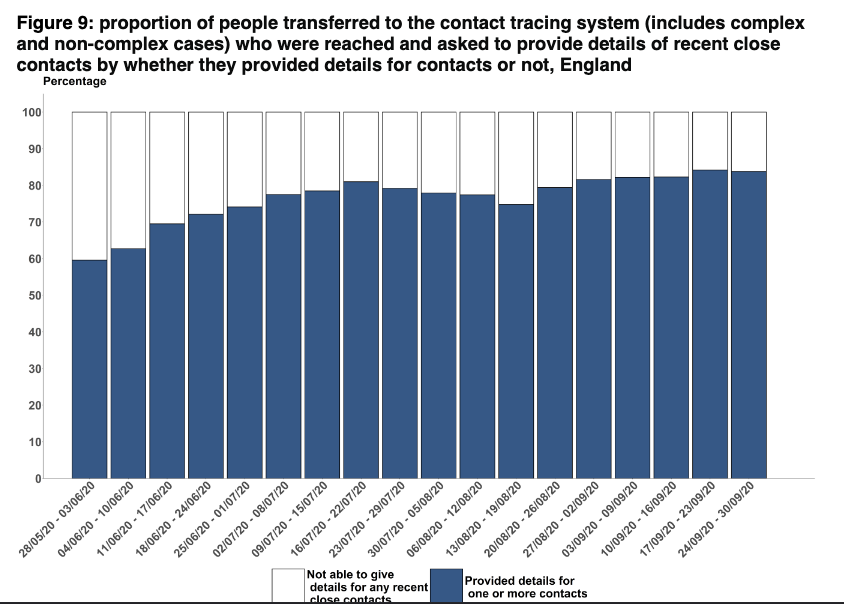
Total number of contacts is 101,782, up 11% compared with an 18% rise in number of cases providing details of contacts. This is because of a big drop in the number of contacts per case among complex cases.
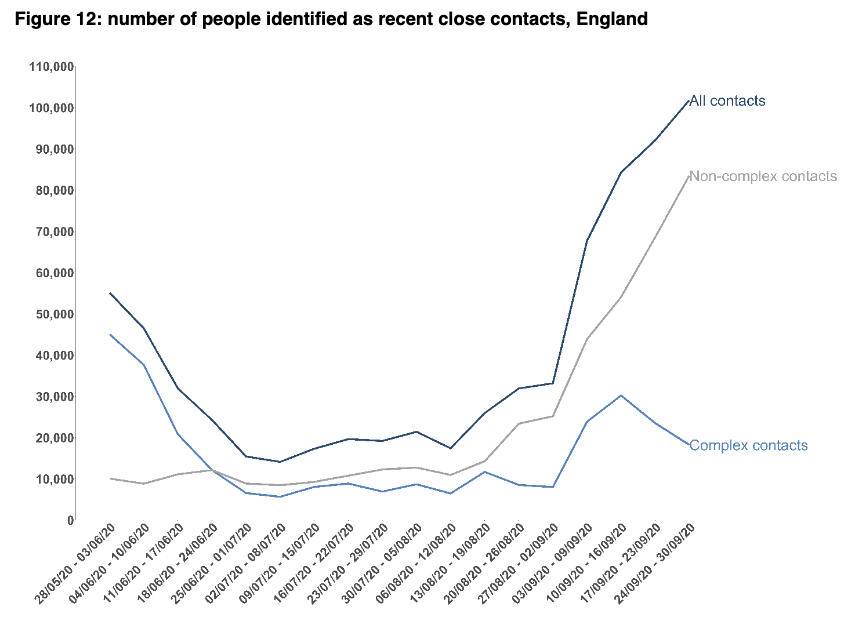
Contacts per case for non-complex is 3.4 contacts per case (like last week), but for complex is 21.1 cf 30.1 last week. This does fluctuate week by week but may be a sign of the ‘rule of six’ and other social restrictions.
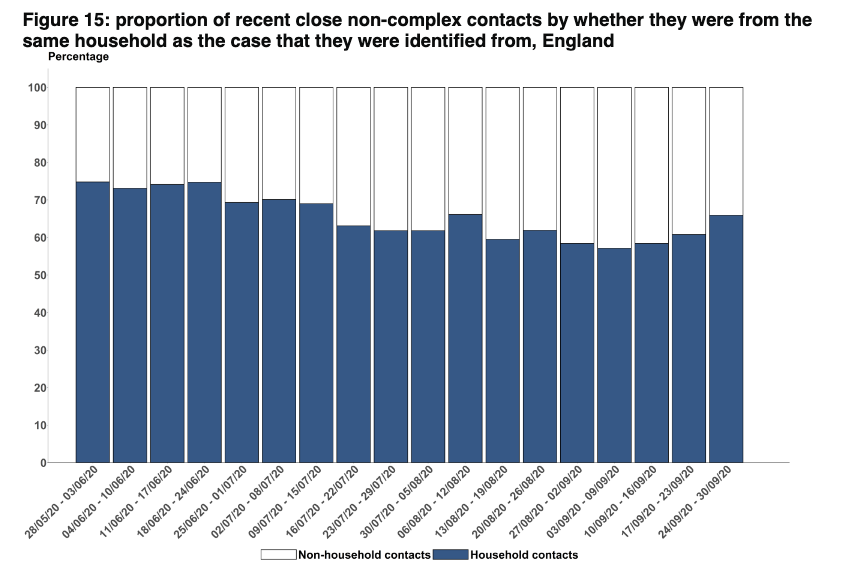
This is also reflected in the proportion of close contacts that are household climbing up.
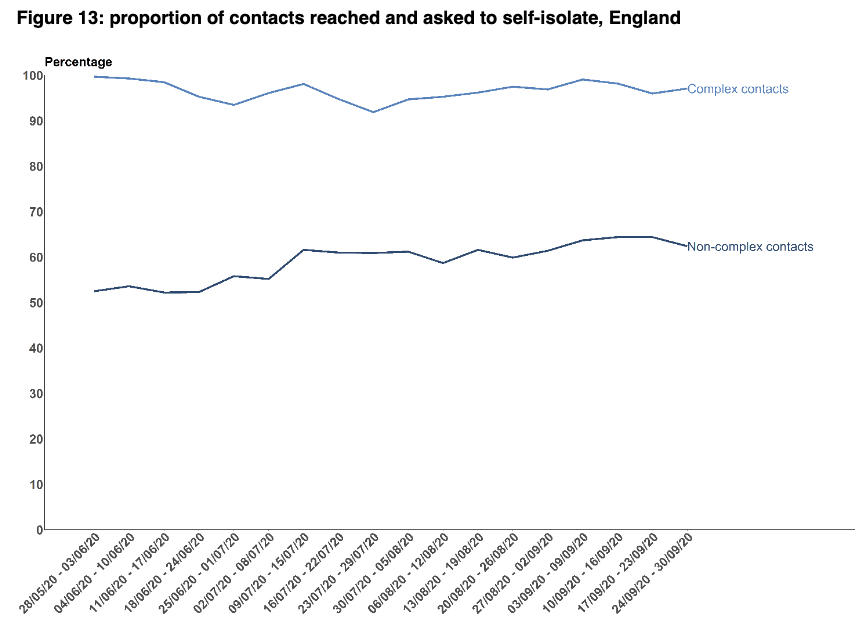
The percentage of total contacts reached for complex cases remains high (97%), but for non complex it’s dropped from 64% to 62%.
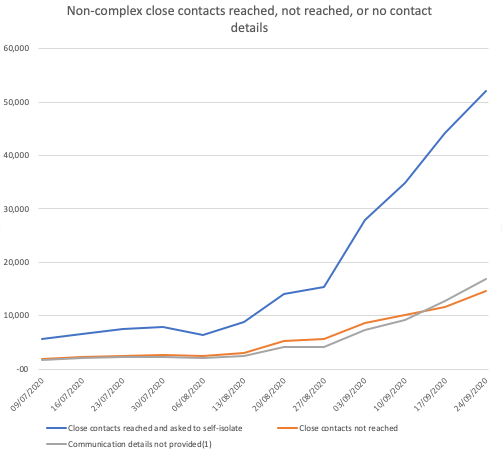
But also note that the number of close contacts mentioned without contact details is creeping up (first time more than those with details but not reached).
Worth keeping an eye on as the fines come in from 28th Sept.
Worth keeping an eye on as the fines come in from 28th Sept.
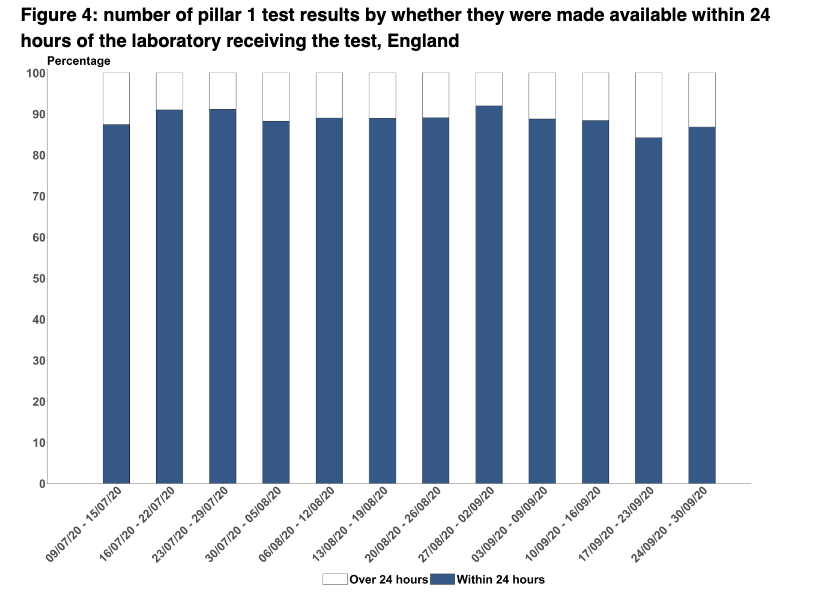
The test turnaround time is generally the same as last week.
But that doesn't mean so much when 15.8k of the results don't then go into T&T.
But that doesn't mean so much when 15.8k of the results don't then go into T&T.

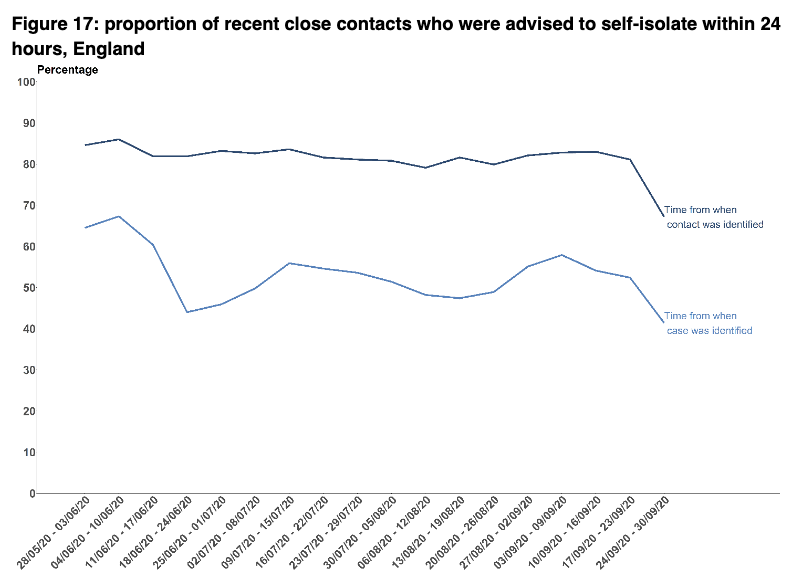
BUT once in T&T, the performance on time is really dreadful, now a little over half of people are reached by T&T within 24hrs.

This has significant implications for local authority contact tracing systems that generally take cases that aren’t reached by T&T within 24hrs.
As such, less well resources local gov systems may quickly get overwhelmed if this doesn't improve.
As such, less well resources local gov systems may quickly get overwhelmed if this doesn't improve.
And then the time taken to advising close contacts to isolate has also deteriorated.
And as ever, the T&T is just one small bit of the wider challenges around ensuring people can get a test, know details of contacts, and are able to isolate.
https://twitter.com/ADMBriggs/status/1311732971947339779?s=20
It remains that society is likely to be far better off by adopting behaviours that prevent spread in the first place, rather than going through all the challenges and hurdles of trying to get everyone to isolate after they're infected.
Wk 18 T&T @felly500 @trishgreenhalgh @deb_cohen @martinmckee
@carolecadwalla @mgtmccartney @ADPHUk @Jeanelleuk @fascinatorfun @profchrisham @petermbenglish @HPIAndyCowper
@Davewwest @HSJEditor @KateAlvanley @IndependentSage
@nedwards_1 @chrischirp @SamanthaJonesUK @ewanbirney
@carolecadwalla @mgtmccartney @ADPHUk @Jeanelleuk @fascinatorfun @profchrisham @petermbenglish @HPIAndyCowper
@Davewwest @HSJEditor @KateAlvanley @IndependentSage
@nedwards_1 @chrischirp @SamanthaJonesUK @ewanbirney
• • •
Missing some Tweet in this thread? You can try to
force a refresh