The question why Canada learned so little from its SARS experience is interesting. After all, much of the success of Taiwan fighting Covid-19 is due to their action plan developed in response to SARS. cbc.ca/news/health/co…
The senior advisor to the original SARS report has written a follow up looking at where things broke down in the Canadian covid-19 response, focusing on failures to protect health care workers and how Canada mismanaged the response. atimeoffear.com
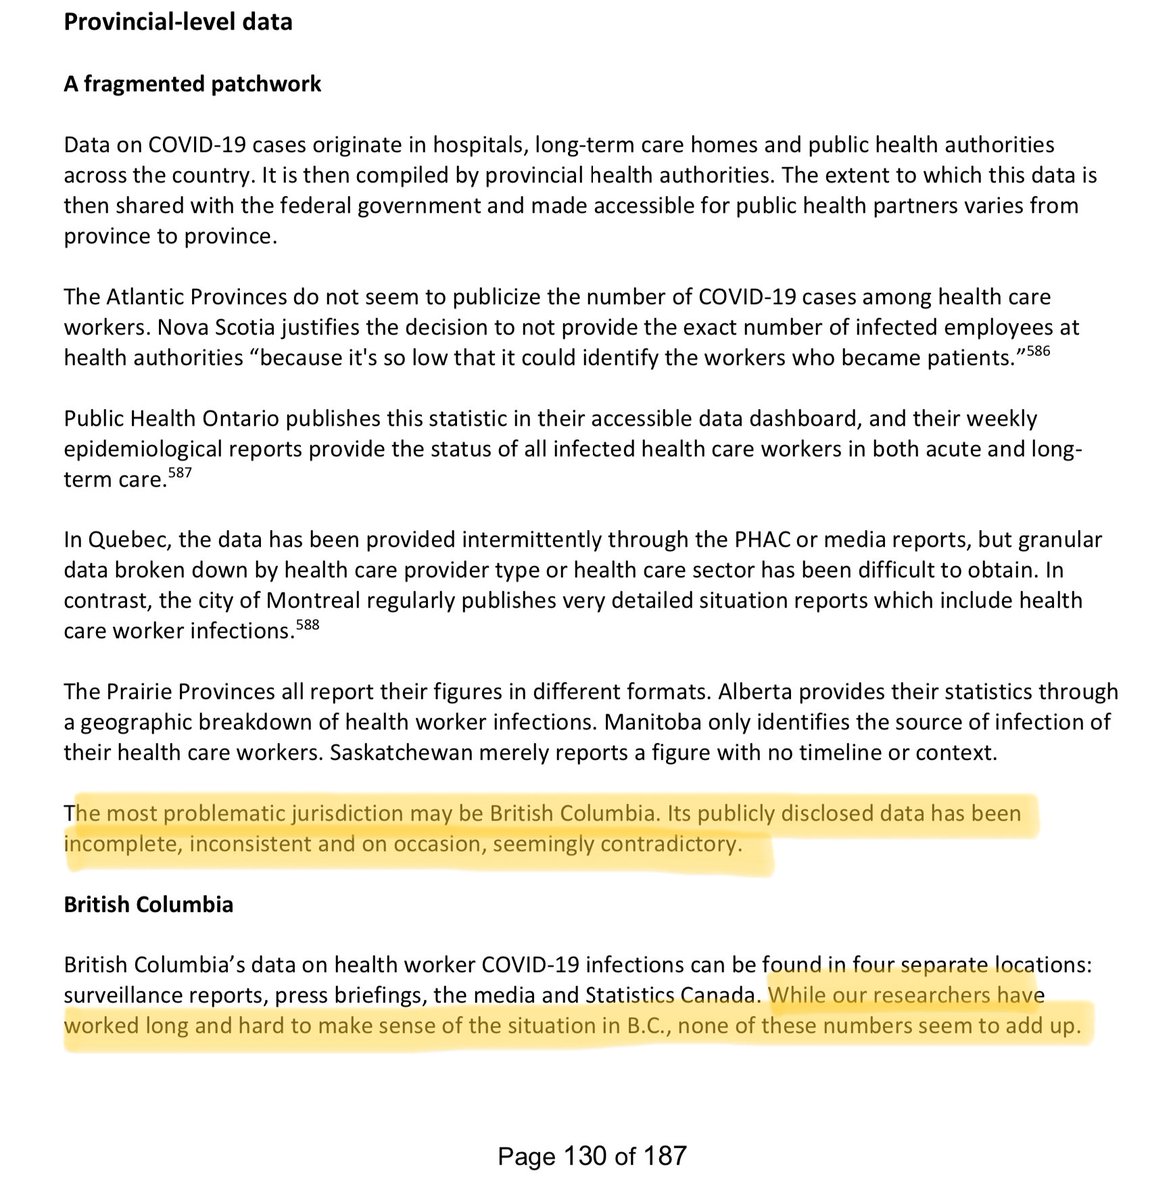
The whole report is worth a close read, but one section that was of particular interest to me is the one on data. And how lessons from data failures during SARS weren’t implemented. While focused on health care workers, the data failures extend far beyond that.
Six of the 23 problems laid out in the original SARS report pertained to data failures. Very little, if any, has been fixed. To contrast, Taiwan set up a separate data system just to track Covid-19 and integrated it into their national health system in a 72 hour push. In January.
The data failures outlined in the report are massive and the processes described in it are completely asinine.
Provincial data handling is generally not any better. But the report points out that things are especially bad in British Columbia. You may have heard me complaining about BC data issues, this report takes it to the next level.
The report documents how they were trying to get information on the number of health care workers infected with covid-19, and it details how the number of infected health care workers as reported by BC has declined (!!) over time. It’s wild.
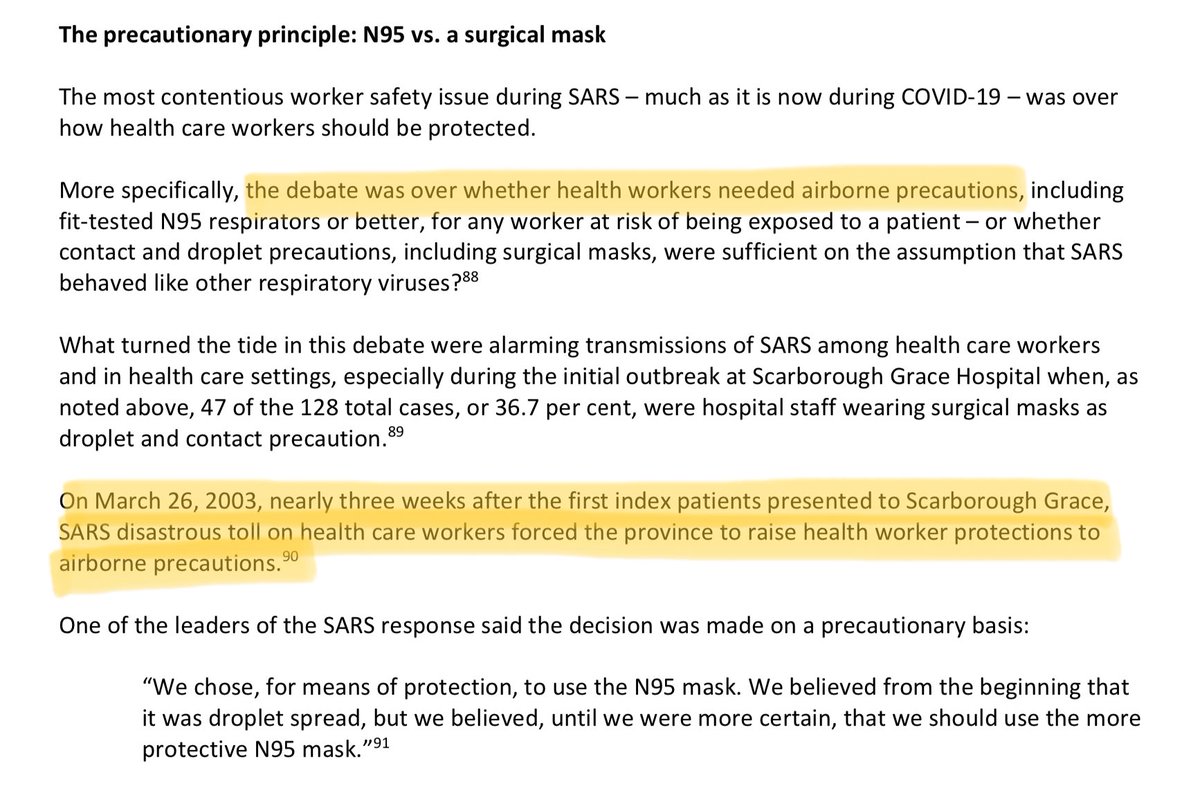
Why does data on health care workers matter? Because it enables us to make sure they are protected. Here is how data on health care worker infections changed the belief on how SARS is transmitted and health care protections were upgraded from droplet to airborne precautions.
The report identifies health care workers as the “canary in the coal mine”, but data on health care workers was either not properly collected or outright misrepresented. BC does not look good here, to put it mildly.
The report keeps circling back to how Canadian health officials have neglected the “precautionary principle” and systematically ruled out the possibility of airborne transmission, repeating mistakes made during SARS.
The report contrasts this to the relative successes in health care worker outcomes in countries that went to airborne precautions early on. It goes into detail on how China changed their protocol. And the failure of the WHO to properly report this.

• • •

Missing some Tweet in this thread? You can try to force a refresh
 

Keep Current with Jens von Bergmann

Jens von Bergmann Profile picture

Stay in touch and get notified when new unrolls are available from this author!

Read all threads

This Thread may be Removed Anytime!

PDF

Twitter may remove this content at anytime! Save it as PDF for later use!

Try unrolling a thread yourself!

how to unroll video
  1. Follow @ThreadReaderApp to mention us!

  2. From a Twitter thread mention us with a keyword "unroll"
@threadreaderapp unroll

Practice here first or read more on our help page!

More from @vb_jens

7 Oct
And today's covid numbers are up. More evidence that the initial decrease we saw a little over a week ago has given way to a slow increase. Image
Testing is down, usually we see numbers going up at this point in the weekly testing cycle. Hopefully that's just a short term blip. Image
And with testing down, positivity is up. Not a good sign, hopefully we get those test numbers back up. Image
Read 4 tweets
23 Apr
Introducing census tract level T1FF tax filer time data for years 2000 to 2017 at the census tract level as open data. Available for mapping on CensusMapper or API access via web interfaces or {cancensus} R📦. Made possible through a project with CMHC. doodles.mountainmath.ca/blog/2020/04/2…
The data is annual, so it's great for timelines. Census tract level enables to see neighbourhood level change. And T1FF data goes beyond just income variables, here is a view into the annual change of 5-11 year olds 2001 through 2017.
Of course the data has lots of income related variables. Here is the change in (inflation-adjusted) median couple family income between 2001 and 2017.
Read 6 tweets
1 Apr
Good to see open data. Should allow programmatic back-filling of data @ishaberry2 and @covid_canada have been collecting manually. Does not yet contain today’s new numbers, hopefully they will improve update frequency.
Would love to see this kind of data from other provinces too. BC used to publish case details in daily briefings, but stopped March 13th. The fine folks at @Data_BC have the expertise and technology to implement an API in a heartbeat, all it takes is political will. cc @adriandix
Added benefit of having clean data like this is that we can immediately pull together descriptive stats. And they are reproducible and can automatically be updated when new data is available.
Read 6 tweets
14 Jan
If you are interested in learning about "Reproducible and adaptable workflows using StatCan data in R" but missed my CABE webinar earlier today, the slides are online. mountainmath.ca/cabe
There are other useful resources out there to help with the packages. The documentation has a convenient function reference, as well as introduction and example articles. mountainmath.github.io/cansim/index.h…
Same for the {cancensus} package, complete with instructions of how to get your (free) API key and set it up so it's ready to use in every R session without exposing it when sharing code. mountainmath.github.io/cancensus/inde…
Read 6 tweets

Did Thread Reader help you today?

Support us! We are indie developers!


This site is made by just two indie developers on a laptop doing marketing, support and development! Read more about the story.

Become a Premium Member ($3/month or $30/year) and get exclusive features!

Become Premium

Too expensive? Make a small donation by buying us coffee ($5) or help with server cost ($10)

Donate via Paypal Become our Patreon

Thank you for your support!

Follow Us on Twitter!