October 10 – Canada/Ontario/Québec daily update
Data is 100% public and official.
10 octobre – Mise à jour quotidienne Canada/Ontario/Québec
Les données sont 100% publiques et officielles.
#COVID19Canada #COVID19Ontario #covid19qc #COVID19toronto #covid19ottawa
Data is 100% public and official.
10 octobre – Mise à jour quotidienne Canada/Ontario/Québec
Les données sont 100% publiques et officielles.
#COVID19Canada #COVID19Ontario #covid19qc #COVID19toronto #covid19ottawa


Canada - Covid-19 still presents a risk primarily to the elderly, not to children and hardly to working-age adults.
(n.b. Based on 2020 YTD data for Covid-19 - figures to be revised upward as needed.)
(n.b. Based on 2020 YTD data for Covid-19 - figures to be revised upward as needed.)
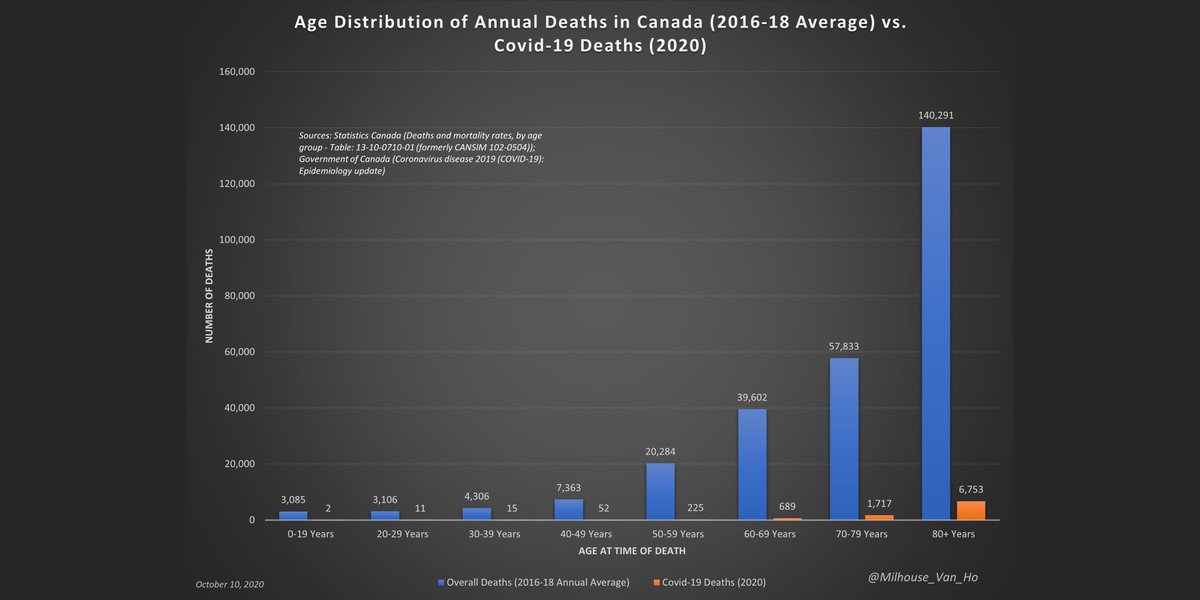
Deaths among those over 80 account for 71.4% of deaths by/with covid-19.
This contrasts to overall deaths, for which the 80+ cohort accounts for 50.9% of deaths (based on 2016-2018 averages).
(n.b. Based on 2020 YTD data for Covid-19 - figures to be revised.)
This contrasts to overall deaths, for which the 80+ cohort accounts for 50.9% of deaths (based on 2016-2018 averages).
(n.b. Based on 2020 YTD data for Covid-19 - figures to be revised.)

Bear in mind that the risk of death will sadly always rise in line with one's advancing age.
In a given year, like 2018 as an example, 9.2% of those in the over-80 age cohort pass away.
(n.b. Based on 2020 YTD data for Covid-19 - figures to be revised.)
In a given year, like 2018 as an example, 9.2% of those in the over-80 age cohort pass away.
(n.b. Based on 2020 YTD data for Covid-19 - figures to be revised.)
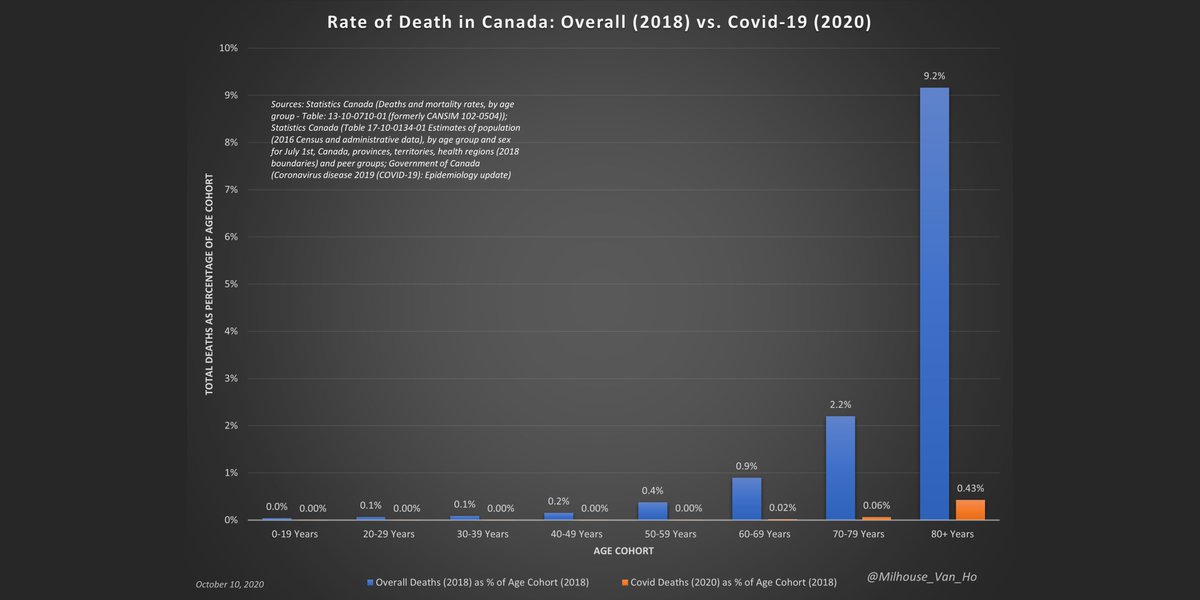
Children and young adults are at lower risk from Covid-19 than from influenza and pneumonia.
The risk of death by/with Covid-19 is higher than that by/with influenza and pneumonia as one's age advances.
(n.b. Based on 2020 YTD data for Covid-19 - figures to be revised.)
The risk of death by/with Covid-19 is higher than that by/with influenza and pneumonia as one's age advances.
(n.b. Based on 2020 YTD data for Covid-19 - figures to be revised.)

If considered as a wholly distinct and separate cause of death in Canada, Covid-19 may be the 6th leading cause of death in 2020, much like influenza and pneumonia.
(n.b. Based on 2020 YTD data for Covid-19 - figures to be revised upward as needed.)
(n.b. Based on 2020 YTD data for Covid-19 - figures to be revised upward as needed.)

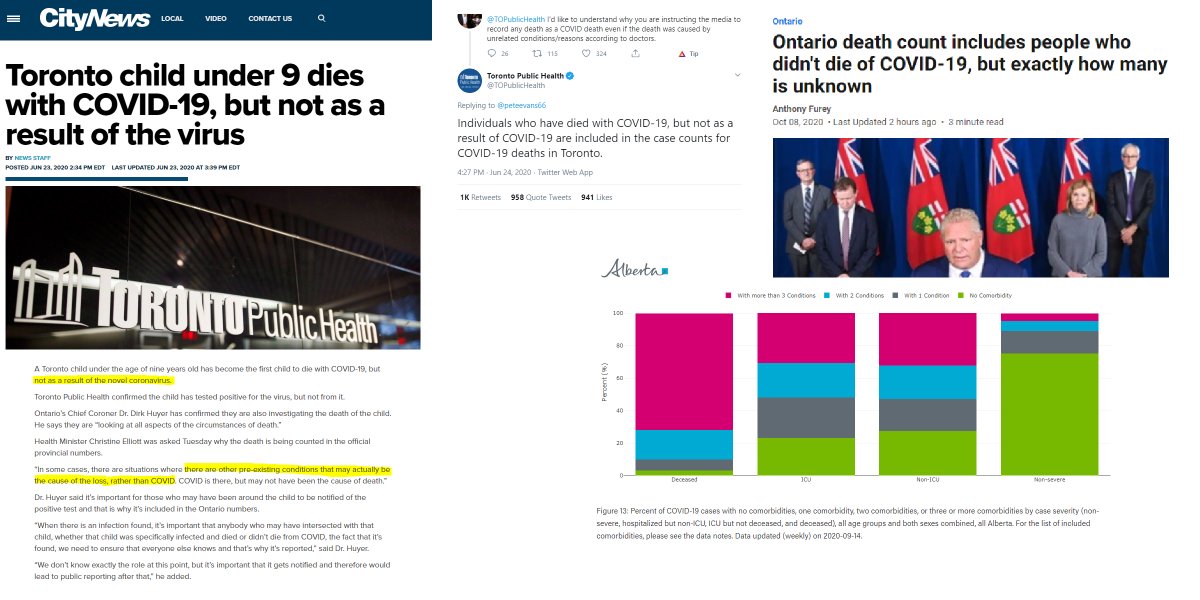
However, Covid-19 is often not a wholly distinct and separate cause of death as there are other medical conditions involved in many cases.
There are also cases in which it is not even a cause of death, but the individual had tested positive sometime prior to their death.
There are also cases in which it is not even a cause of death, but the individual had tested positive sometime prior to their death.
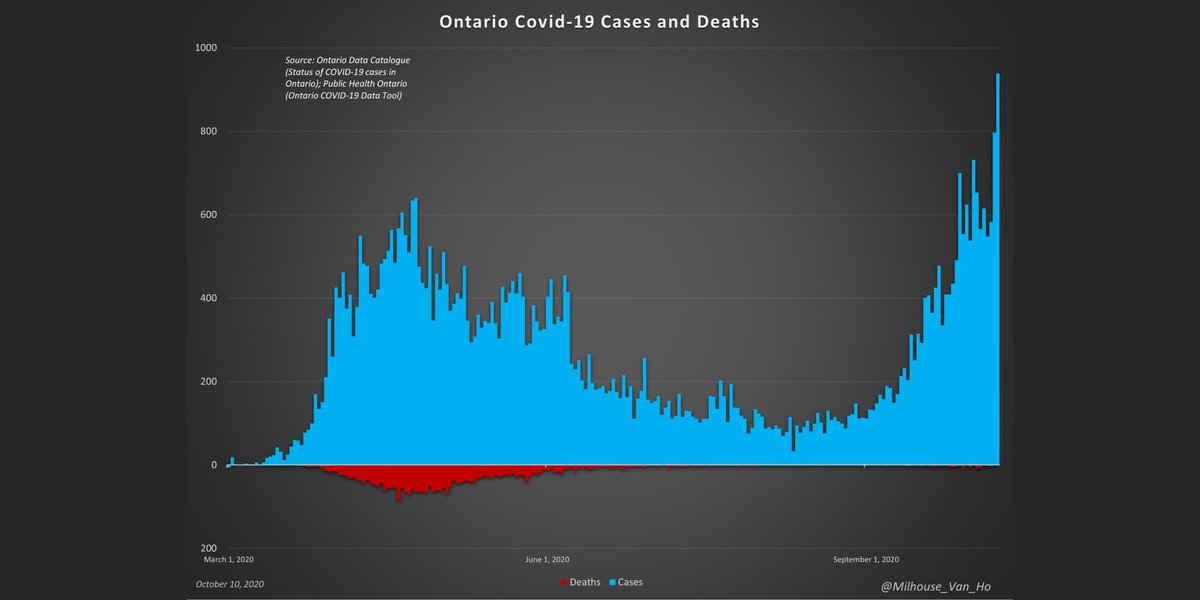
Ontario (population: 14,745,040):
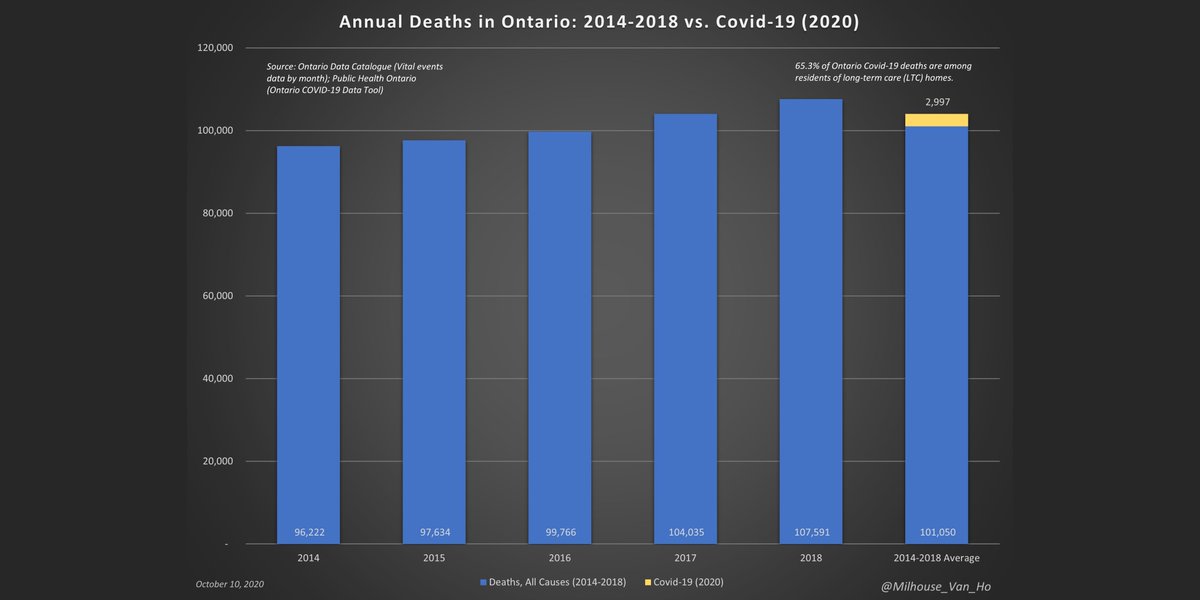
Total deaths by/with covid-19: 2,997 (203 deaths per every million people in ON or 0.02%)
38.8% of Canadian population but 31.3% of Canada deaths by/with covid-19
More deaths >90 (973) than <80 (936)
65.3% in LTC homes
Total deaths by/with covid-19: 2,997 (203 deaths per every million people in ON or 0.02%)
38.8% of Canadian population but 31.3% of Canada deaths by/with covid-19
More deaths >90 (973) than <80 (936)
65.3% in LTC homes

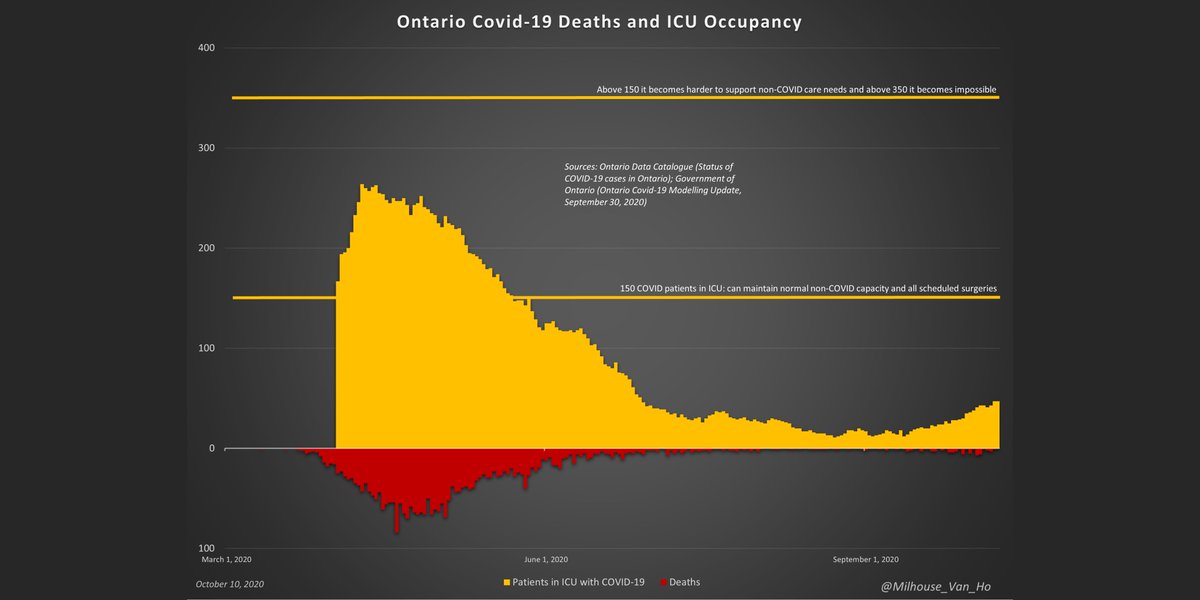
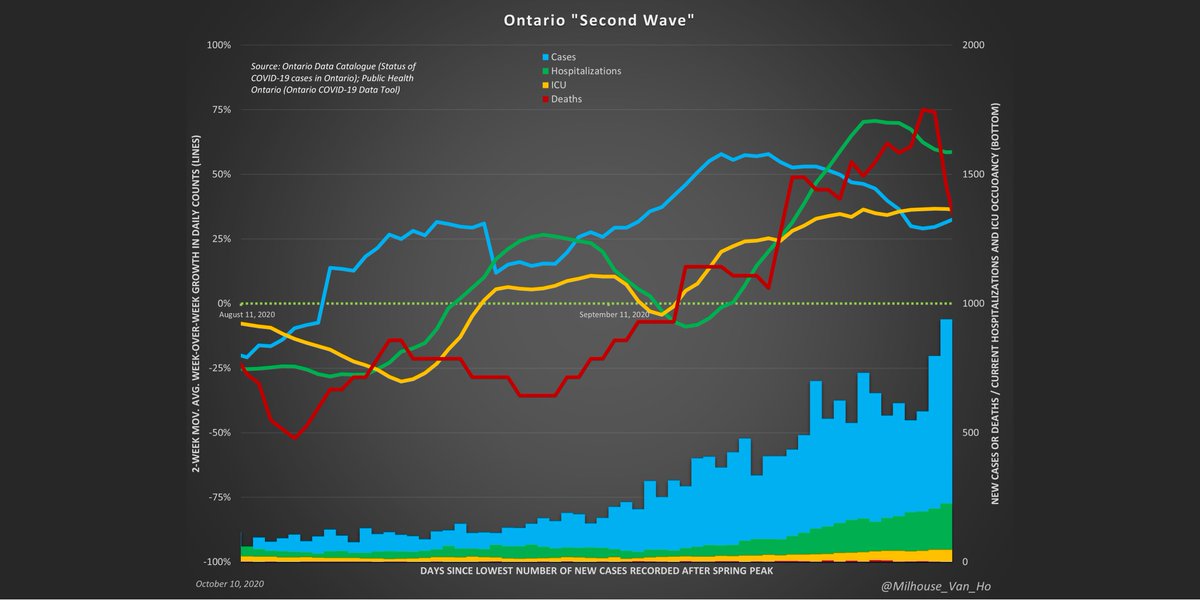
The two most important metrics to watch: deaths and ICU occupancy.
Ontario now reports:
- 47 in ICU
- 29 in ICU on a ventilator
Ontario now reports:
- 47 in ICU
- 29 in ICU on a ventilator
Ontario now reports:
- 47 in ICU
- 29 in ICU on a ventilator
- 47 in ICU
- 29 in ICU on a ventilator
Here are the official Ontario ICU models for the “second wave.”
The Ontario Actual line has been extended here (see blue line to right of the star icon) to show progress since the models were released.
The good news is we are still outperforming the Low Scenario.
The Ontario Actual line has been extended here (see blue line to right of the star icon) to show progress since the models were released.
The good news is we are still outperforming the Low Scenario.

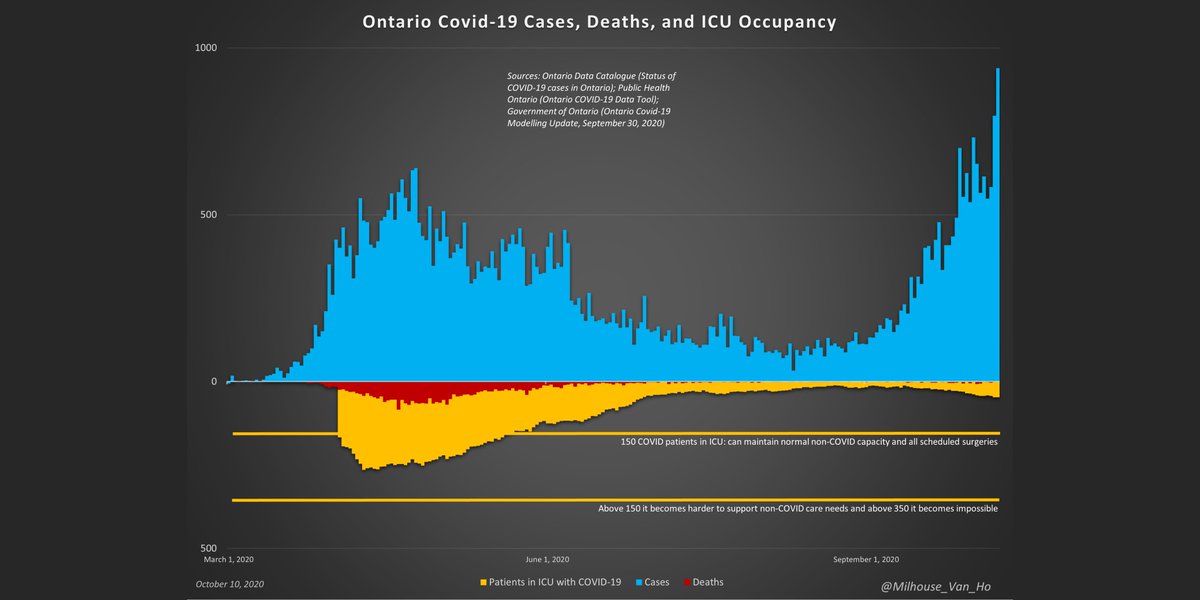
Ontario now reports:
- 225 in hospital
- 47 in ICU
- 29 in ICU on a ventilator
- 225 in hospital
- 47 in ICU
- 29 in ICU on a ventilator

A note on hospitalization data: This may include those who have had a positive test result after being hospitalized for a different reason.

Ontario - The proportion of cases (positive test results) resulting in death (yellow line).
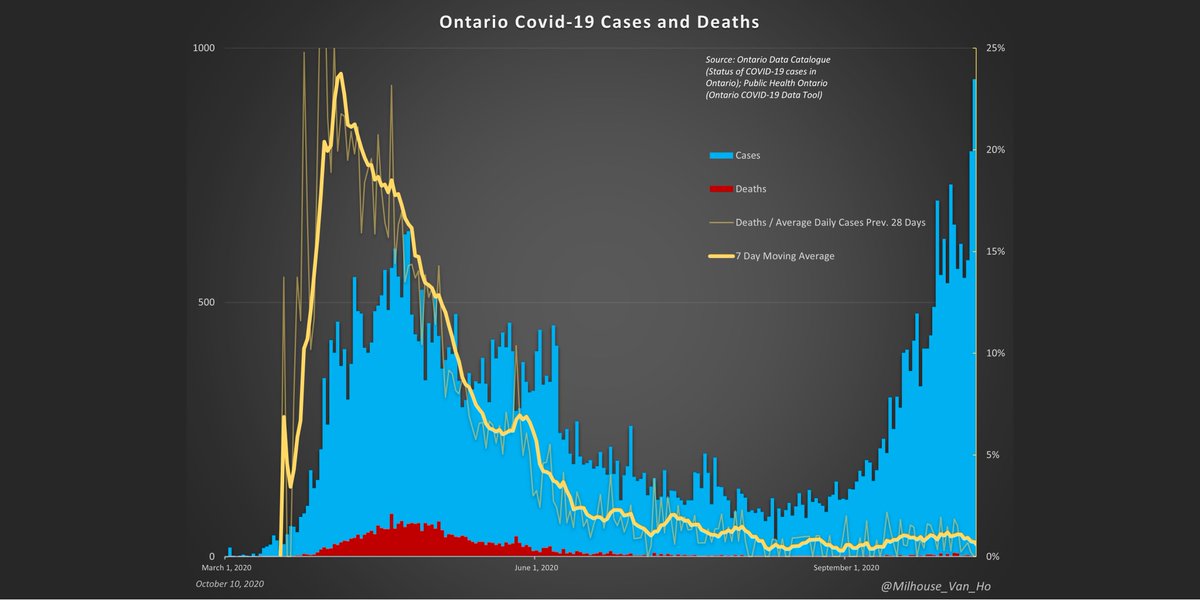
Ontario “Second Wave”:
- Growth is not exponential
- May be able to declare a peak when average week-over-week growth reaches zero
- Growth is not exponential
- May be able to declare a peak when average week-over-week growth reaches zero
The Ontario government's ramping up of testing and easing of testing criteria have likely affected the number of cases (positive test results).
Positive test results may rise further as the government works toward its goal of 50,000 daily tests.
Positive test results may rise further as the government works toward its goal of 50,000 daily tests.
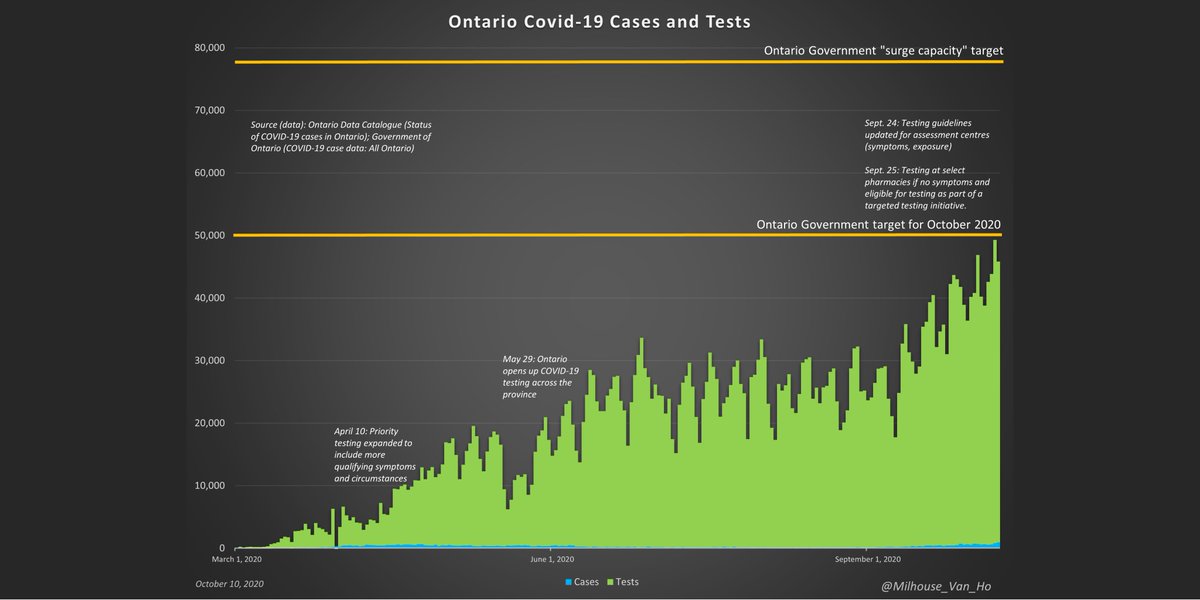
The positivity rate on tests conducted in Ontario (yellow line).

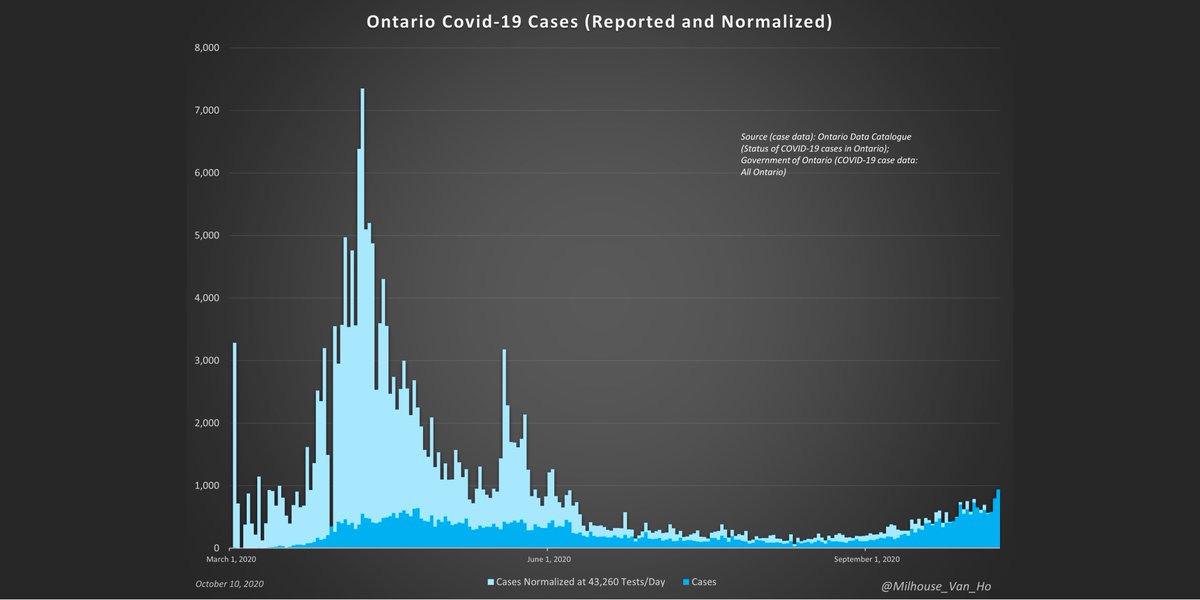
*Hypothetical:
This chart normalizes cases (positive test results) to show how many would have been reported since March 1 if:
1. the current level of testing (daily avg over past 7 days) had been maintained throughout, and
2. no changes to positivity rates reported earlier.
This chart normalizes cases (positive test results) to show how many would have been reported since March 1 if:
1. the current level of testing (daily avg over past 7 days) had been maintained throughout, and
2. no changes to positivity rates reported earlier.
This is what 2020 might look like in Ontario if:
1. All-cause deaths (excl. Covid-19) are in line with 2014-18 averages
2. All Covid-19 deaths are single-cause excess deaths
(n.b. Based on 2020 YTD data for Covid-19 - figures to be revised upward as needed.)
1. All-cause deaths (excl. Covid-19) are in line with 2014-18 averages
2. All Covid-19 deaths are single-cause excess deaths
(n.b. Based on 2020 YTD data for Covid-19 - figures to be revised upward as needed.)
This is what 2020 might look like in Ontario month-to-month if:
1. All-cause deaths (excl. Covid-19) are in line with 2016-18 averages
2. All Covid-19 deaths are single-cause excess deaths
(n.b. Based on 2020 YTD data for Covid-19 - figures to be revised upward as needed.)
1. All-cause deaths (excl. Covid-19) are in line with 2016-18 averages
2. All Covid-19 deaths are single-cause excess deaths
(n.b. Based on 2020 YTD data for Covid-19 - figures to be revised upward as needed.)

Greater Toronto and Ottawa account for 50.3% of Ontario’s population but 79.9% of Ontario’s covid-19 deaths.
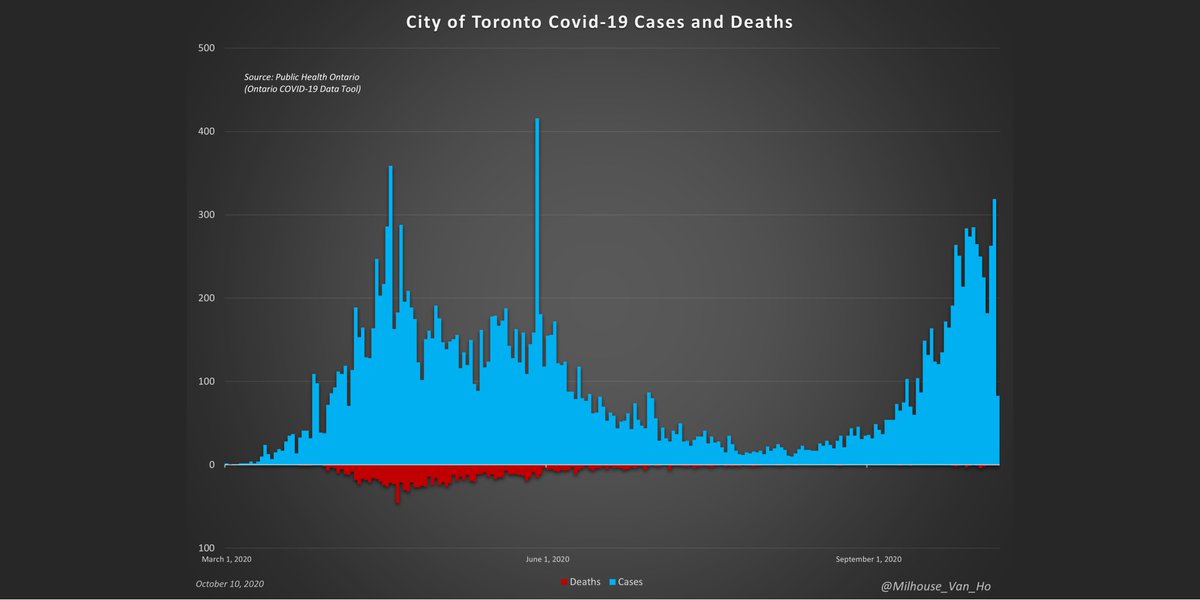
City of Toronto (population: 2,731,571 or 19% of Ontario):
Total deaths by/with covid-19: 1,313 (479 deaths per every million people in Toronto or 0.05%)
43.8% of Ontario deaths by/with covid-19
Total deaths by/with covid-19: 1,313 (479 deaths per every million people in Toronto or 0.05%)
43.8% of Ontario deaths by/with covid-19
Suburban Toronto (population: 3,685,945 or 25% of Ontario):
Total deaths by/with covid-19: 786 (213 deaths per every million people in the region or 0.02%)
26.2% of Ontario deaths by/with covid-19
Total deaths by/with covid-19: 786 (213 deaths per every million people in the region or 0.02%)
26.2% of Ontario deaths by/with covid-19

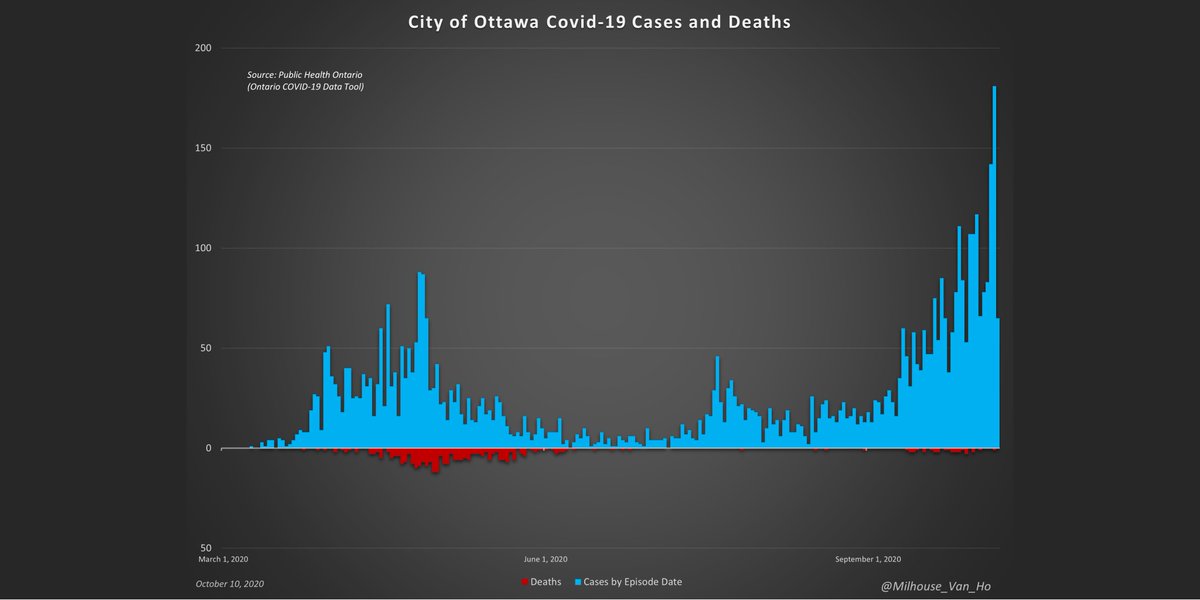
City of Ottawa (population: 1,006,210 or 7% of Ontario):
Total deaths by/with covid-19: 296 (294 deaths per every million people in Ottawa or 0.03%)
9.9% of Ontario deaths by/with covid-19
Total deaths by/with covid-19: 296 (294 deaths per every million people in Ottawa or 0.03%)
9.9% of Ontario deaths by/with covid-19
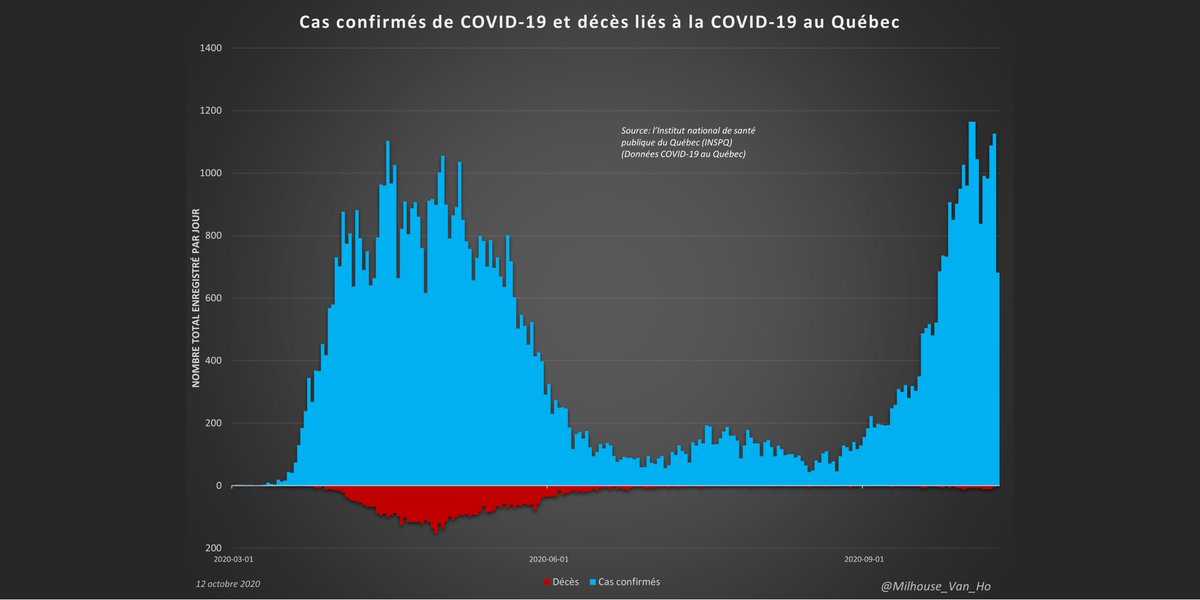
Québec (population: 8,552,362):
Nombre total de décès liés à Covid-19: 5 936 (694 décès pour chaque million de personnes au Québec ou 0,07%).
22,5% de la population canadienne, mais 61,9% des décès liés à la covid-19 au Canada.
Nombre total de décès liés à Covid-19: 5 936 (694 décès pour chaque million de personnes au Québec ou 0,07%).
22,5% de la population canadienne, mais 61,9% des décès liés à la covid-19 au Canada.

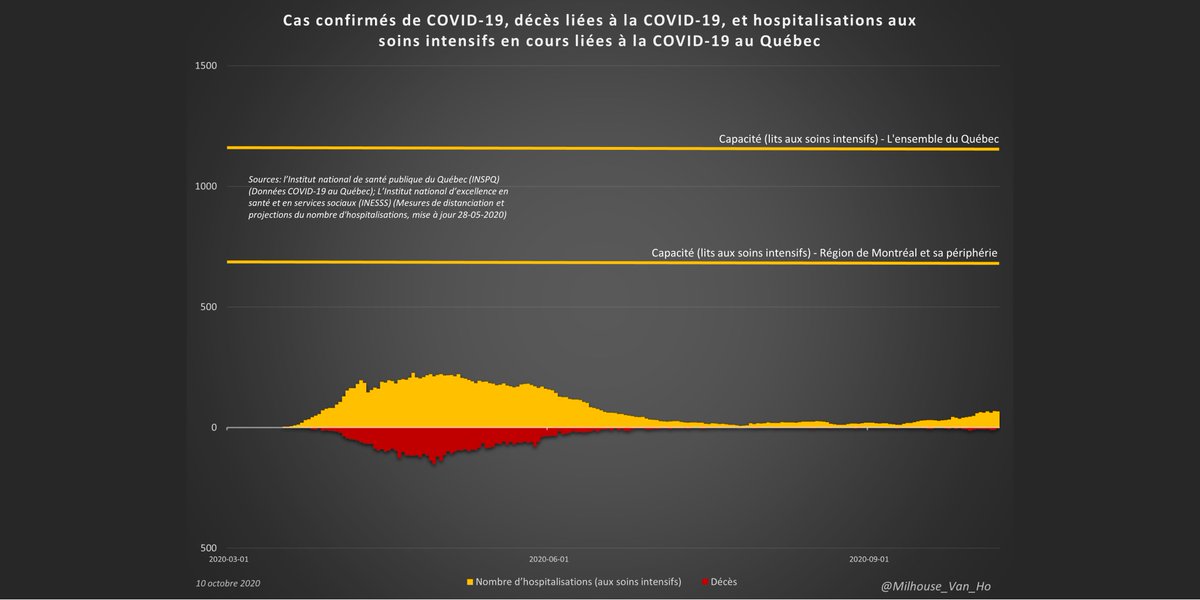
Les deux paramètres les plus importants à surveiller: les décès et hospitalisations aux soins intensifs.
67 hospitalisations aux soins intensifs en cours au Québec.
67 hospitalisations aux soins intensifs en cours au Québec.
67 hospitalisations aux soins intensifs en cours au Québec.

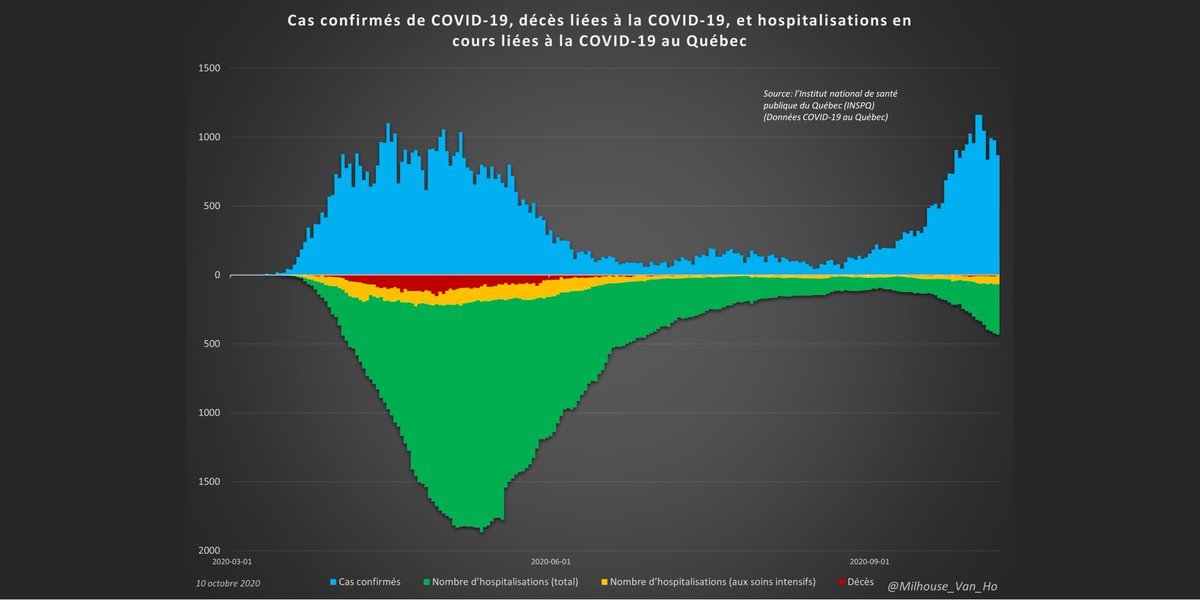
433 hospitalisations en cours au Québec:
- 67 aux soins intensifs
- 366 hors soins intensifs
- 67 aux soins intensifs
- 366 hors soins intensifs
Québec - La proportion de cas entraînant la mort (ligne jaune).

« La deuxième vague » au Québec :
- La croissance n'est pas exponentielle
- On peut être en mesure de déclarer un pic quand croissance moyenne d'une semaine à l'autre s'approche de zéro
- La croissance n'est pas exponentielle
- On peut être en mesure de déclarer un pic quand croissance moyenne d'une semaine à l'autre s'approche de zéro
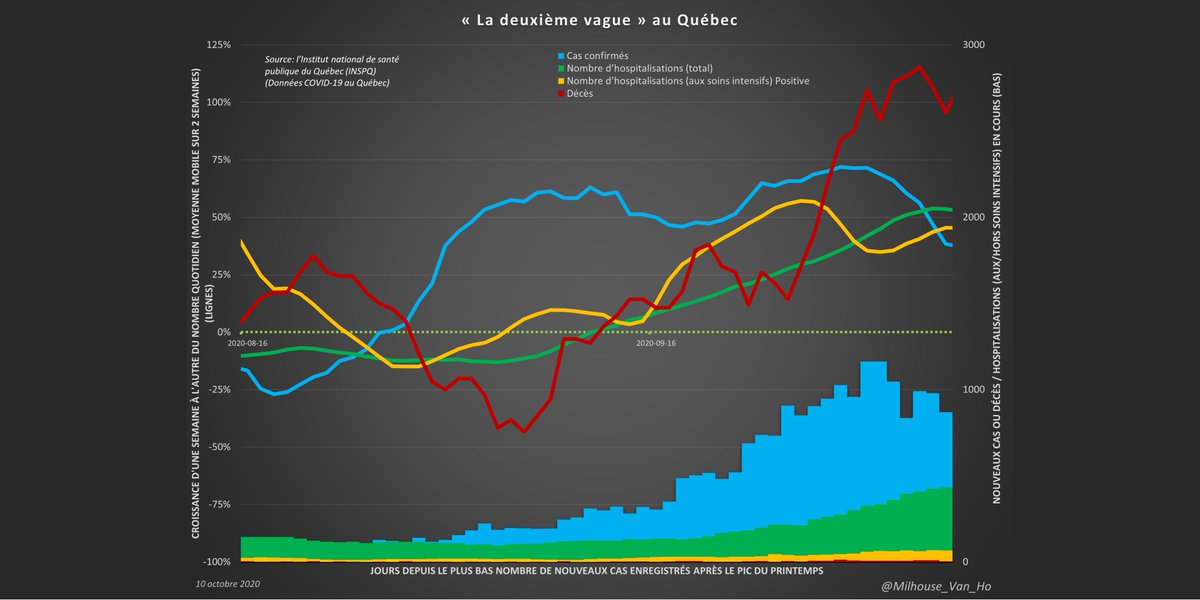
Le niveau de dépistage du gouvernement du Québec a vraisemblablement eu un impact sur le nombre de cas.
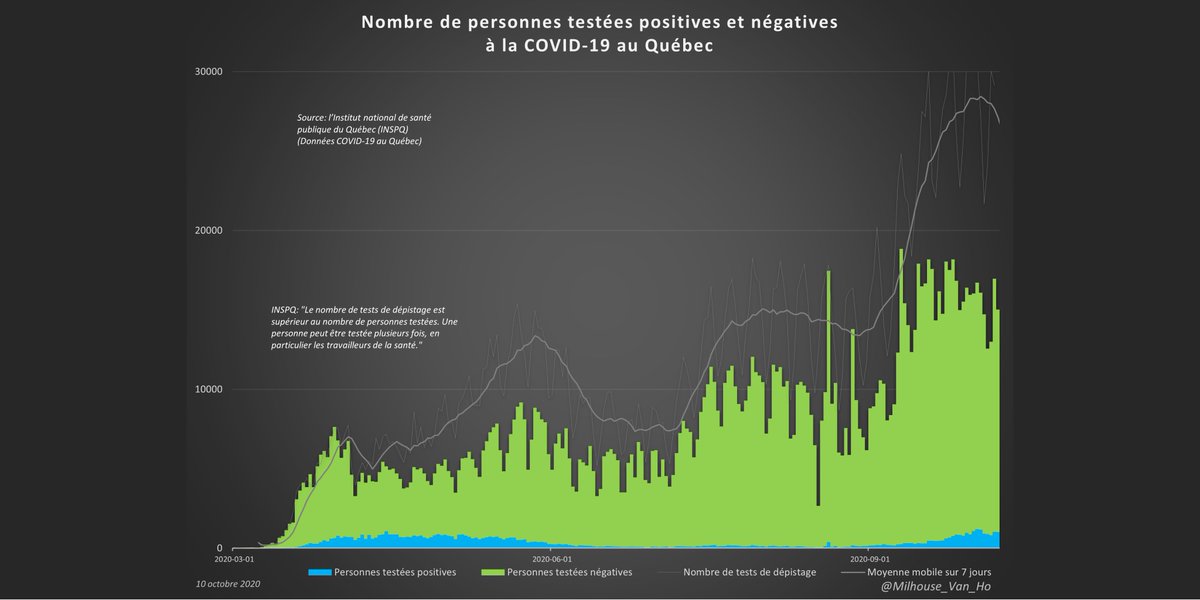
La proportion de personnes au Québec testées positives aux tests.
Notez que le Québec rapporte le nombre de personnes testées, pas simplement le nombre de tests (contrairement à Ontario).
Notez que le Québec rapporte le nombre de personnes testées, pas simplement le nombre de tests (contrairement à Ontario).

• • •
Missing some Tweet in this thread? You can try to
force a refresh