
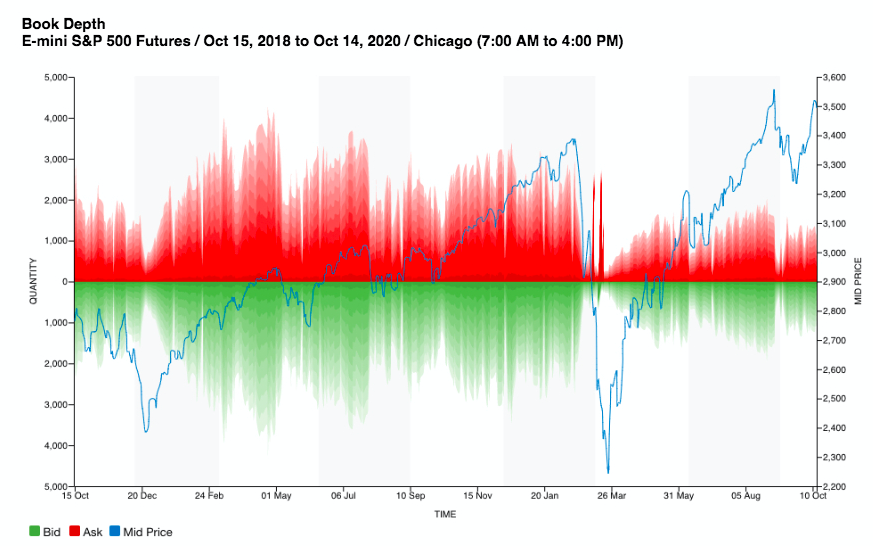
#ES_F futures depth. Charts like this have been circling around for a while, but I think this is one of the most critical pieces of data that can't be ignored. Highlights the shift that occurred in the markets, and the vulnerabilities that loom from the current lack of liquidity. 
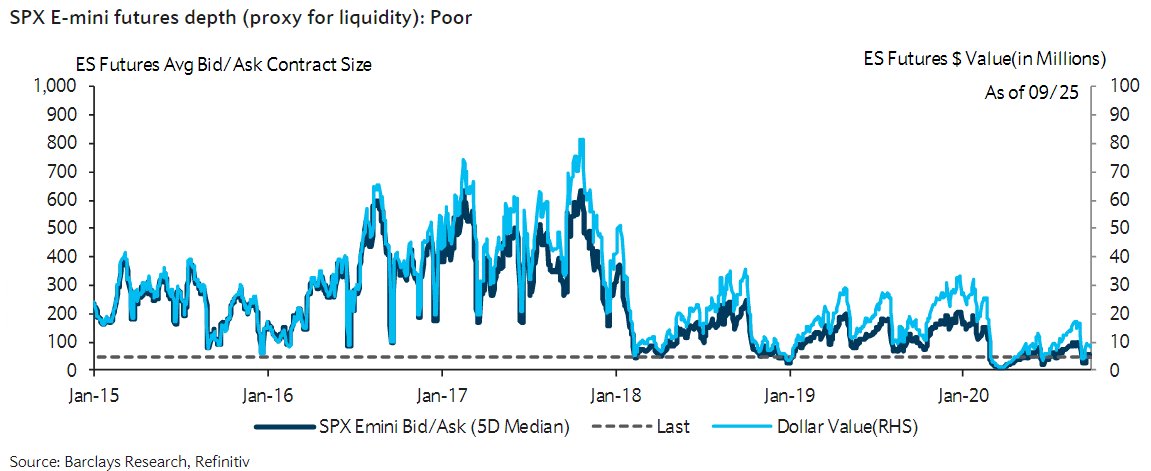
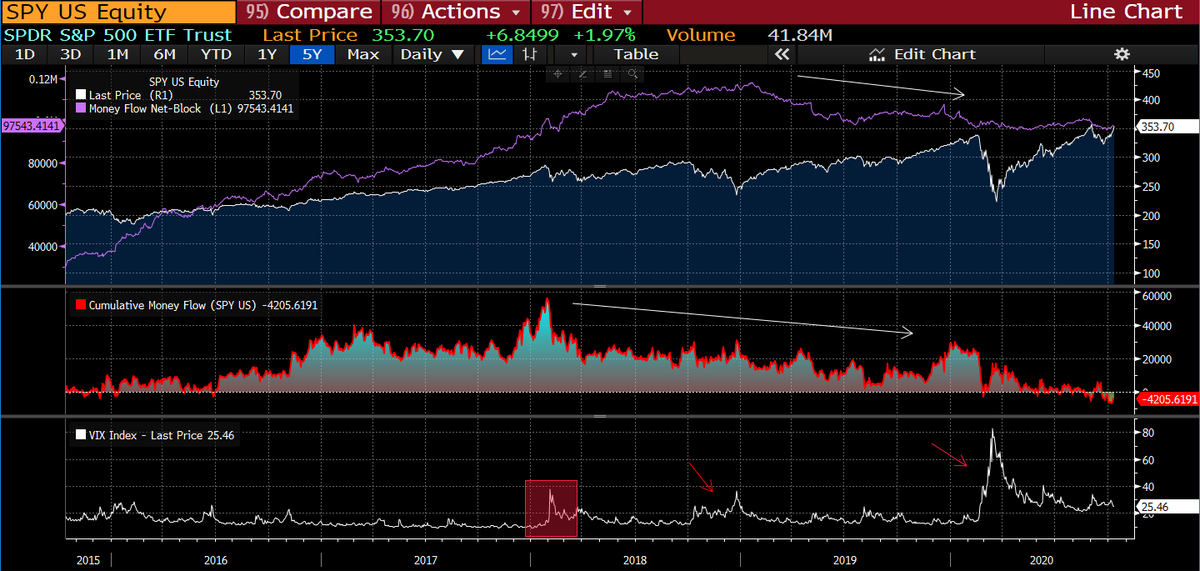
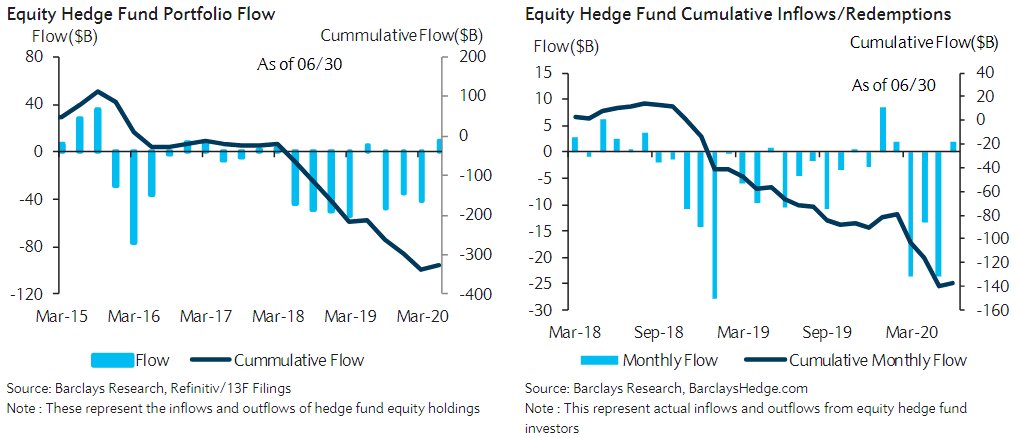
It's no coincidence that the $VIX spike in Feb 2018, Volmageddon, coincided with this shift in declining liquidity and triggered money flowing out of equities. Volmageddon marked a regime change in volatility, and hence declining liquidity that creates more fragile equity markets
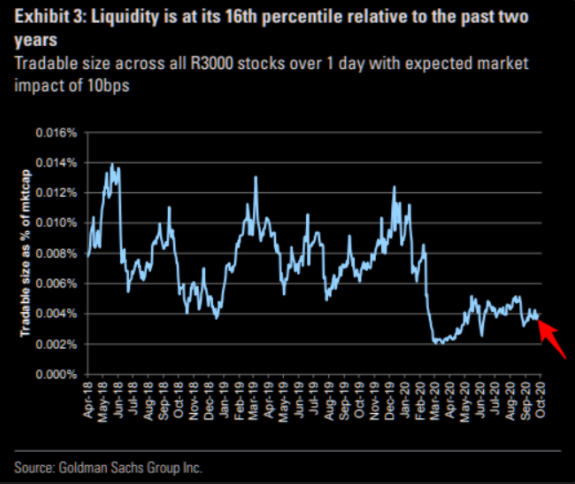
Came across this; tradable size across all R3000 stocks with an expected impact of 0.1%. This is consistent with the decline in #ES_F liquidity, further highlighting increasing divergences underneath the surface & the fragility that has emerged in the market.
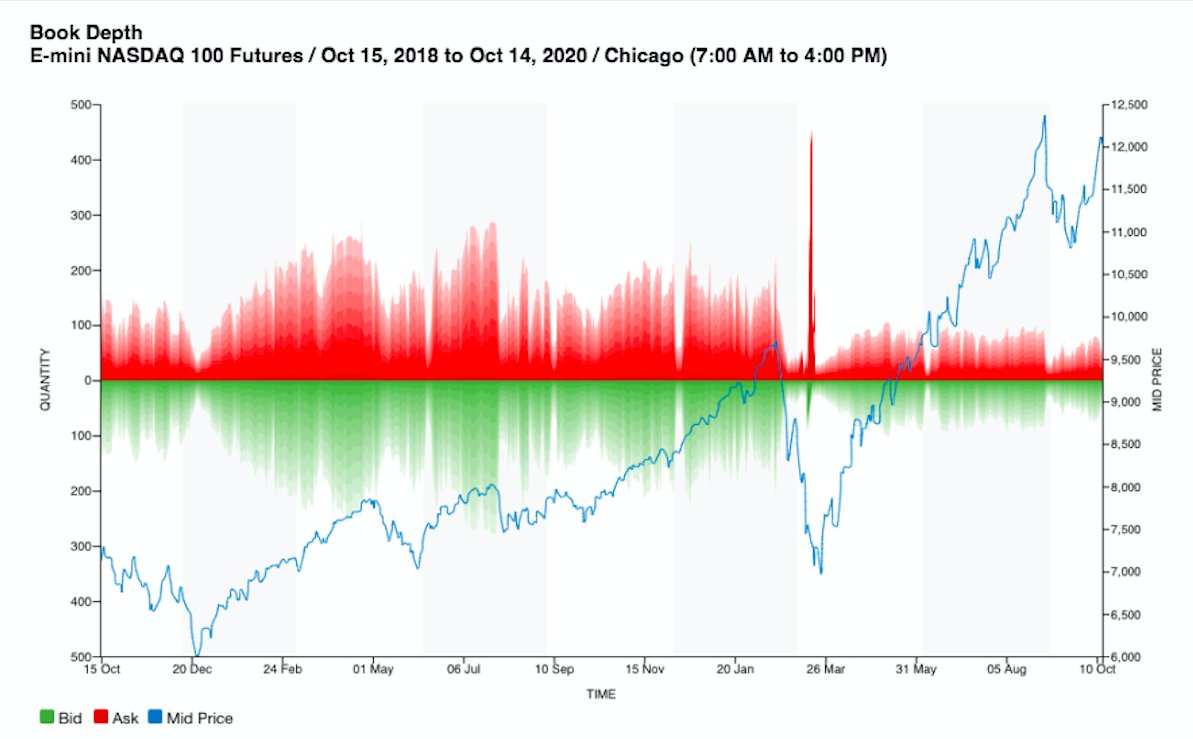
One more, here's book depth for the top 10 levels on #ES_F & #NQ_F. Clear indication that liquidity has been vanishing despite this "bull" run. This matters because the divergence exposes the big picture foundational weakness of markets & the risks this vulnerability can trigger.
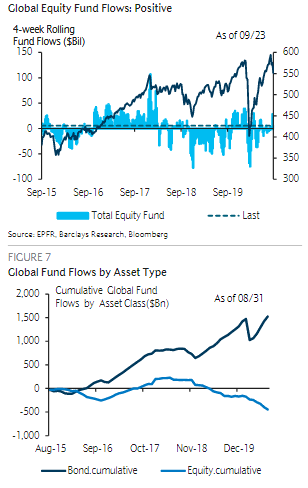
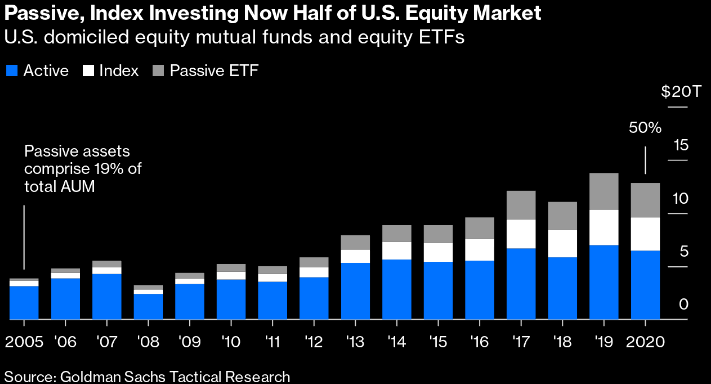
Passive & index funds are taking up an increasing share of equity markets. This growing concentration is killing diversification &creating a dangerous reflexivity of high correlations & volatility. This capital flow poses a huge risk to a fragile market with diminishing liquidity
This emerging bifurcation in equity markets in the post-QE era is tied to central banks' control & can be observed through it's impact on volatility, as it creates a dynamic with fatter tails of higher vol. Periods of vol suppression last longer, but rises in $VIX are more rapid.
Essentially, this regime change that Volmageddon marked was highlighting the artificial stability that central banks tried to manifest through liquidity injections in the post-crisis era beginning to have diminishing marginal effects & starting to backfire
https://twitter.com/FadingRallies/status/1316887707109515267?s=20
Great thread from @VMRConstancio on the collapse of liquidity in Treasuries in March, highlighting how bond fund redemption outflows fueled this crash. While my thread focuses on equities, this reflexive capital flow & vol dynamic is essentially the same
https://twitter.com/VMRConstancio/status/1319283496477626368?s=20
• • •
Missing some Tweet in this thread? You can try to
force a refresh


