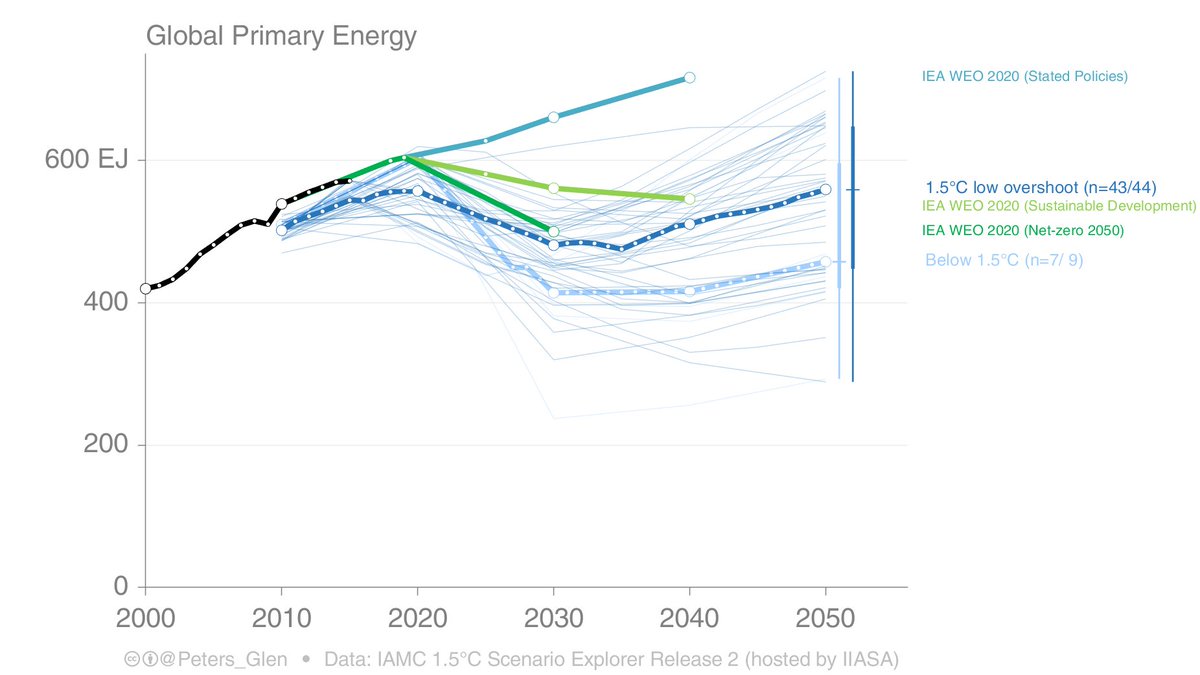
THREAD: The @IEA now has an aggressive 1.5°C scenario, reaching net-zero by 2050.
It builds on the Sustainable Development Scenario, strengthening reductions in power & end-use, but with new behavioural measures.
The light blue scenarios are IPCC SR15.
iea.org/reports/world-…
It builds on the Sustainable Development Scenario, strengthening reductions in power & end-use, but with new behavioural measures.
The light blue scenarios are IPCC SR15.
iea.org/reports/world-…
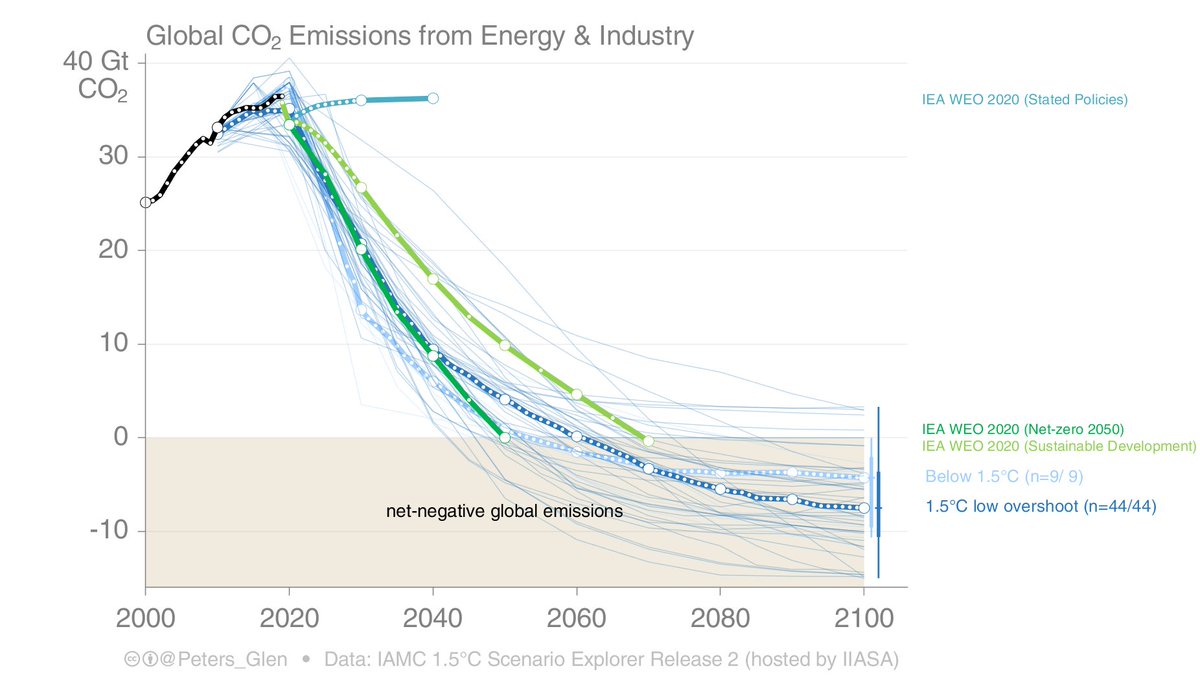
2. Contrary to the view of many, the Sustainable Development Scenario (SDS) was already quite aggressive (~1.65°C).
The Net-Zero 2050 Scenario (NZE2050) is more aggressive than the SDS on power & end-use, but also includes some additional behavioural measures.
The Net-Zero 2050 Scenario (NZE2050) is more aggressive than the SDS on power & end-use, but also includes some additional behavioural measures.
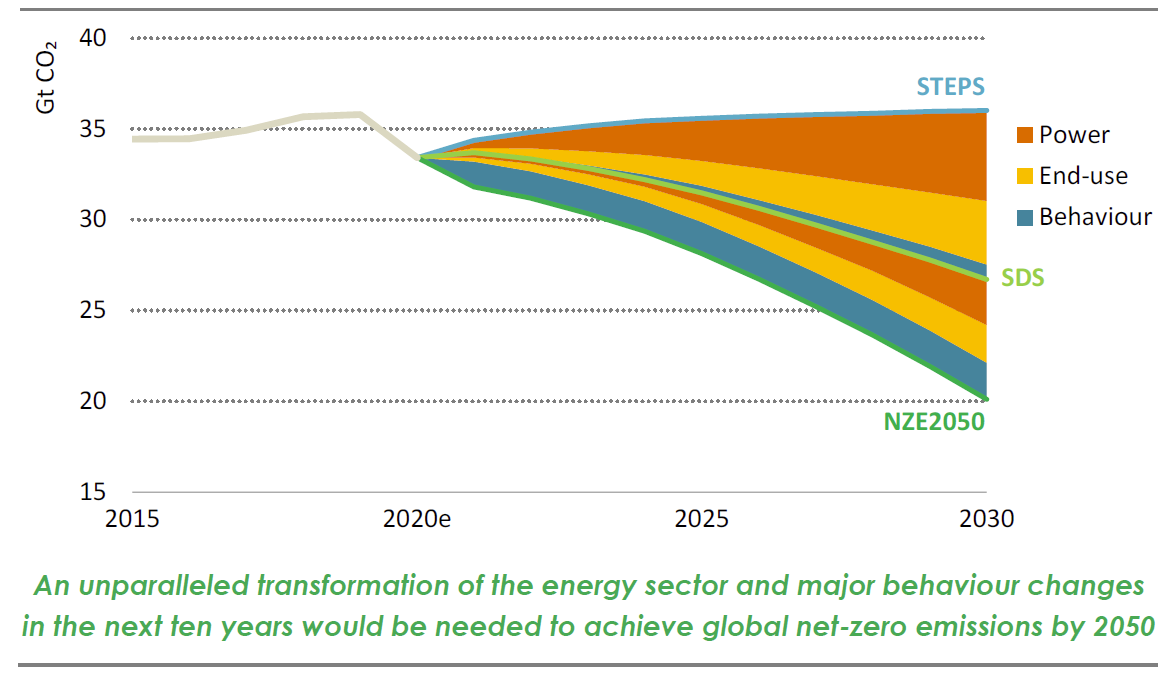
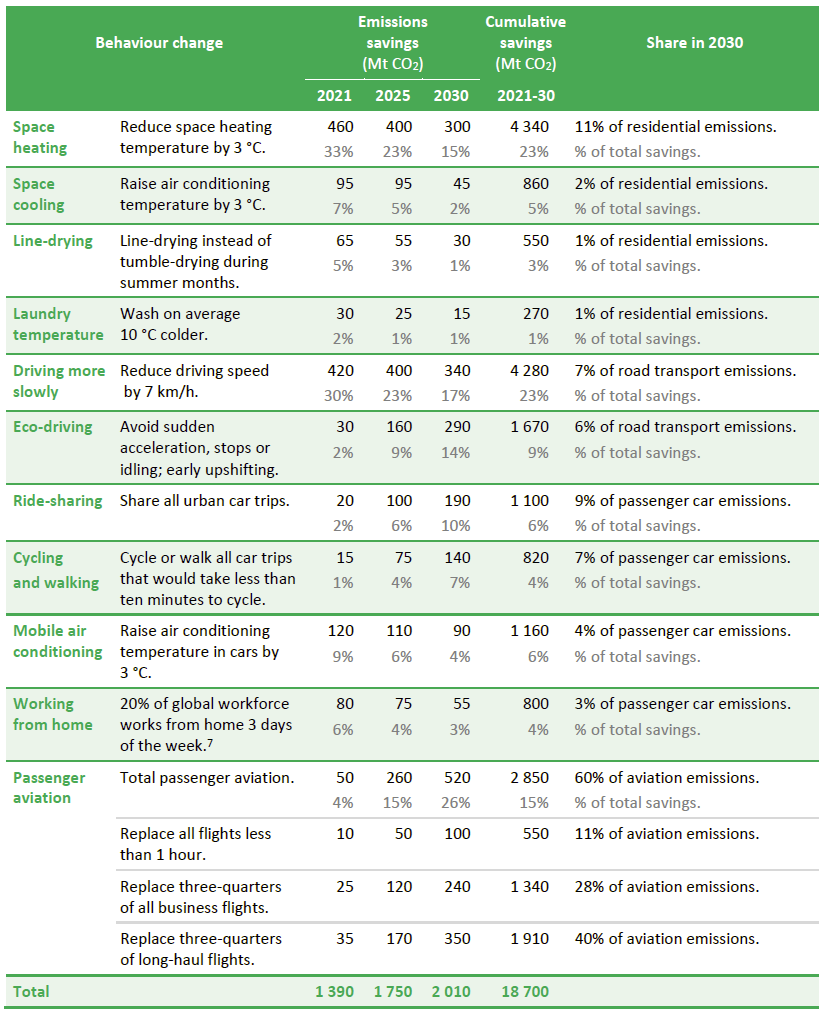
3. The thing with the behavioural measures is that you have to do a lot of them, & they are quite specific & targeted. This is on top of aggressive technological change.
The point is that 1.5°C requires pulling on pretty much every level, to the max. Now, not tomorrow.
The point is that 1.5°C requires pulling on pretty much every level, to the max. Now, not tomorrow.
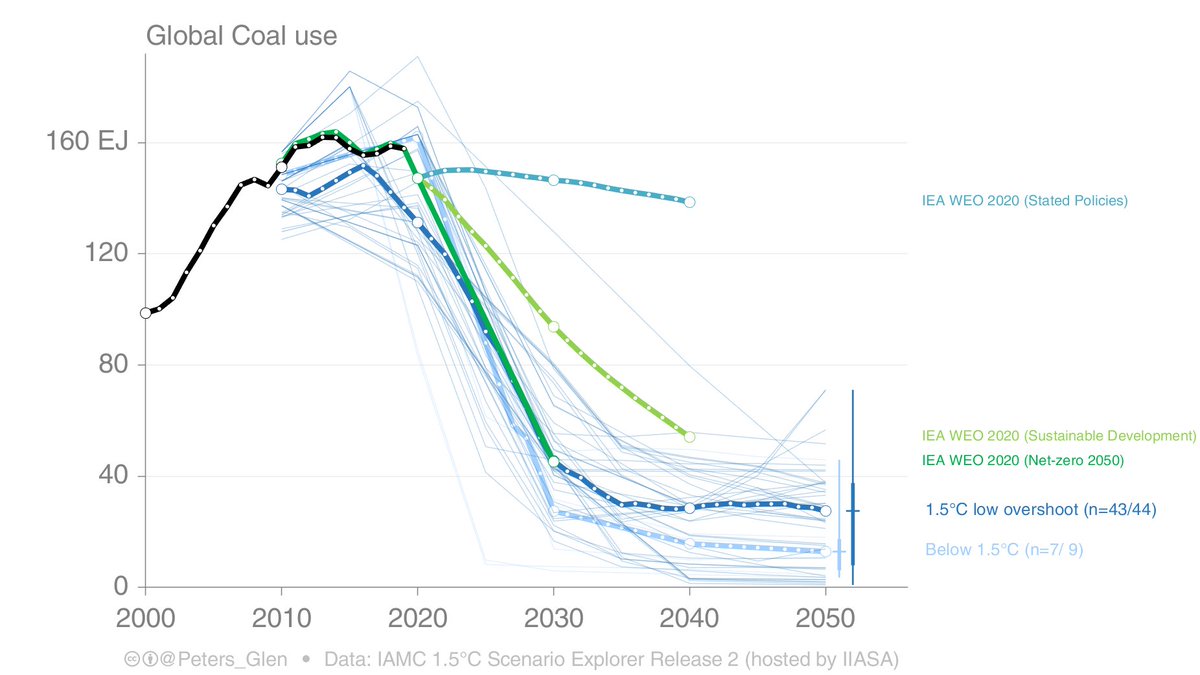
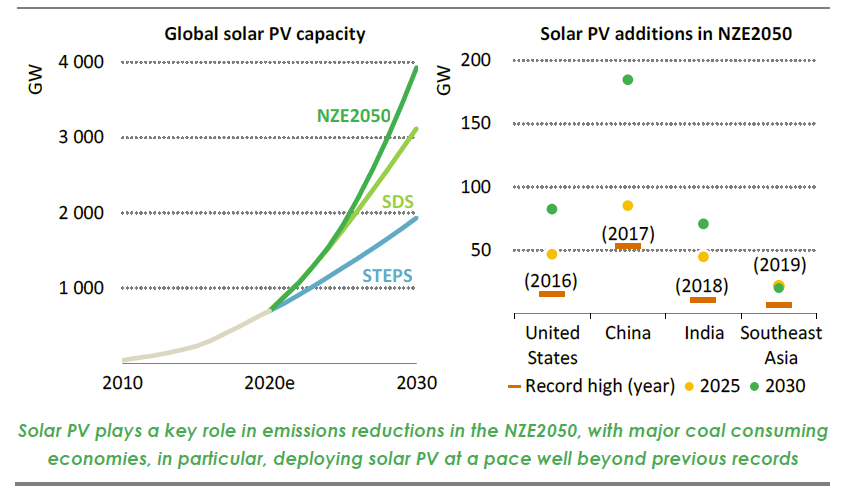
4. Coal use takes a dive in NZE2050, basically a 75% drop in the next decade. This will require massive coal closures, particularly in the developing world.
The Stated Policies Scenario (STEPS) sees coal declining. For coal, it is a matter of how fast it goes, not if it goes.
The Stated Policies Scenario (STEPS) sees coal declining. For coal, it is a matter of how fast it goes, not if it goes.
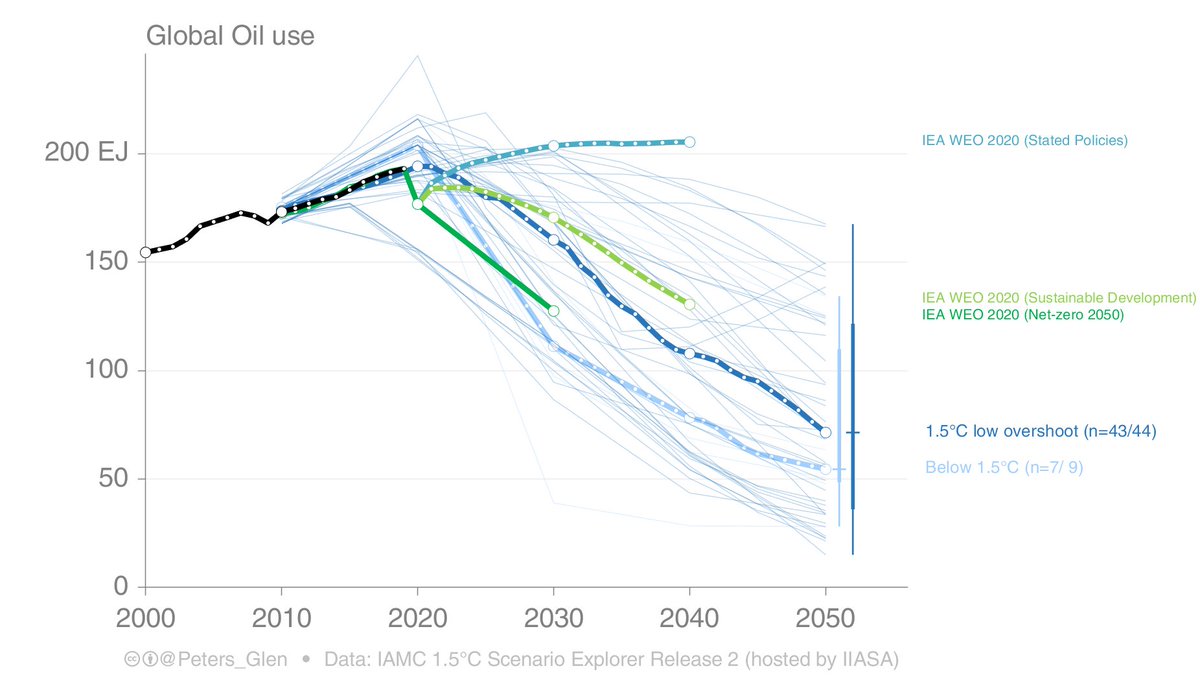
5. Oil has a more gradual reduction, basically, reductions are easier elsewhere (eg coal).
This is the same with the scenarios assessed by the IPCC (light blue), it is not as if the IEA is turning up oil & doing something different. Even the SDS is in the range of IPCC 1.5°C...
This is the same with the scenarios assessed by the IPCC (light blue), it is not as if the IEA is turning up oil & doing something different. Even the SDS is in the range of IPCC 1.5°C...
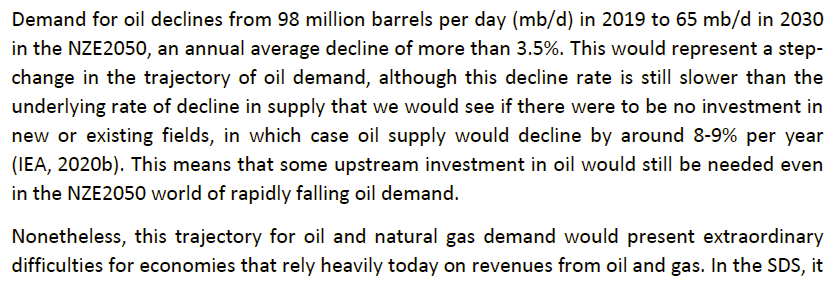
6. The oil "decline rate is still slower than the underlying rate of decline in supply ... means that some upstream investment in oil would still be needed even in the NZE2050 world of rapidly falling oil demand."
This will annoy some people, but this is the same with the IPCC!
This will annoy some people, but this is the same with the IPCC!
7. The IPCC says much the same on oil (& gas), but in a less direct way.
I am perhaps labouring on this point, but in terms of key characteristics of 1.5°C-2°C, there is little separating IEA & IPCC. A critique on the IEA for oil, applies equally to the IPCC.
I am perhaps labouring on this point, but in terms of key characteristics of 1.5°C-2°C, there is little separating IEA & IPCC. A critique on the IEA for oil, applies equally to the IPCC.
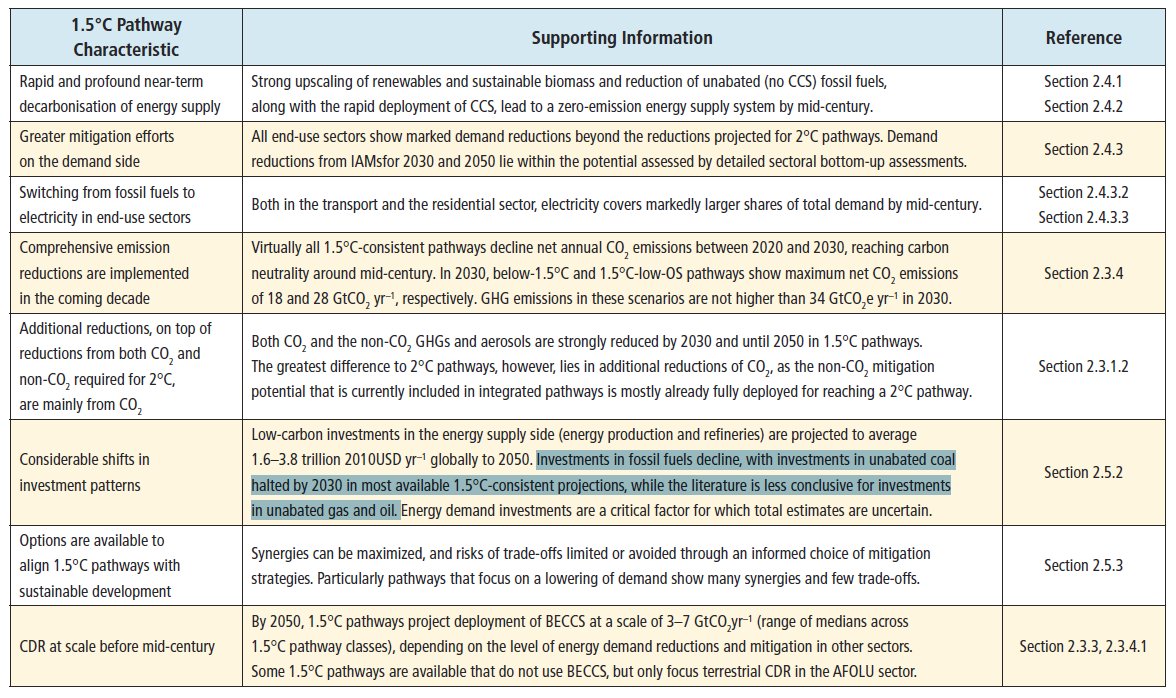
8. Because the IEA & IPCC say there is space for more investment in oil & gas, does not mean it is a free for all.
The fundamental point is that there is considerably less oil in a 1.5°C than in a 3°C pathway, so oil investments need to fundamentally change.
The fundamental point is that there is considerably less oil in a 1.5°C than in a 3°C pathway, so oil investments need to fundamentally change.
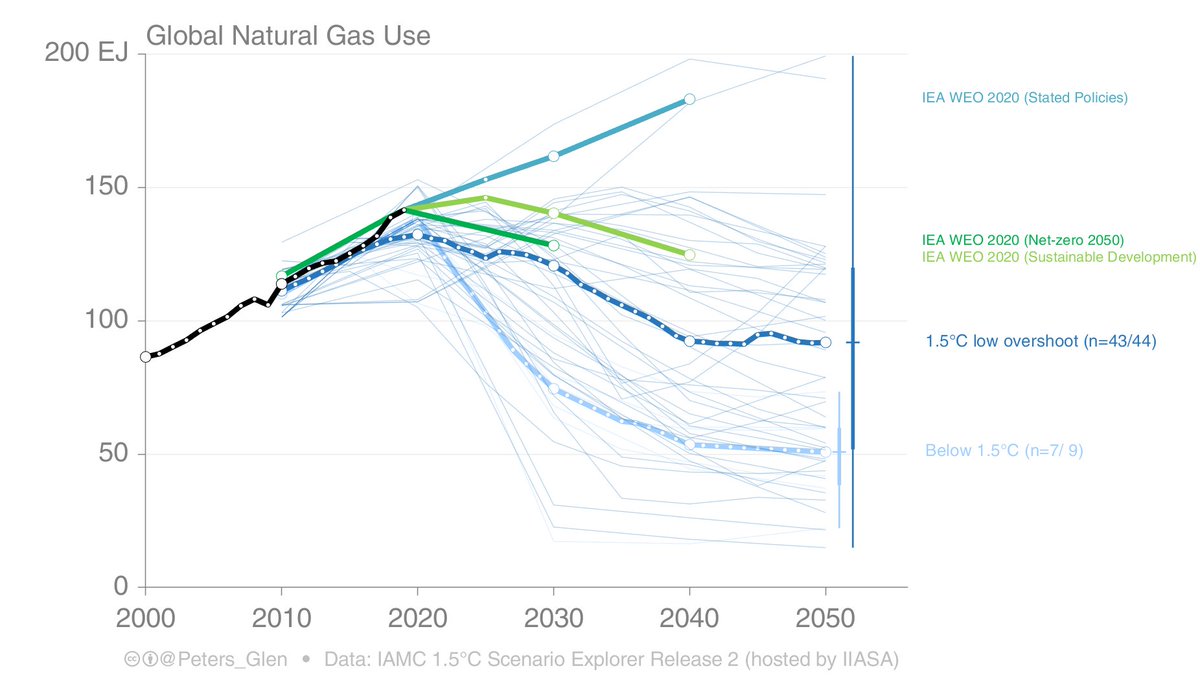
9. The IEA gets away with a little more gas than many other scenarios, though will within the ranges. More gas just means less coal & oil (for a given carbon budget). Likewise, less gas means more coal & oil.
Comes back the IPCC, the literature is inconclusive on scale of gas.
Comes back the IPCC, the literature is inconclusive on scale of gas.
10. Solar plays a strong role in NZE2050, initially following the same path as SDS, but then accelerating faster from 2025.
A key point here is that it is a lot more solar than in STEPS, which means more policy & support is needed to get solar on a path consistent with 1.5-2°C.
A key point here is that it is a lot more solar than in STEPS, which means more policy & support is needed to get solar on a path consistent with 1.5-2°C.
11. Overall, global primary energy use declines in 1.5°C scenarios, though many scenarios show an increase from 2030 onwards. This U shape is due to offsetting effects: efficiency improvements & fuel switching are eventually offset by growing demand (but less than today).
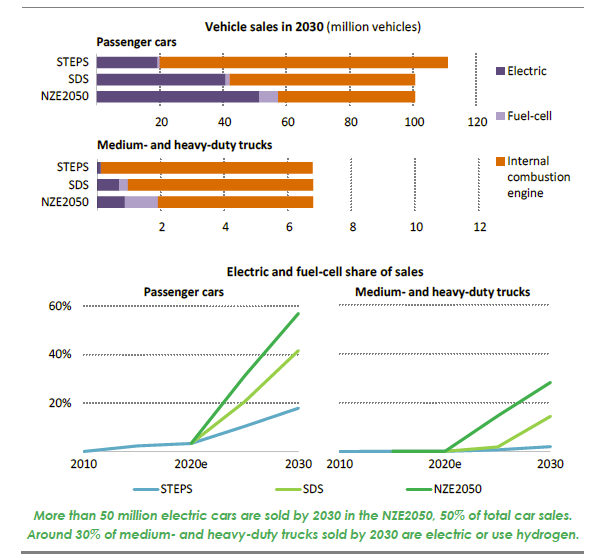
12. One good thing about the IEA is the additional sector detail. Here, for example, is how the transport sector changes: by 2030, over 50% of passenger cars sold in the NZE2050 are electric.
This sort of detail is hard to find in other scenarios.
This sort of detail is hard to find in other scenarios.
13. There is a lot of detail in the WEO chapter on net-zero. I have shown a few snippets, but there are 24 figures and a lot of discussion to give a good understanding what has to happen by 2030 for net-zero in 2050.
14. The chapter focuses on 2030, so there is little detail on what has to happen from 2030 to 2050, and how net-zero is maintained after 2050.
But, this is all moot unless the reductions happen by 2030, so the focus is completely justified.
But, this is all moot unless the reductions happen by 2030, so the focus is completely justified.
15. I am a little curious how the IEA critiques respond to this. Will they continue to focus on critiquing IEA from different angles, or help the IEA elevate & focus on the importance of 1.5°C. The IEA gives a blow-by-blow description to 2030, only need to implement?
16/16. Another great report from the @IEA, & great work led by @Laura_Cozzi_ & @tgouldao. Not only was net-zero & 1.5°C elevated, but COVID-19 was fully integrated into the scenarios. All while under difficult working conditions. Impressive!
Summary:
iea.org/reports/world-…
Summary:
iea.org/reports/world-…
• • •
Missing some Tweet in this thread? You can try to
force a refresh