THREAD: personal thoughts on tiers, circuit breakers, restrictions, R (ENGLAND)

My calcs based on SAGE notes (bit.ly/3lTraqv) & SpiM paper on circuit breaker (bit.ly/2T0p6AA)

TLDR: 2 week circuit breaker NOW, then enough restrictions/FTTIS to keep R below 1
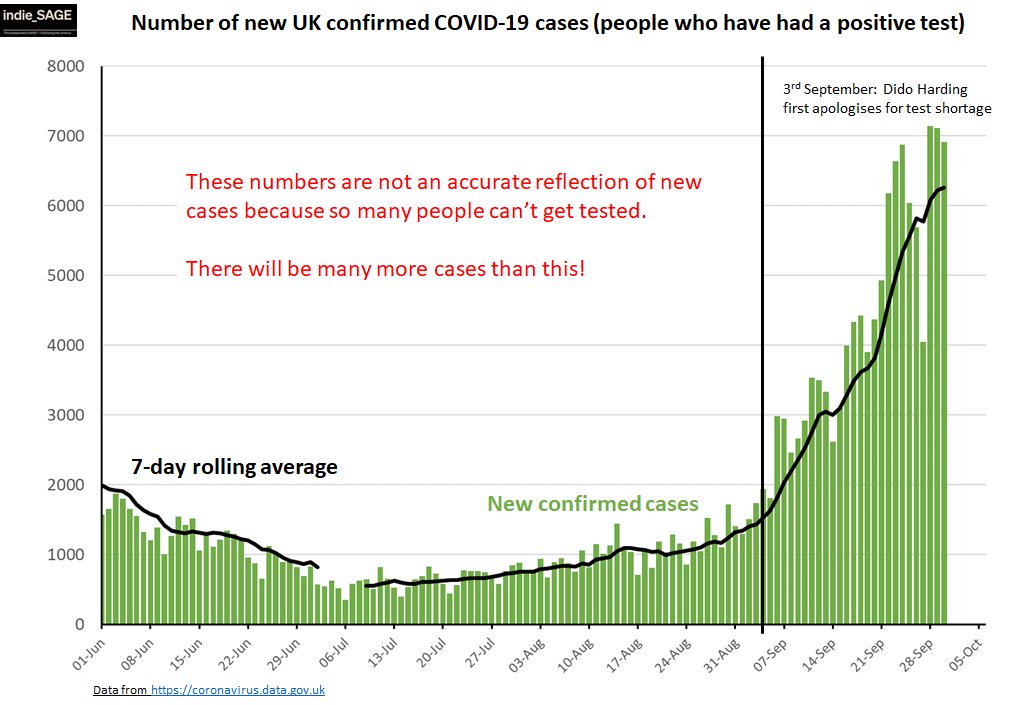
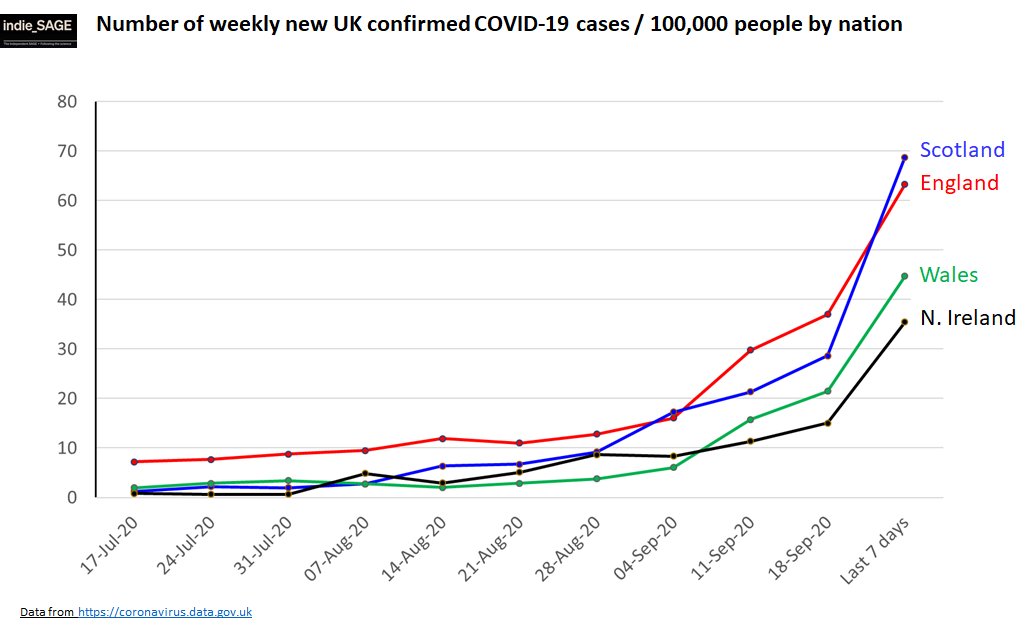
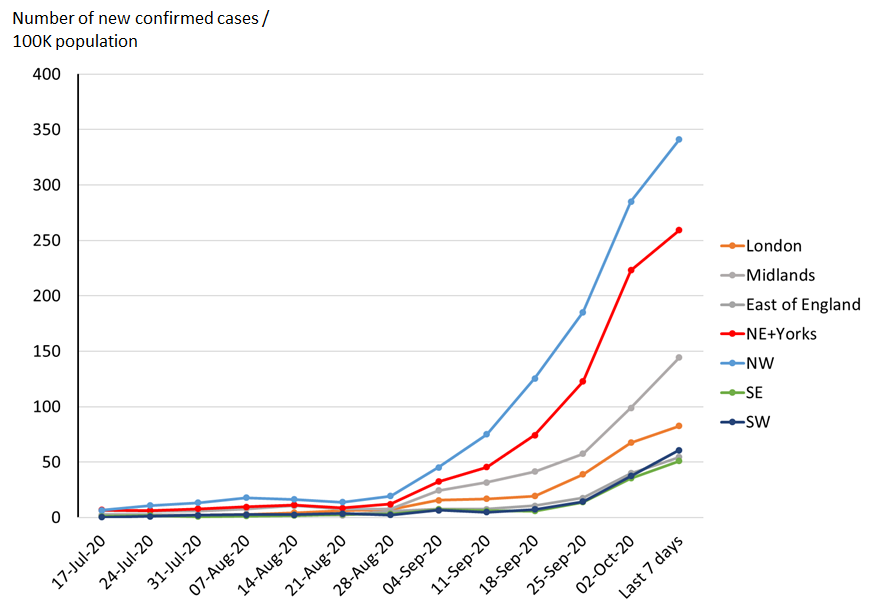
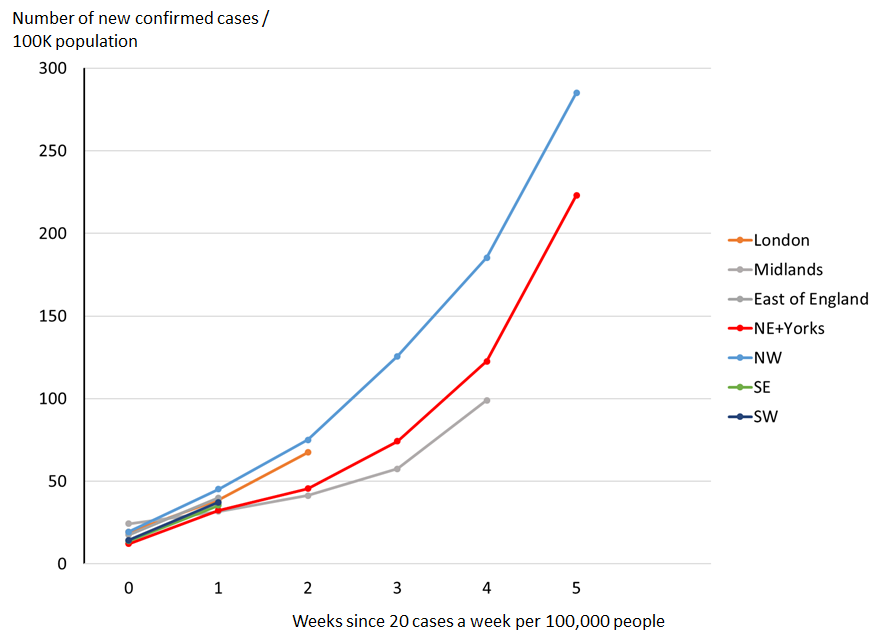
Cases are rising across England. SAGE estimate R i s1.2 -1.5 & not below 1.2 anywhere. Although North highest (1), everywhere rising. Plotting each region with start point at first week with over 20 cases/ 100K people/week shows that trajectories similar (2) - all on same course
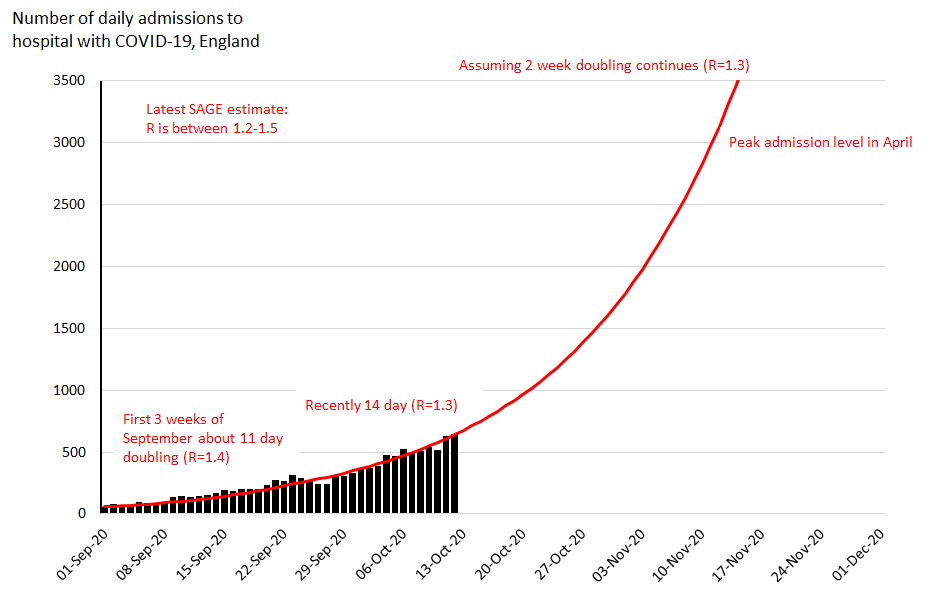
All charts below assume simple exponential growth or decay (based on R) till end Nov. V v simple but illustrate point! I use hospital admissions as not dependent on testing. Back of envelope, don't take numbers literally.

Overall, doubling rate currently about 2 weeks (R=1.3).
Plotting hospital admission since September shows this well. If nothing changes to reduce R to less 1.3 we will get to peak April admission rates (~3000/day) by mid November.
It takes about 2 weeks from infection to hospital admission - almost everyone who will be admitted to hospital over next 2 weeks is *already* infected. The new tiers from Weds will *not* impact admissions for at least 2 weeks. Let's assume (v generous) that they reduce R to 1.1
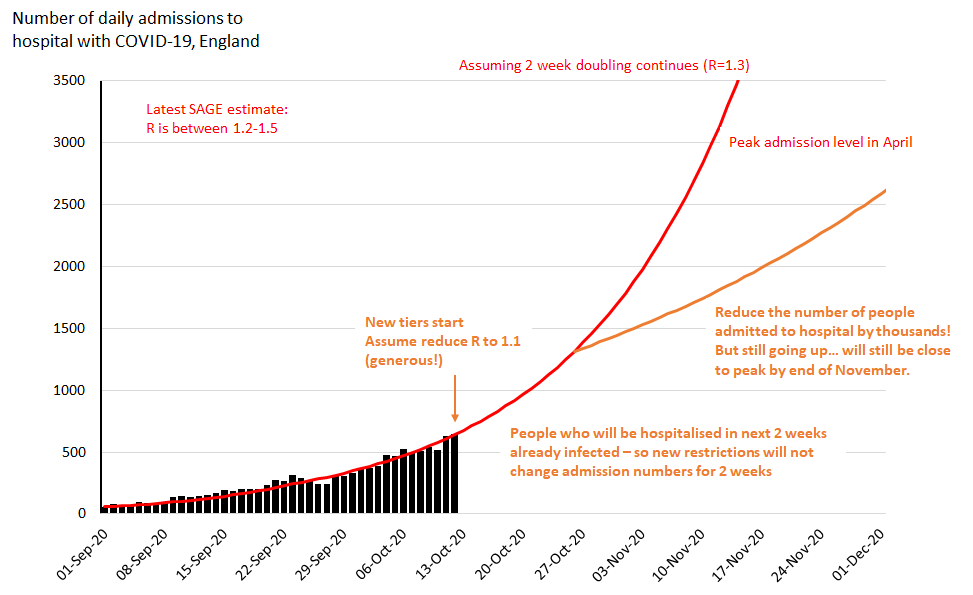
Reducing R to 1.1 will dramatically reduce the number of people admitted to hospital by end November compared to R=1.3 (GOOD). BUT pandemic will still be GROWING and still close to Spring peak (where NHS almost overwhelmed) by end November (BAD)
SAGE estimates closing all hospitality reduces R by 0.1-0.2 & stopping household mixing by 0.1-0.2. NOTE tier 3 does *not* close all hospitality. We could close more things to get R to below 1 (e.g. strict work from home, unis online) AND/OR improve contact tracing.
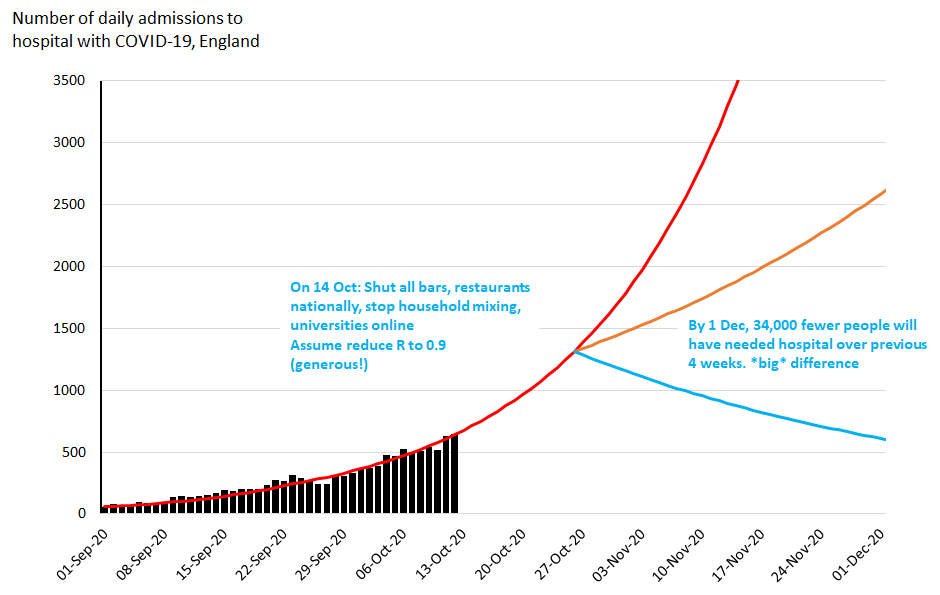
There are different ways of trying to get R just below 1. Tiers 1 and 2 will NOT be enough (because they already aren't!! R higher than1.2 everywhere inc regions that were already at equiv of tier 2). But let's assume we could do that *yesterday* and get R to 0.9 from now on.
After 2 weeks, you'd start to see new hospital admissions start to drop off but slowly. By end Nov we'd be back to where we were a week ago... but compared to the orange line (assumed current scenario) we'd have saved 34K people from needing hospital (and maybe 5K deaths).
What about a short circuit breaker? This would be March lockdown inc closing schools. A circuit breaker *right now* for TWO weeks (to include half term) & then a situation where R =0.9, we'd be back at mid Sept by end Nov. Approx extra 13K people would be spared hospital.
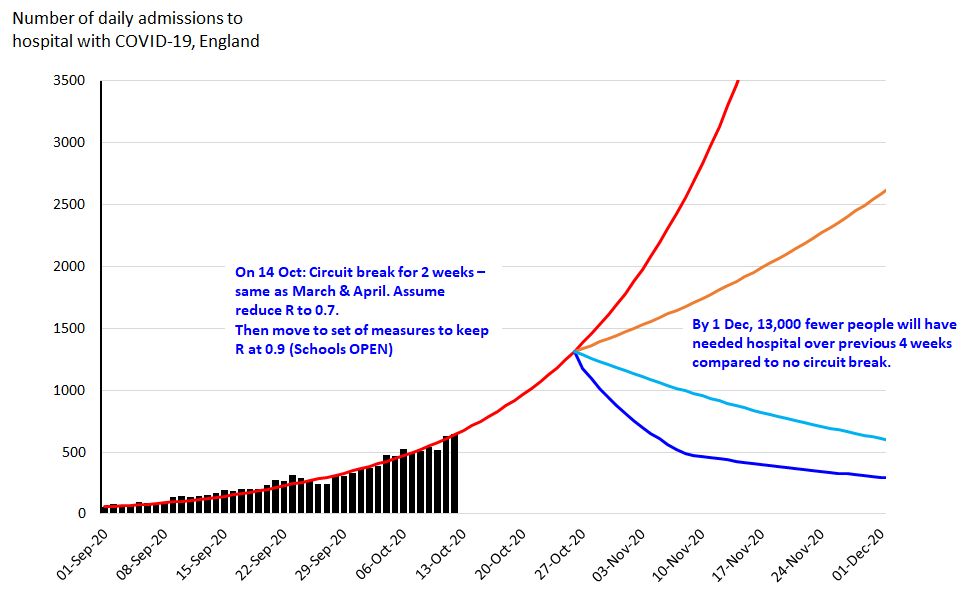
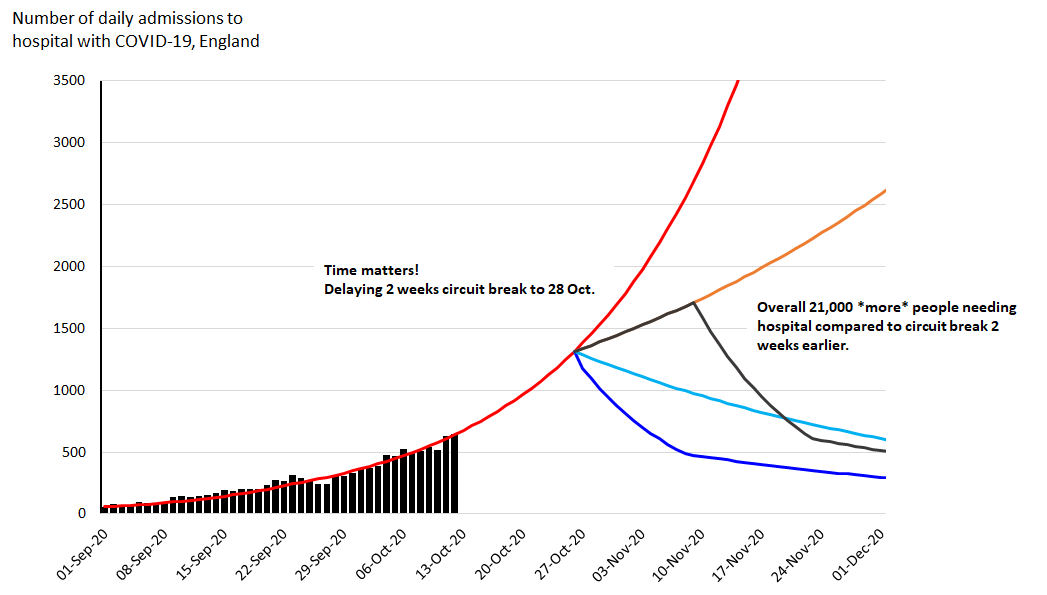
But they didn't do a circuit breaker today. What if they decide to do it in two weeks time? This matters... It will still bring down admissions quickly (after 2 week lag) BUT in meantime an extra approx 21K people will be in hospital compared to starting 2 weeks earlier
SAGE recommended a circuit breaker followed by combo of better contact tracing & increased restrictions (enough to bring R below 1). Yesterday's paper (bbc.co.uk/news/health-54…) highlighted the impact of waiting to act. NOW is always the best time to do a circuit breaker.
From SAGE table of interventions bit.ly/379CN8I and given R higher than 1.2 despite tier interventions being in place for over 4 weeks , the tiers are v unlikely to be enough get R under 1.
We need to REVERSE growth. We can do this slowly with less pain, or quickly with more pain. Quicker saves more lives. Either will hurt more than current restrictions and waiting is *worst of all*. Fixing testing, tracing, isolation & support will give us MORE options again. END

• • •

Missing some Tweet in this thread? You can try to force a refresh
 

Keep Current with Christina Pagel

Christina Pagel Profile picture

Stay in touch and get notified when new unrolls are available from this author!

Read all threads

This Thread may be Removed Anytime!

PDF

Twitter may remove this content at anytime! Save it as PDF for later use!

Try unrolling a thread yourself!

how to unroll video
  1. Follow @ThreadReaderApp to mention us!

  2. From a Twitter thread mention us with a keyword "unroll"
@threadreaderapp unroll

Practice here first or read more on our help page!

More from @chrischirp

8 Oct
THREAD: My thoughts on pubs FWIW.

At current growth, covid hospital admissions in North of England less than a week away from levels London had on lockdown day in March (per population)
Covid loves us socialising indoors (pubs & homes) and laughing, chatting over a table for hours... I think right now closing indoor pub service in hard hit areas & restricting household mixing is right thing to do BUT we need to work immediately on plan to reopen inc
Fixing test & trace (e.g. in England, currently works least well where needed most). This inc supporting isolation - financially (£500/2 wks less than minimum wage!), practically (caring responsibilities, grocery, accommodation...) (govt SAGE said same bit.ly/2SBpfKP
Read 6 tweets
3 Oct
THREAD: many of us in healthcare have seen new IT systems hailed as gamechangers. Many don't live up to their promise. Often failure is at final step of implementation - I interviewed people at 4 hospitals who all implemented the same IT system & developed these cartoons...
The hope is that they capture typical stories of what pitfalls happen in real life - and gives tips for how to avoid them! The full cartoons (and a downloadable booklet) are freely available from @nejmcatalyst catalyst.nejm.org/doi/full/10.10… but here are some with real quotes :-)
"Because it involved IT, even tho the CMO had signed off & we had his blessing & the promised resources & the contract, then we had to go through what we call the IT gov committee. Which is not a quick process, so we had to formally present this…and that took another 6 mnths"
Read 8 tweets
3 Oct
SHORT THREAD: Some interesting (if unsurprising) data in NHS test and trace this week on age profile & positivity rates - particularly for kids & young adults. 1/4
Firstly, MASSIVE increase in school-age kids getting tests in September. Stark to see how much extra capacity was needed - not surprising and should have been anticipated! Also surprising that 20-29 yr olds NOT getting more tests even though age group with most infections. 2/4
BUT, no increase in cases among under 10s and only modest increase in 10-19s. Biggest increase in cases by among 20-29 years olds. This age group should really be getting more tests. 3/4
Read 5 tweets
2 Oct
THREAD: what happened with COVID in September and where are we now? It's been an eventful month and there is good news and bad news... read on to find out which is which!

NB: Longish thread (18 tweets) but hopefully informative with lots of pretty charts...

@IndependentSage
Confirmed cases have continued to rise, but hard to interpret cos of ongoing problems with testing. But let's go with this for now - where are the confirmed cases?
All the nations have seen steep increases over September but Wales and N Ireland doing rising less steeply than England and Scotland... Let's dig a bit further into England
Read 18 tweets
27 Sep
THREAD: as requested by absolutely noone here are some thoughts on COVID-19, the UK and exponential growth... (it's a positive thread though!) 1/11
Infectious diseases by their nature have exponential growth while lots of susceptible people are around (still case in UK) as each person infects others. Left to its own devices, COVID-19 cases would double every 4 days or so. With knock on increases for hospital admissions 2/11
But we've not left COVID-19 to its own devices. We've done lots of things to slow the spread (social distancing, masks, rule of 6 etc). This slows down the *doubling time* (how long it takes for cases to double) - effectively giving us longer to bring down transmission. 3/11
Read 11 tweets
20 Sep
THREAD: The latest @PHE_uk weekly surveillance report makes for sobering reading - here are some key things that have not yet been widely reported - inc care homes & inequality. Please read and share! (whole report: assets.publishing.service.gov.uk/government/upl…) 1/9
Linked tweet shows that increases have been mainly in 20-29 & 30-39 ages but spreading to older groups.
BUT this shows that it's spreading most in most deprived areas - where people are in poorly paid work & housing & can't afford to isolate. 2/9
Meanwhile this graph shows *again* that those seriously ill with COVID (needing ICU) are disproportionately from BME communities. COVID loves inequality. 3/9
Read 10 tweets

Did Thread Reader help you today?

Support us! We are indie developers!


This site is made by just two indie developers on a laptop doing marketing, support and development! Read more about the story.

Become a Premium Member ($3/month or $30/year) and get exclusive features!

Become Premium

Too expensive? Make a small donation by buying us coffee ($5) or help with server cost ($10)

Donate via Paypal Become our Patreon

Thank you for your support!

Follow Us on Twitter!