Controversial opinion: those that say its not possible to shield the vulnerable, also won't be able to prove if there is a difference (or lack of it) between the trajectory of the virus at Madrid and Stockholm. Who do you think has let it rip?
1/ There were many "Eureka" moments while working on our paper, but probably the most important of all happened pretty early. Non-linear models are highly sensitive to:
2/ We decided early on to eliminate as many parameters as possible. Location parameters are simple to fix, they are location parameters. Viral parameters also, you can go and say R0=3.3 and you made a choice. How many parameters are left if you do that?
3/ Right. Zero. The basis of epidemiological modeling is figuring out how the virus and the hosts move. If you fix both, there are no parameters left. What we did was add 2 parameters. How much the vulnerable and healthy can isolate on average. 

4/ That was not the eureka, but it had a very interesting side effect. You would be able to modulate the prior in a way that second-order effects get averaged over very simple variables you can 'guesstimate'... Would Madrid under lockdown isolation higher than Stockholm?
5/ That's correct, higher. If people were free to move without masks, the average isolation was going to be lower than if the only way you can go out is with permission to do so and using a mask. Right?
6/ The devil is always in the details. How much higher, and how much lower each one was. The good thing is that by the time we started we had something else to work with.
7/ Sadly, we are talking about the data from deaths. To this day it is difficult for me to abstract myself away that each tick in the data is a life story ending early. But, at some point, if you want to help you need to abstract that away and think it as data.
8/ When you have that you can try to:
9/ It comes with the background. After we had to do it a few times, we figure out that there was a lot of incentive to just build an algorithm to find it for you. 

10/ That was a huge thing, and it would have been the great "Eureka" until we started fitting places and all hell broke lose... The lava was burning hot with:
11/ The problem was that being a non-linear model, there was a 'ridge' of minimums. So, if you isolate a bit more the vulnerable and a bit less the healthy you can still fit the data. That is 'A Bummer'. And there the 'Eureka' happened. Did you respond to follow the serology?
12/ The early decision to separate the healthy under 60 (<60 for short) and >60 was going to play a fundamental part. And, I will tell you about it, after dinner as takeout has arrived :)
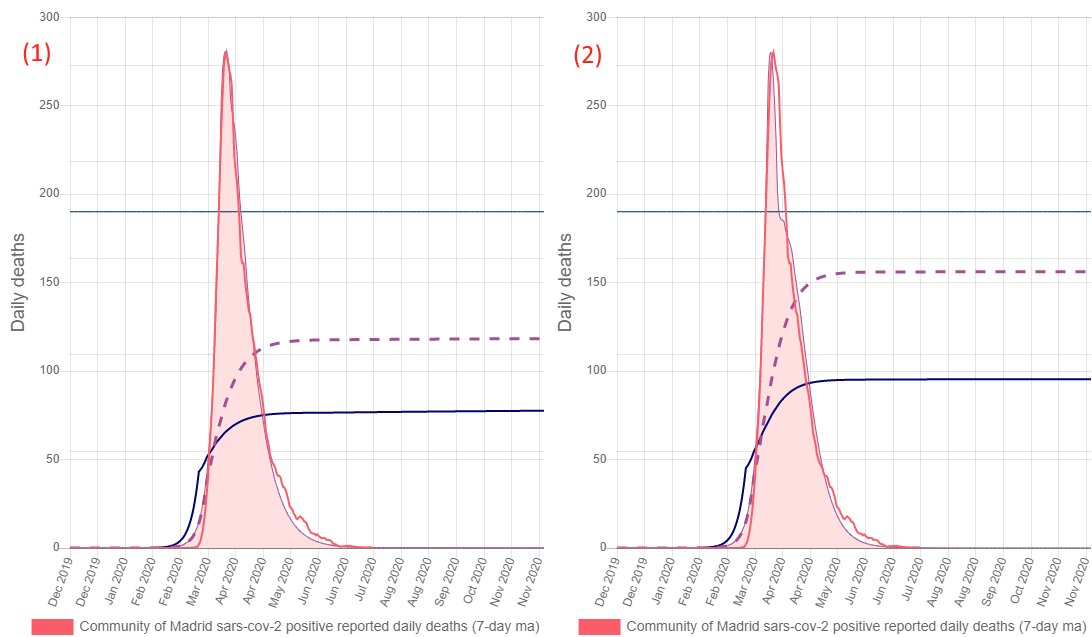
13/ Pizza was pretty good. Now let's go back to roll. Say I present to you the following images. Besides the obvious differences. Is the right (2) trajectory better than the left (1)? 

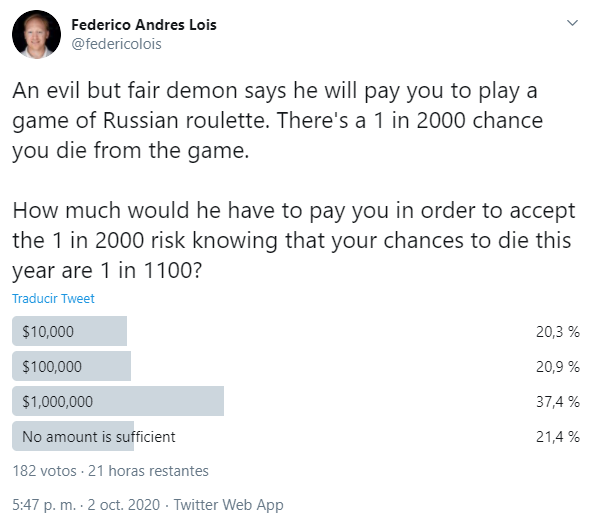
14/ Images and surveys apparently don't play nice with each other.
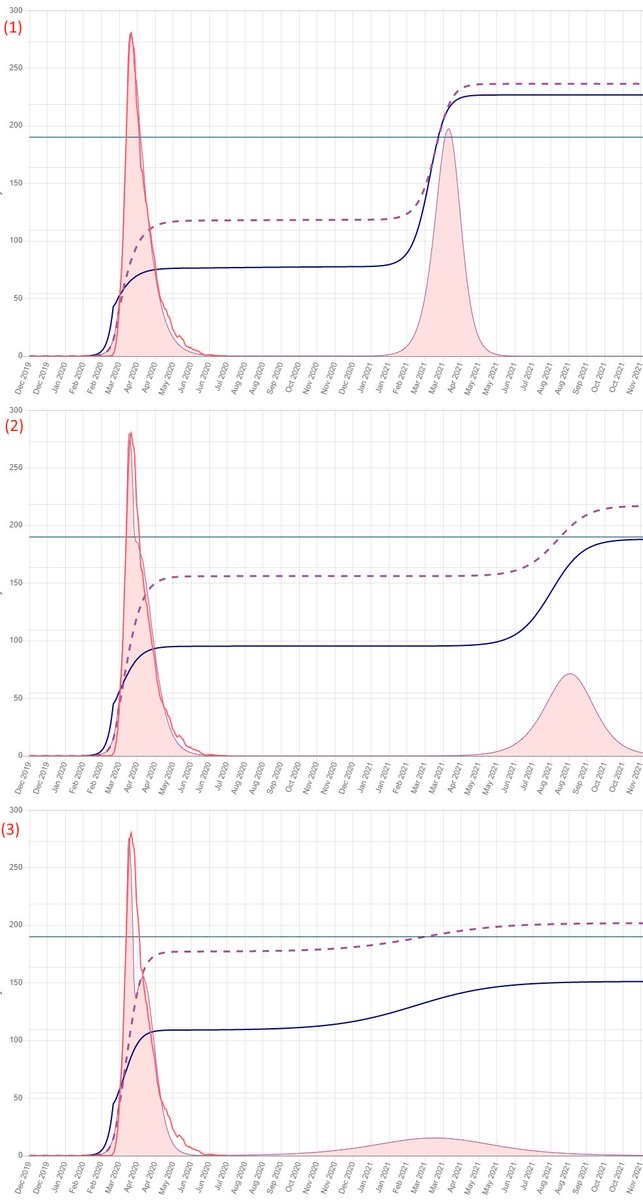
15/ There is some difference, but to make it even more challenging I am going to throw you a curveball here. 

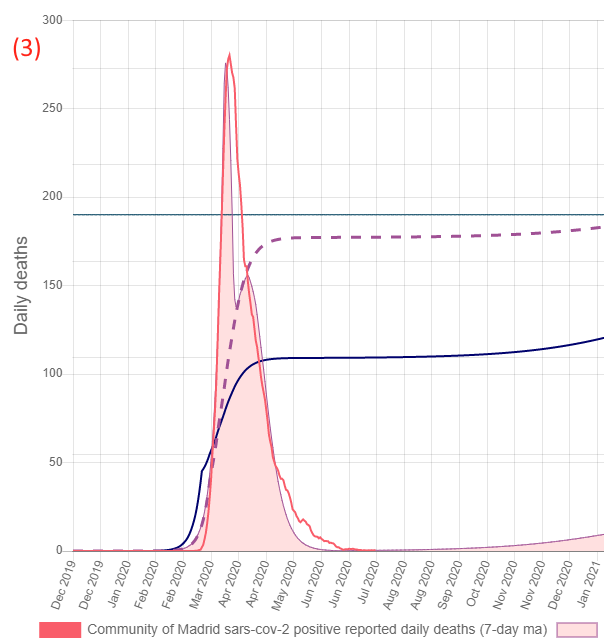
16/ How about this one. Is (3) better than the other two?
17/ This is the reason WHY I have this controversial viewpoint that everybody that says that it is not possible to protect the vulnerable does not know the difference between the trajectory of Madrid and Stockholm. 

18/ Are you convinced now?
19/ Which one do you think is the scenario that played out at Stockholm?
20/ Up to this point you are just guessing. But, if I tell you that scenario 3 has isolation for the vulnerable of 0.95 and isolation for the healthy <60 of 0.24 you are going to say:
21/ While it makes sense (empirically) if I decide to use those values anyone could come and say: "You know you can choose whatever value and make it work" Which is technically true, and why I would argue we are doing everything wrong. But that is for another thread.
22/ But "The Big EUREKA" was the realization that there is one thing that you can use to measure 'immunity' or how far along you are on 'the trajectory'. That would be:
23/ Cases are biased like hell, they don't serve any purpose for measuring immunity. Repeat with me, cases are a flawed metric. Deaths could work, but then again what's the IFR? We don't know either.
24/ Antibodies are the key. But then again, as anyone that has followed the story, serology tests kinda suck (and big-time). Unreliable tests on the field, fading antibodies, blah blah... But you know, there is something BOTH authors are NOT.
25/ Given our background, since we are missing a huge chunk to not say "ALL" the epidemiology knowledge we treat this problem as a 'signal analysis' problem. And what do you do when you have 2 biased signals?
26/ This is optimization 101. If you have 2 signals with a certain shared type of unknown error and you still need to work with them. When you divide them, the relative error (which is the sum of errors) becomes quite small.
27/ Now you can just go and get the serology results from any well designed randomized serosurvey that happens to publish the <60 and >60 (age discriminated), adjust for population pyramid, and then ask the model to predict it.
28/ The funny part (which we didn't know) is that when you do it, that 'ridge' of minimums actually transforms into a black hole. So now, if you go to the serosurvey in Stockholm you find that ratio is 1.70 but in Madrid is 0.78 and voilá...
29/ You now know something almost nobody knows. Madrid 'let it rip' with lockdowns and Stockholm almost achieved 'the word that should not be named' while protecting the elderly. (Madrid image in scenario 3) /END
PS: Last and not least, everything I explained here is detailed in our preprint; come along there are plenty of surprises awaiting. medrxiv.org/content/10.110…
PS2: There is an easy way to distribute the red pill. It's called Retweet :)
• • •
Missing some Tweet in this thread? You can try to
force a refresh


