
$btc $btcusd #BTC
OK, so @cryptoquant_com is doing a closed beta and I'm lucky enough to be able to test it.
Let's make a Big thread right here to connect Onchain Analysis & Technical Analysis
Is $btc in a bull market or what ?
1/x
OK, so @cryptoquant_com is doing a closed beta and I'm lucky enough to be able to test it.
Let's make a Big thread right here to connect Onchain Analysis & Technical Analysis
Is $btc in a bull market or what ?
1/x
$btc $btcusd #BTC
Let's begin with Difficulty, Hashrate & Price, on a log scale.
A 10 year uninterrupted increase.
2/x
Let's begin with Difficulty, Hashrate & Price, on a log scale.
A 10 year uninterrupted increase.
2/x

$btc $btcusd #BTCUSD
Price following closely the Number of Active Adresses
More people in the ecosystem -->
more money comin -->
$btc price increase
3/x
Price following closely the Number of Active Adresses
More people in the ecosystem -->
more money comin -->
$btc price increase
3/x

$btc $btcusd #BTCUSD
$btc Reserve: Number of $btc held on exchanges.
Sharp increase of $btc on exchanges gives us the capitulation
A slow increase of $btc on exchange give us the distribution (slow process)
A DECREASE of $btc on exchange is accumulation.
People are buyin.
4/x
$btc Reserve: Number of $btc held on exchanges.
Sharp increase of $btc on exchanges gives us the capitulation
A slow increase of $btc on exchange give us the distribution (slow process)
A DECREASE of $btc on exchange is accumulation.
People are buyin.
4/x

$btc $btcusd #BTCUSD
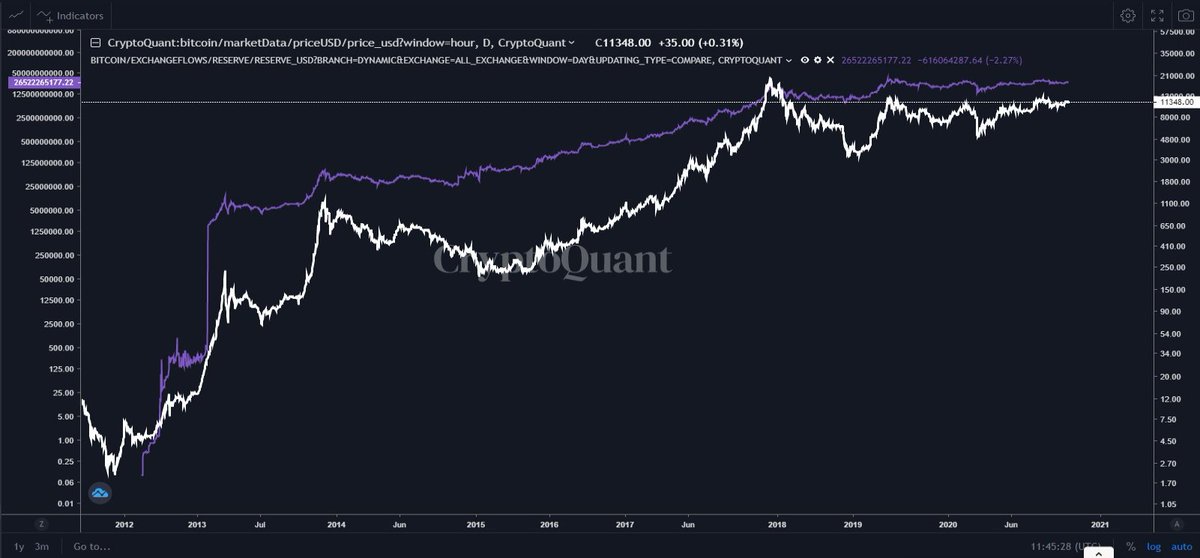
Number of $btc held on exchanges in $$ value
Almost at all time high. No liquidity crisis in sight.
We have $btc increase in price while nbr of $btc held on exchanges is decreasing since March 12th Corona drop
5/x
Number of $btc held on exchanges in $$ value
Almost at all time high. No liquidity crisis in sight.
We have $btc increase in price while nbr of $btc held on exchanges is decreasing since March 12th Corona drop
5/x
$btc $btcusd #BTCUSD
This is probably the most important chart yet imo.
For the past year, we have a sharp increase in Stablecoins
𝙒𝙃𝙄𝙇𝙀 the nbr of $btc held on exchanges is decreasing.
This.
is.
Bullish.
It's called accumulation. People are buying.
6/x
This is probably the most important chart yet imo.
For the past year, we have a sharp increase in Stablecoins
𝙒𝙃𝙄𝙇𝙀 the nbr of $btc held on exchanges is decreasing.
This.
is.
Bullish.
It's called accumulation. People are buying.
6/x

$btc $btcusd #BTCUSD
$btc exchanges inflows mean, giving pretty good signals for capitulations.
At a market bottom, falling prices eventually force out large numbers of traders, resulting in volatility and increased volume.
7/x
$btc exchanges inflows mean, giving pretty good signals for capitulations.
At a market bottom, falling prices eventually force out large numbers of traders, resulting in volatility and increased volume.
7/x

To be continued later on...
$btc $btcusd #BTCUSD
Very interesting stuff.
When using a 360 MA (to smooth the data) on the Netflow, we get a raw
Accumulation / Distribution areas indicator
@cryptoquant_com
8/x
Very interesting stuff.
When using a 360 MA (to smooth the data) on the Netflow, we get a raw
Accumulation / Distribution areas indicator
@cryptoquant_com
8/x

$btc $btcusd #BTCUSD
MA cross 360 EMA & 360 MA on Exchange Inflows gave us the exact 2 first tops in 2013, and the exact 2018 bottom
Good inflections point.
need to tweak this and play with MAs
9/x
MA cross 360 EMA & 360 MA on Exchange Inflows gave us the exact 2 first tops in 2013, and the exact 2018 bottom
Good inflections point.
need to tweak this and play with MAs
9/x

$btc $btcusd #BTCUSD
Positive slope on 360 MA for the Miners Reserve give us the early phase of bull-runs ?
( = miners accumulation ?)
10/x
Positive slope on 360 MA for the Miners Reserve give us the early phase of bull-runs ?
( = miners accumulation ?)
10/x

$btc $btcusd #BTCUSD
100/360 EMA cross on Miners Reserve giving pretty good buy signals.
Soon another buy signal (˵ ͡° ͜ʖ ͡°˵)
11/x
100/360 EMA cross on Miners Reserve giving pretty good buy signals.
Soon another buy signal (˵ ͡° ͜ʖ ͡°˵)
11/x

$btc $btcusd #BTCUSD
Similar to tweet 8.
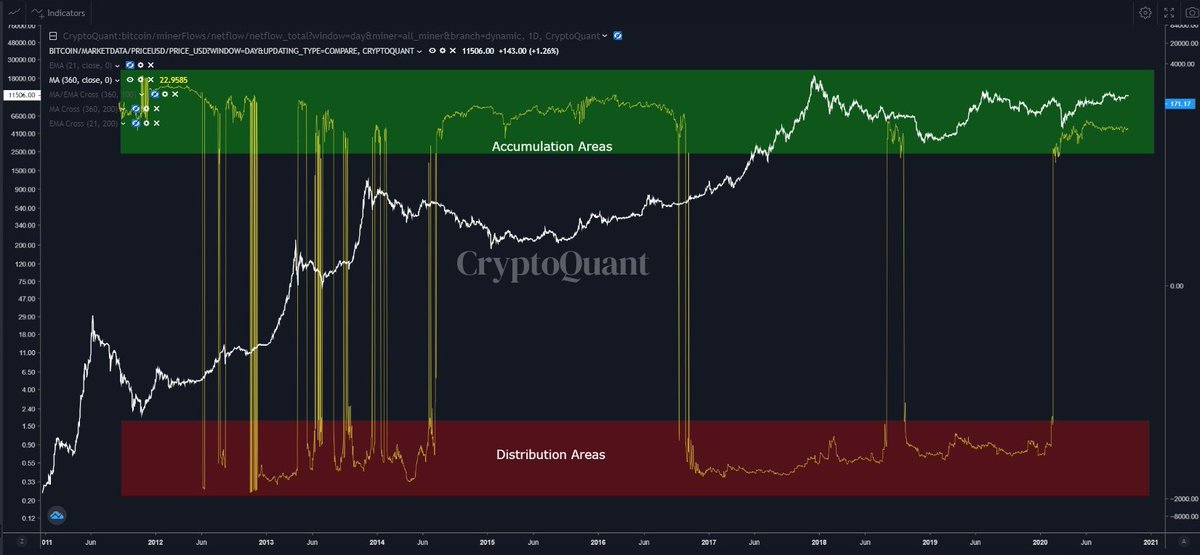
When using a 360 MA (to smooth the data) on the Miners Netflow, we get a raw
Accumulation / Distribution areas indicator
12/x
Similar to tweet 8.
When using a 360 MA (to smooth the data) on the Miners Netflow, we get a raw
Accumulation / Distribution areas indicator
12/x
$btc $btcusd #BTCUSD
21 EMA / 200 MA cross on NVM
Basically, you want to be long when 21 is above 200
And short when 21 is below 200
$btc 21 is above 200 since Oct 12th
13/x
21 EMA / 200 MA cross on NVM
Basically, you want to be long when 21 is above 200
And short when 21 is below 200
$btc 21 is above 200 since Oct 12th
13/x

To be continued later on... :)
$btc $btcusd #BTCUSD
21 EMA of the MPI (An MPI reading above 2 suggests miners are selling their BTC after mining, while a negative value shows they're avoiding selling as much as possible in favor of accumulation)
Except H1 2015, you want to follow what miners are doing
14/x
21 EMA of the MPI (An MPI reading above 2 suggests miners are selling their BTC after mining, while a negative value shows they're avoiding selling as much as possible in favor of accumulation)
Except H1 2015, you want to follow what miners are doing
14/x

$btc $btcusd #BTCUSD
10EMA of Exchange whale ratio (Exchange Whale Ratio is the relative size of the top 10 inflows to total inflows by day of each exchange)
OK this one is a VERY good one too. Follow the whales.
multi tweets explanation:
15-1/x
10EMA of Exchange whale ratio (Exchange Whale Ratio is the relative size of the top 10 inflows to total inflows by day of each exchange)
OK this one is a VERY good one too. Follow the whales.
multi tweets explanation:
15-1/x

$btc $btcusd #BTC
-When 10EMA> 0.48 (Green vertical lines), it's a BUY signal, meaning whale inflows compared to total inflows are small (whales dont want to sell)
15-2/x
-When 10EMA> 0.48 (Green vertical lines), it's a BUY signal, meaning whale inflows compared to total inflows are small (whales dont want to sell)
15-2/x

$btc $btcusd #BTC
-When 10EMA<0.38 (Red vertical lines), it's a SELL signal, meaning whale inflows compared to total inflows are important(whales want to sell)
At 13k currently, it would suggest that the rally is close to the top
15-3/x
-When 10EMA<0.38 (Red vertical lines), it's a SELL signal, meaning whale inflows compared to total inflows are important(whales want to sell)
At 13k currently, it would suggest that the rally is close to the top
15-3/x

$btc $btcusd #BTC
The signal seems to be better if the slope of 10 EMA is very aggressive into the zone
15-4/x
The signal seems to be better if the slope of 10 EMA is very aggressive into the zone
15-4/x
What this also suggest, is that whales got tricked into buying the 6k floor in 2018
Hahaha, suckers
Hahaha, suckers
Overall, I like a lot @cryptoquant_com Onchain analysis tools and when their beta is finished, i'll subscribe to cq.live .
Here is my referral, if you're interested in testing it too.
cryptoquant.com/sign-up?my-fri…
Here is my referral, if you're interested in testing it too.
cryptoquant.com/sign-up?my-fri…
Plus I have already set 3 alarms on the $BTC flow I was watching manually
Pour mes lecteurs français, voici la traduction du thread Twitter, posté en article sur bitcoin.fr, merci à @bitcoinpointfr !
$btc $btcusd #btc
bitcoin.fr/analyse-de-la-…
$btc $btcusd #btc
bitcoin.fr/analyse-de-la-…
$btc $btcusd #btc
21 daily EMA on Stablecoins Inflow
Could be used as an indicator (similar to OBV)
simple TA:
A break of trendline = increase in stablecoins inflow compared to latest period = BUY signal
17/x
21 daily EMA on Stablecoins Inflow
Could be used as an indicator (similar to OBV)
simple TA:
A break of trendline = increase in stablecoins inflow compared to latest period = BUY signal
17/x


saw Blackbeard post , so i checked by myself
someone is buying every $btc possible or what ?
that's the largest downspike visible
someone is buying every $btc possible or what ?
that's the largest downspike visible
https://twitter.com/crypto_blkbeard/status/1324014913510121474?s=20
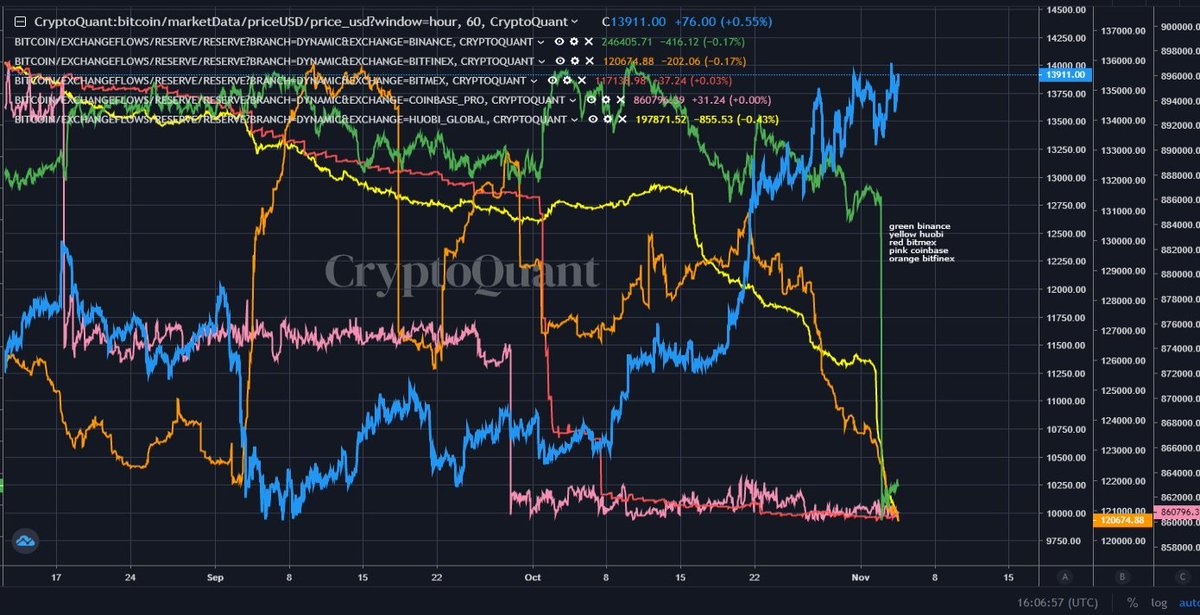
lol, a zoom in into exchanges reserve
Reserves were depleted from Binance / Huobi mainly, & Bitfinex
$btc $btcusd #btc
Reserves were depleted from Binance / Huobi mainly, & Bitfinex
$btc $btcusd #btc
• • •
Missing some Tweet in this thread? You can try to
force a refresh


