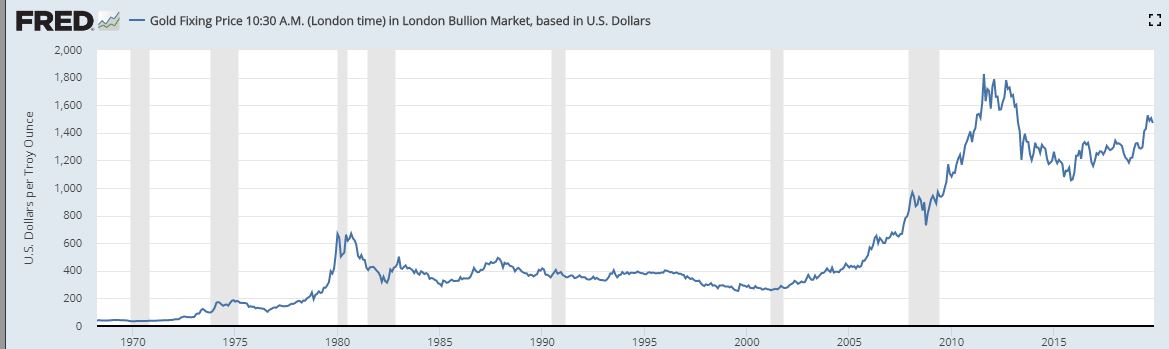
Gold is now in the third month of consolidating; I view this chart pattern as a bullish consolidation as Managed Money speculative positions are now down 65% from previous highs. One fundamental positive last week, was India returning to a premium to world markets. Indian...
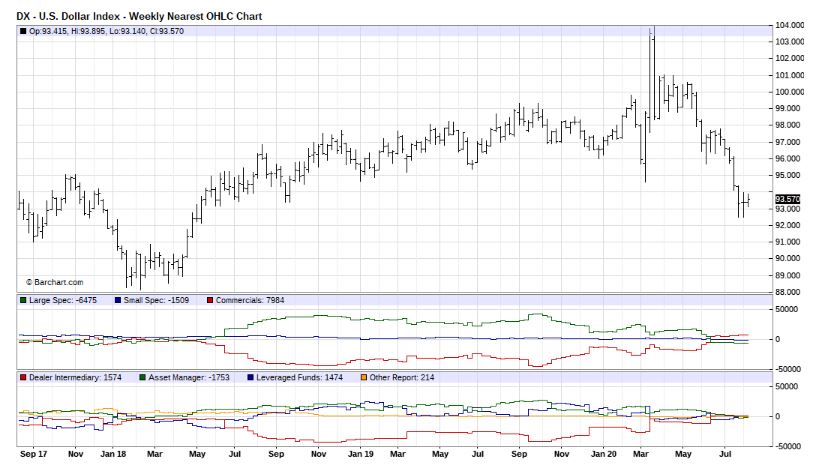
& Chinese consumer demand were major support for Gold during the bear market. Both consumers backed off once Gold broke out last summer, we expect pent up demand out of these 2 huge buyers of physical Gold. So far, Chinese consumers do not appear to be on the bid. The dollar...
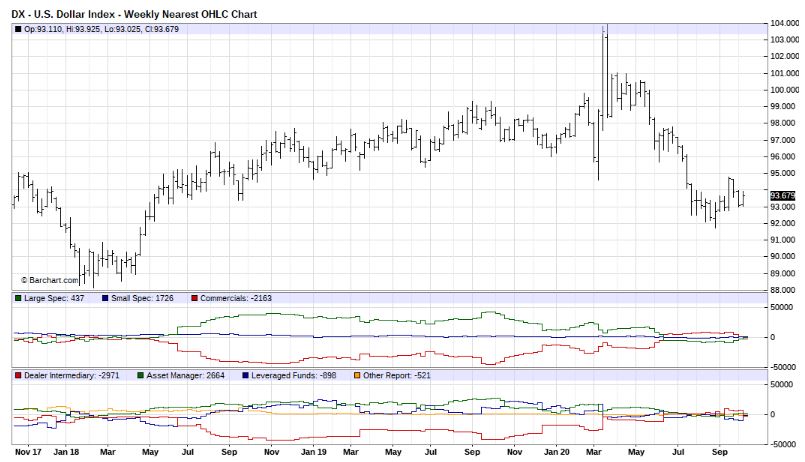
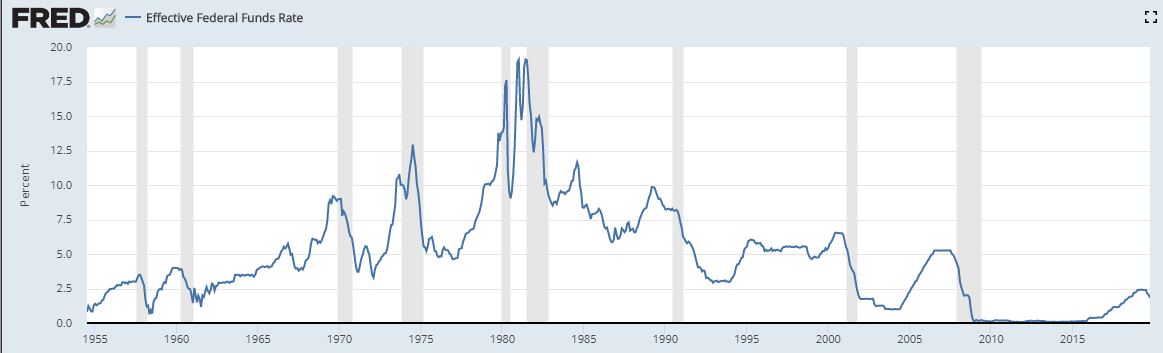
appears to be in a bearish consolidation pattern. So I do not view this as a negative for Gold. Treasury market continues to look like it is no longer a market, but is now fixed in a trading range. News that the Fed purchased larger amounts of Treasuries than usual last week as..
prices fell and yields rose, support this theory. Specifically, we continue to believe the Fed has implemented a defacto interest rate cap; they have just not announced it to the public. Regardless, a .7% 10 year note, with core CPI up 1.7%, gives you a negative 1% real yield...
Central bank demand for Gold is only reported with a lag. Our belief is major support for Gold is Eurasian Central Banks, technical analysis would suggest that bid is very large and between $1850 & $1900. With the supply of $s all but guaranteed to continue to rise at whatever..
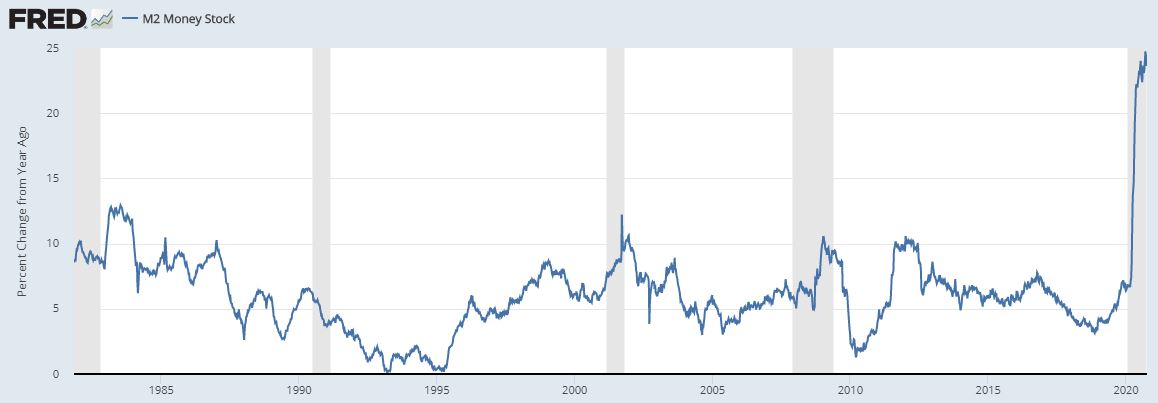
rate is necessary to support financial assets & Treasury's finances, we continue to believe "this time is different". Deflation is a myth, holders of U.S. financial assets are being diluted, debased, you own less than you think. Please do not reply with but there is no velocity,.
just unfollow me, you will not change my professional opinion. I have been doing macro for 35 years. Velocity will occur when holders of $100T plus of U.S. financial assets collectively realize they are being diluted on a daily basis, money will begin to shift out of these...
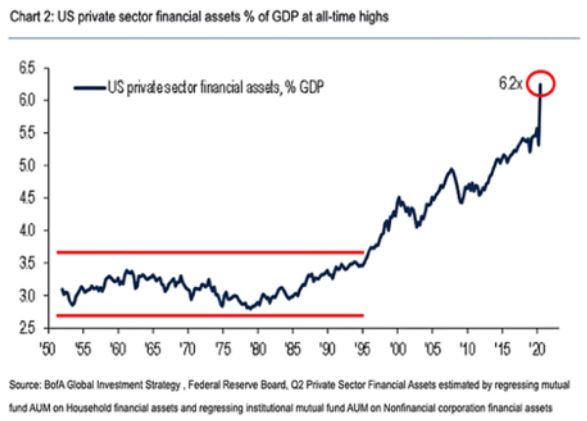
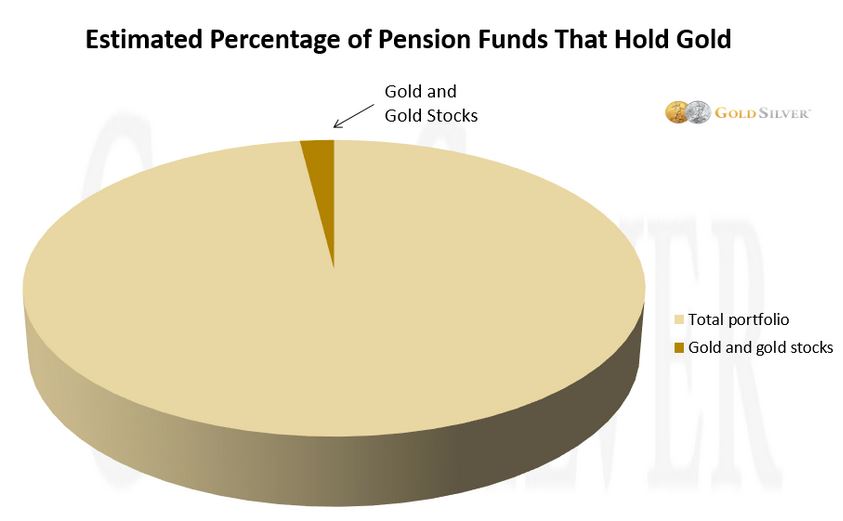
assets. The Feds continued support of these assets means money supply will continue to grow at whatever rate is necessary. As the 60-40 does not perform as expected, U.S. investor demand for Gold will continue to grow. Currently, U.S. investors are incredibly under weight Gold..
Well run producing Gold Miners are doing very well at current Gold prices. @ $1900 Gold, this sector is now filled with growth stocks. Precious Metals Equities were the best performing sector for a reason in the 1930's, 1970's, & 2000's. In weak economic times, the demand for.. Homestake Mining 1920-1980
Gold rises. We are expecting very strong earnings from our portfolios. We do not need higher Gold prices; as long term investors, we are very happy with 90-110% operating margins & forecasted production growth of 20% from internal cash flow. The mining ETFs have no clue..
what I am talking about. They simply buy the highest valued miners & avoid the cheap ones. Our analysis is the largest mining ETF #GDX is trading at 21x consensus 2021 EPS. Our portfolios closed last night @ 9x consensus 2021 EPS. I slept fine last night as I expect over time..
& @ current Gold prices our miners will eventually move to a premium over the no growth seniors, which all of the mining ETFs are loaded with. This is not investment advice; if you are an accredited investor & would like more information, please visit our website.

• • •

Missing some Tweet in this thread? You can try to force a refresh
 

Keep Current with Garic Moran

Garic Moran Profile picture

Stay in touch and get notified when new unrolls are available from this author!

Read all threads

This Thread may be Removed Anytime!

PDF

Twitter may remove this content at anytime! Save it as PDF for later use!

Try unrolling a thread yourself!

how to unroll video
  1. Follow @ThreadReaderApp to mention us!

  2. From a Twitter thread mention us with a keyword "unroll"
@threadreaderapp unroll

Practice here first or read more on our help page!

More from @GaricMoran

10 Sep
Below is a 90 year chart of the S&P 500 divided by Gold ratio. The Series 65 (Registered Investment Advisor Exam) has almost no mention of Gold's proven diversification qualities for portfolios, even though Gold outperformed stocks during the decades of 1930s (deflation), 1970s..
..(inflation), & 2000s (2 financial crises). Most RIAs are sticking with the traditional 60-40 portfolio, hoping bonds will diversify equity risk, despite the fact that yields are at the lowest level in the history of the Republic. The exam asks if you expect inflation to occur..
..what should you recommend? The correct answer is stocks. The 60-40 portfolio lost 70% purchasing power in the 1970s. If you had expected inflation, that would have been horrible investment advice. A closer look at the ratio, shows Gold has begun major moves vs. stocks in the..
Read 6 tweets
12 Aug
Yesterday, Gold experienced its worse day in 7 years. Wall Street & Financial Media would like you to believe this occurred do to an improving economy. The 10 Year Note rose from last weeks lows of .5% to .65%. The $ rallied all of 1%; make no mistake about it, this was an...
...organized intervention in the Gold market. Would any rational investor decide to sell their Gold for the next 10 years and own a Treasury at .65% vs. .5%, with the Federal Reserve increasing money supply at a 20% + annual rate? Treasury wants you to buy Bonds, Wall Street..
..wants you to buy their bankrupt derivatives paper, so they can get their bonus. The Fed wants to believe they are the wizard of Oz (nothing to see behind that curtain). Unfortunately, the vast majority of U.S. investors are momentum investors. They will look at yesterdays...
Read 5 tweets
8 Feb
The 2 most important real time indicators Nonfarm Payrolls & ISM Manufact., both pointed to a successful soft landing. Anyone who actually read the reports should have immediately dismissed them. Both had clear caveats in the opening paragraphs about new seasonal adjustments...
..So where does the U.S. economy actually stand. Leading indicators are at the same level as '01 & '08 hard landings as well as '11 & '16 soft landings. The last 3 yield curve inversions all led to recessions in the next 6-12 months; this continues to warn...
...If the yield curve inversion works as a leading indicator, it would be through the interaction of bank lending. Currently bank credit is overwhelmingly going into mortgages & Treasury's. Commercial & Industrial lending peaked early last summer before the yield curve inverted..
Read 10 tweets
14 Dec 19
I just finished reading Doug Noland’s summary of the Federal Reserve’s Q3 2019 Z1: creditbubblebulletin.blogspot.com . Here are my thoughts: total credit outstanding grew another $3.2T over the past year to $74.6T (348% of GDP); this is 4X the rate of GDP. Even J. Powell says this is not..
..sustainable; Austrian economists call it a credit bubble, but this bubble is still expanding. Since foreigners stopped acquiring U.S. debt, U.S. financial markets and banking system need to finance this expansion or it reverses & pops. Banks, brokers, money markets, & hedge..
..funds securities holdings surged over the past year. Ominously repo liabilities grew $932B over the past year, which means borrowing money to finance this credit expansion has accelerated as it did in 2007. In Q3 banks repo assets actually declined $23B as they are now..
Read 9 tweets
23 Nov 19
Polar opposites: My first job in the investment field was as an intern at a local brokerage firm in New Orleans in the summer of 1981. At that time the Federal Reserve was a couple of years into targeting money supply. President Carter had nominated Paul Volcker Jr. as...
..Fed Chairman in August of 1979. The $'s status as the reserve currency of the world was in serious doubt. U.S. investors convinced that inflation would never come down were dumping Treasury's at any price & panicking into Gold, which peaked in January of 1980 @ $875...
...18 months later in the summer of 1981, all traders were transfixed Thursday afternoons with the release of the money supply report. Interest rates & Gold would move the following morning, rates were floating; the Fed was targeting money supply! The Fed had already allowed.
Read 19 tweets
9 Nov 19
As a person dumb enough to trade precious metals futures professionally for the past 20 years, here is my 2 cents worth about the current correction in AU & AG. Anyone who thinks commercials have total control over pricing is wrong. If that were true AU & AG would be at $0....
...bankers, both primary & central always short rallies, yet the price of AU went from $300 to $1900, between 2001 & 2011. There are 3 huge events which have occurred recently. 1) Commercial short interest is at a record and increasing as we fall through moving averages...
..& conversely speculative long position has risen as AU breached its moving averages; this is not how trend following CTA's operate & thus essily manipulated by nefarious bullion banks. With 2 of the largest US macro funds openly bullish for AU, it is possible they are adding..
Read 12 tweets

Did Thread Reader help you today?

Support us! We are indie developers!


This site is made by just two indie developers on a laptop doing marketing, support and development! Read more about the story.

Become a Premium Member ($3/month or $30/year) and get exclusive features!

Become Premium

Too expensive? Make a small donation by buying us coffee ($5) or help with server cost ($10)

Donate via Paypal Become our Patreon

Thank you for your support!

Follow Us on Twitter!