volatility tips: 😉

why "volatility always came in clusters"? people ask

50% fundies & 50% technicals:

1 fundies/shocking-news triggering the first wave spike
2 people not prepared for the shock, scramble to buy protections
3 sell risky assets
4 rotate to safe-havens

#1 of 3
5 trigger dealer & MMs Gamma flip level, exacerbating the VIX spike 2nd wave

6 which in term trigger the over-leveraged weak-hand longs, hitting stop loss levels & margin calls- 3d wave

7 risk-parity funds portf rebalance due to sudden plunge in risky assets. trimming

#2 of 3
8 60+% of commodity/futures leveraged funds, employing momentum/trend based strategies w/ trend detection & stop-loss levels for flipping to short, got flipped, huge force to the dn side: 5th wave

9 massive momentum factor-based passive smart ETFs algo rebalance & risk-off: 6th
10 dumb money & speculators positioned the wrong way before the plunge; suddenly caught in the opposite direction, unwinding the Short $VX & long index futures positions

11 momentum chasing algos & tons of short-term specs chasing the momentum to the dn side

12 OS begets OS
13 although different players have different levels, most of these levels are very close to each other

14 a simple ML/DL algos using the historical order-flows, MP & TA chart S/R analysis would be able to find the clustering of these important triggering levels

15 rug-pull++🦃
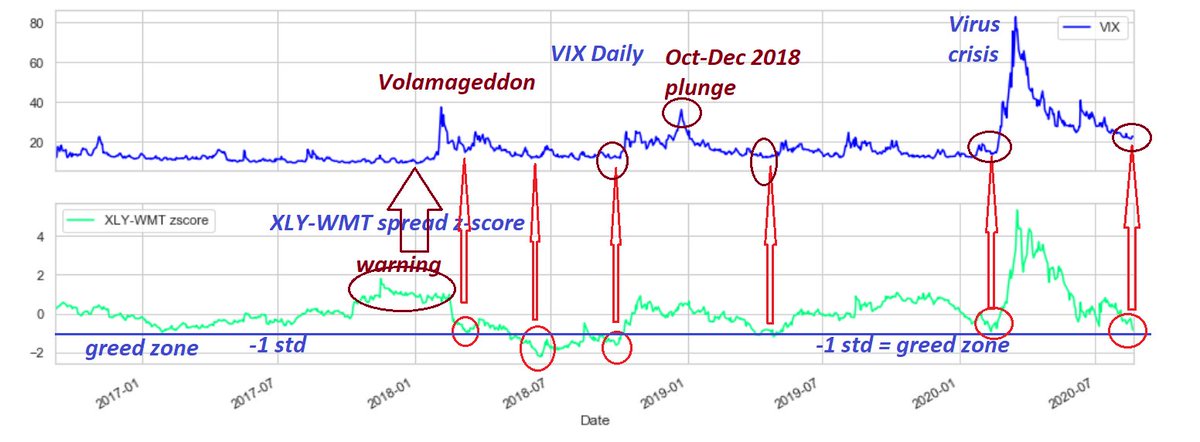
volatility clusters in real world trading since 1990

10 year volatility cluster cycle still valid

a period of LOW volatility cluster followed by a period of HIGH volatility cluster in all time frames, from intraday, short-term, long-term to 10-y cycle

• • •

Missing some Tweet in this thread? You can try to force a refresh
 

Keep Current with Kerberos007

Kerberos007 Profile picture

Stay in touch and get notified when new unrolls are available from this author!

Read all threads

This Thread may be Removed Anytime!

PDF

Twitter may remove this content at anytime! Save it as PDF for later use!

Try unrolling a thread yourself!

how to unroll video
  1. Follow @ThreadReaderApp to mention us!

  2. From a Twitter thread mention us with a keyword "unroll"
@threadreaderapp unroll

Practice here first or read more on our help page!

More from @kerberos007

8 Oct
Trump sent call buying signal to his paid service subscribers 10 minutes in advance. 🧐

$REGN OTM calls to da Moon tomorrow.

Blatant stock market manipulation "legally"?

where is $SEC ? 🙃
Read above post

Where is SEC?
conspiracy?

Trump is

1 "car" salesman (OTM calls) for stonks
2 insider trading paid service Ponzi sponsor
3 selling insider information for profit
4 blatant stock market manipulation

proof? conspiracy?

$SEC investigate?

call vol & call OI 👇
Options stats as of Oct 7th Close

screen: heavy call volume

Stocks with heavy call volume = > 5x 60-day average.

ratio = today volume / 60-day average volume >= 5

marked pink ==> ranked by highest ratio..
Read 6 tweets
3 Sep
People asking about BTFD indicators:

I have tons of these..

BTFD #1 - Capitulation zone
BTFD indicator #2

Maximum pessimism and Capitulation zone

Read 5 tweets
25 Aug
my favorite strategy

$XLY & $WMT spread z-score

entry
z < -1 std => long 1/3 of total lots
long WMT & short h * XLV

z < -2 std => long 2/3 of total lots

profit
z > 0 std => out 1/3 lots
z > +1 std => out 1/3 lots
z > +2 std trailing 1/3 lots

stop
z < -3 std. out.
XLY-WMT spread vs $VIX

when XLY-WMT z-score < -1 std (greed zone), #VIX spiking secured in 1-2 wks time-frame

should be confirmed by many of my other breadth & Jaws indicators

also huge warning, when VIX crushed, but the spread rising. stealthy sector rotation in Jan 2018
The 4+ year correlation b/w
1 XLY-WMT spread z-score
2 $VIX
3 > 0.7

tradeable corr & z-score

how about I scan tons of other similar growth/value sectors & stocks, charting their spread z-score & corr with VIX & Sector ETF? along with PCR

Hmm greatest breadth indicator ever?🧐
Read 19 tweets
23 Aug
a derivative of this arbitrage strategy is to time your favorite stock

1 if I prefer over based on fundamentals & other economic factors

2 wait for > than ; spread > 2 std

3 then, long ,; short

4 with money mgmt of -10% stop loss and position sizing
Hedging or pair trading with SPY, QQQ & SPY-500 sector ETFs

criteria

1 correlation>0.8
2 co-integration pvalue<0.05
3 ADF stationary pvalue<0.05

long your favorite stocks & short the index & sector ETFs

or

short , & long your favorite index & sector ETFs

1 of 3 Image
Hedging or pair trading with SPY, QQQ & SPY-500 sector ETFs

criteria

1 correlation>0.8
2 co-integration pvalue<0.05
3 ADF stationary pvalue<0.05

long your favorite stocks & short the index & sector ETFs

or

short , & long your favorite index & sector ETFs

2 of 3 Image
Read 5 tweets
23 Aug
Pair trading thread from the top

below is the pair trading selection from QQQ-103 stocks

criteria
1 correlation >0.85
2 pair Engle-Granger co-integration test: p_value<0.05
3 ADFuller pair-spread stationary test: p_value<0.05
4 pair spread: paper by Engle-Granger (1987)

1 of 3 Image
below is the pair trading selection from QQQ-103 stocks

criteria
1 correlation >0.85
2 pair Engle-Granger co-integration test: p_value<0.05
3 ADFuller pair-spread stationary test: p_value<0.05
4 pair spread: paper by Engle-Granger (1987)

2 of 3 Image
below is the pair trading selection from QQQ-103 stocks

criteria
1 correlation >0.85
2 pair Engle-Granger co-integration test: p_value<0.05
3 ADFuller pair-spread stationary test: p_value<0.05
4 pair spread: paper by Engle-Granger (1987)

3 of 3 Image
Read 4 tweets
10 Aug
More updates on below 103 stocks total short interest after the close.

for July 15 reporting.

A great contrarian indicator for stocks.
TSLA short interest as of July 15

total capitulation from the TSLA shorts:

from 6.5 short ratio last year to 1 (short ratio) days to cover

from almost 40 million shares short last year this time to 12 million shares short. 🧐 Image
Total SI of 103 stocks as of July 15 reporting

Total SI continued its decline as catapults to all time high

Lowest short interest in more than a year.

notice:

1 total capitulation in Jan 15 & 31
2 what happened in Feb/Mar?
3 then Mar 31 and recent capitulation Image
Read 12 tweets

Did Thread Reader help you today?

Support us! We are indie developers!


This site is made by just two indie developers on a laptop doing marketing, support and development! Read more about the story.

Become a Premium Member ($3/month or $30/year) and get exclusive features!

Become Premium

Too expensive? Make a small donation by buying us coffee ($5) or help with server cost ($10)

Donate via Paypal Become our Patreon

Thank you for your support!

Follow Us on Twitter!