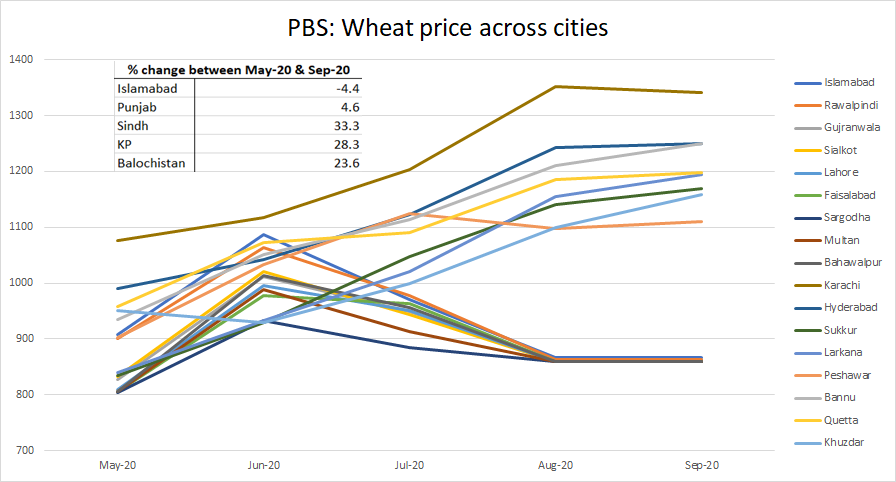
(1/n) The previous thread discussed supply side factors & focused only on food infl. But wat about the demand side? There is a lot happening here as well. After remaining stable around 10% for about 2 yrs, growth rate of money supply increased from 11% in Dec-19 to 16% in Oct-20.
(2/n) To wat extent such a sharp increase in money supply will affect inflation is not immediately obvious. This will partly depend on wat ppl decide to do with it & how the SBP will respond to it. But before this, lets look at why money supply has increased so much since Dec-19.
(3/n) While money growth started increasing from Dec-19, most of the increase was during the post-COVID period. Money growth increased from 11% to 13% during pre-COVID months and from 13% to 16% during post-COVID months (black line).
(4/n) Almost all of the increase in growth in money supply during pre-COVID months was driven by the increase in growth rate of bank deposits. The deposit growth increased from 9% in Dec-19 to 12% at the end of March (yellow line).
(5/n) The only interesting thing here is that the economy had started to recover from around Dec-19. Businesses were expecting interest rates to start coming down in near future. In fact, interest rate on 1 year maturity bond was lower than that on 3 or 6 months bond.
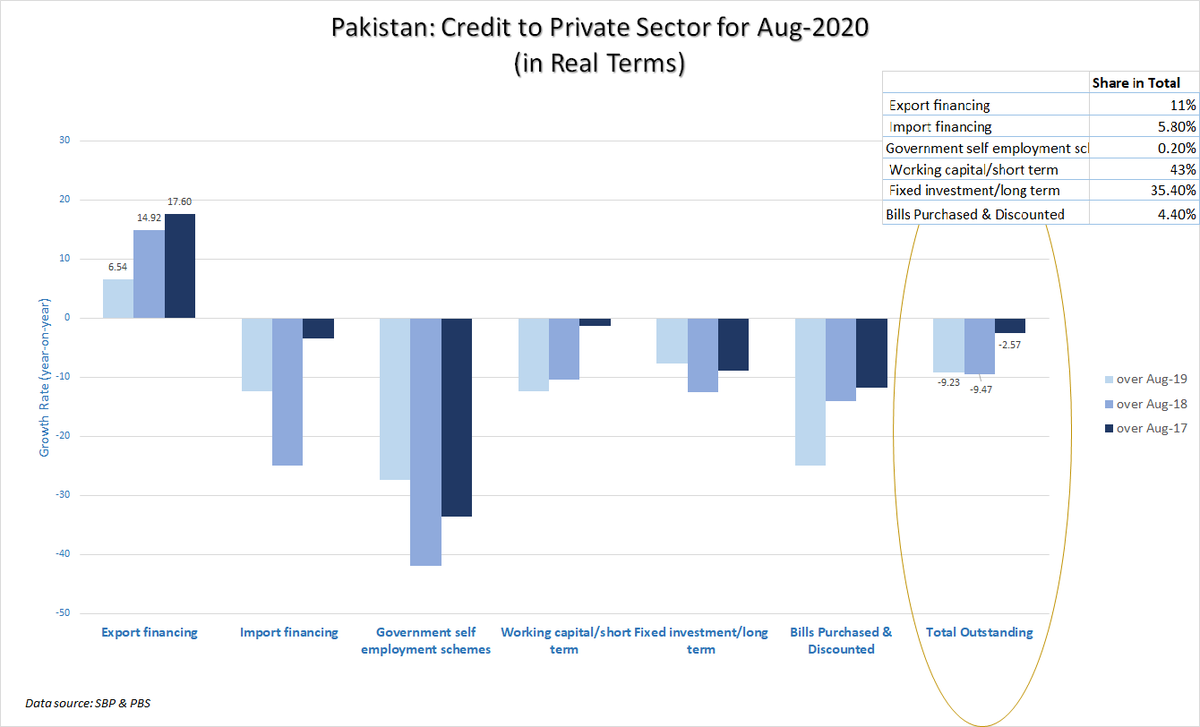
(6/n) As a result of this improvement in near-term borrowing conditions, the declining trend in private sector credit growth reversed in Jan-20. Increase in credit growth also meant that deposit growth increased as well. But then COVID hit!
(7/n) While only growth in bank deposits increased during pre-COVID period, growth in both bank deposits & currency in circulation (CiC) increased during post-COVID period. First, growth rate of CiC increased from 15% in March-20 to the peak of 13.6% at the end of May (blue line)
(8/n) There could be several reasons for this. For example, most cash payments under Ehsaas emergency cash program were made during the months of April, May & June. Another reason could be people withdrawing money from banks to survive the lockdown. And possibly more ...
(9/n) Second, growth in bank deposits also increased from 12.2% at the end of March-20 to the peak of 16% in May-20. This sharp increase in growth rate is most likely due to liquidity injections by the SBP during this period.
(10/n) Postponement in debt repayments, new loans to address COVID related liquidity crisis, and government borrowing most likely contributed towards this increase in growth in bank deposits.
(11/n) Today, while the growth rate of Money Supply is lower than in the middle of COVID crisis, it is still higher (at 16%) than before. What will happen to this excess money in the system (both cash and bank deposits) is key to how inflation will behave in months to come.
(12/n) If ppl decide to spend it as frequently as they would in normal times (i.e. velocity of money normalises), then infl outlook will worsen. But if ppl hold on to it in fear that COVID/lockdown may return or use it for debt repayments, infl may not be an immediate concern.
(13/n) In any case, SBP shud watch out for how this excess liquidity will play out once normality returns. Experience of adv. economies is so far comforting in tht inflationary pressures hav not appeared despite increase in MS. But these countries r structurally quite different!
(n/n) Hopefully these two threads would have given us a better understanding of how different factors - both on the supply and demand side - may have affected the economy in recent months and what this means for both current and future inflation.
P.S. Thanks to @samigodil for providing the chart in (5/n). Also, growth rates in all figures are in terms of year-on-year.

• • •

Missing some Tweet in this thread? You can try to force a refresh
 

Keep Current with Ahmed Jamal Pirzada

Ahmed Jamal Pirzada Profile picture

Stay in touch and get notified when new unrolls are available from this author!

Read all threads

This Thread may be Removed Anytime!

PDF

Twitter may remove this content at anytime! Save it as PDF for later use!

Try unrolling a thread yourself!

how to unroll video
  1. Follow @ThreadReaderApp to mention us!

  2. From a Twitter thread mention us with a keyword "unroll"
@threadreaderapp unroll

Practice here first or read more on our help page!

More from @ajpirzada

16 Oct
(1/n) While there is a general upward trend in food prices in #Pakistan, there is also a lot of heterogeneity is how prices of key food items have changed across cities. This points to a mix of local, national and global factors underlying the upsurge in food prices recently.
(2/n) For example, average wheat flour price has increased by almost 5% in Punjab since May but the increase is much higher in Sindh, KP & Balochistan.
(3/n) In contrast, average onion prices have increased most in Punjab, Islamabad & Sindh but fallen significantly in Balochistan (due to imports from Iran?). Prices in KP have also increased but by less than half of the increase in Punjab, Isb & Sindh.
Read 14 tweets
15 Oct
(1/n) There is often a lot of emphasis on social security in political discourse around 'riasat-e-madina' in #Pakistan. But in the few books I hav ever picked up, the bigger story is always about development of trade networks & of financial instruments required for achieving this
(2/n) To an extent that George Saliba's whole thesis on the downfall of Islamic civilisation is centred around the diversion of east-west trade away from the traditional trade networks passing through Islamic lands.
(3/n) Arguing further tht it was the wealth creation frm trade which allowed Muslim elites to finance the scientific enterprise. And once traditional trade routes lost their appeal to newfound shipping routes, both wealth creation and, consequently, scientific enterprise declined
Read 5 tweets
4 Oct
(1/n) To ans questions raised in comments to my earlier post, let me explain y I hav a serious issue with this graph. Note that the graph DEFINES that anyone earning more than $300 per month belongs to middle class. This is exactly wat is wrong with it. Y?
(2/n) In short, bec purchasing power of $ has continued to change over time. Let's start frm 2014. Recall that while exchange rate remained almost fixed between 2014-18, domestic prices kept increasing by more than increase in world prices. Result: real exchange rate appreciated.
(3/n) Now the graph. A person earning $300 in 2014 does not hav same purchasing power as one earning $300 in 2017. In fact, one earning $300 in 2017 is poorer than one earning $300 in 2014. Y? Bec, due to overvaluation in exch rate, $1 buys u less in 2017 than wat it did in 2014.
Read 12 tweets
27 Sep
(Comment: 1/n) More than that, I will argue that the biggest disservice our govt does is not letting unproductive businesses go bust. There r guaranteed returns/prices, trade restrictions & plethora of (bad) regulations making sure that the economy remains more of the same. Image
(2/n) This then means that we keep using our resources to produce same goods/services rather than allowing them to get reallocated to more productive activities. See an earlier thread for more detailed discussion
(3/n) It is not hard to appreciate why govts are often reluctant to let businesses to go bust even if they are unproductive. Doing so makes people temporarily unemployed and give leeway to opposition to blame the govt for not doing anything about this. ImageImage
Read 5 tweets
25 Sep
(1/n) It turns out year-on-year credit growth is -ve in real terms. (Real) Outstanding credit in Aug-20 is 9.23% lower compared to Aug-19 & 9.47% lower compared to Aug-18. Now one can argue tht 2018 is not an appropriate benchmark since this was the year of debt fuelled growth. Image
(2/n) If u buy this argument then relevant benchmark is probably FY17/16. The picture improves considerably. But note that total credit in Aug-20 is still 2.57% lower than wat it was in Aug-17. There is still more to the story: distance frm pre-crisis trend is likely much bigger.
(3/n) But there r few positives as well. First, total credit (real terms) to export sector has continued to increase over this period. It stood 14.92% higher in Aug-20 than what it was in Aug-18. This confirms that the economy has rebalanced towards exports during last two years.
Read 5 tweets
19 Sep
(Thread: 1/n) Everyone in #Pakistan talks about elite capture but what does it even mean? After all, even good policy decisions leave behind "a roll of victims sufficient to give sound policy a bad name" - Hicks, 1939. tribune.com.pk/story/2264602/…
(2/n) In other words, there will always be people complaining about any policy decision ever taken. How then does the electorate know if policy decisions are being taken keeping in view society’s interests as a whole rather than the elites’?
(3/n) I argue tht elite capture can be identified by assessing credibility of decision makin processes. Since an imp part of decision-making r institutions, their nature, culture of meritocracy & autonomy with which they operate shud be central to any discussion on elite capture.
Read 7 tweets

Did Thread Reader help you today?

Support us! We are indie developers!


This site is made by just two indie developers on a laptop doing marketing, support and development! Read more about the story.

Become a Premium Member ($3/month or $30/year) and get exclusive features!

Become Premium

Too expensive? Make a small donation by buying us coffee ($5) or help with server cost ($10)

Donate via Paypal Become our Patreon

Thank you for your support!

Follow Us on Twitter!