
How many have had #COVID19 in Delhi? What % of infections have been detected? What is the fatality rate?
A (longish) #thread on Delhi's epidemic, with some analysis of its three serosurveys + other data. Details in a technical document linked at the end. (1/11)
A (longish) #thread on Delhi's epidemic, with some analysis of its three serosurveys + other data. Details in a technical document linked at the end. (1/11)
First, Delhi's current surge (which may be winding down) is real - not just about better detection. But the actual surge in infections has been considerably smaller than in June - detection has increased a lot, making it seem larger. (Similar story to Mumbai - more later.) 2/ 

Prevalence estimate: by mid-August between 37% and 49% of Delhi people had had COVID. By mid-September: between 43% and 60%. The wide range reflects many uncertainties. When the October serosurvey results are out, we'll know more. (bloombergquint.com/coronavirus-ou…) 3/


Delhi's three serosurveys gave antibody levels of:
- 23% (July)
- 29% (August)
- 25% (September)
Interpretating the surveys is hard because of:
- poor transparency: no technical documentation
- changes in methodology & test-kit between surveys
- no sampling correction
4/
- 23% (July)
- 29% (August)
- 25% (September)
Interpretating the surveys is hard because of:
- poor transparency: no technical documentation
- changes in methodology & test-kit between surveys
- no sampling correction
4/
Waning antibodies (i.e., decreasing sensitivity of the antibody tests) helps explain Delhi's seroprevalence data. Estimate: at least 20% of positive tests turn negative each month. Probably closer to 30%. This determines where the truth lies between... 5/
ndtv.com/india-news/aug…
ndtv.com/india-news/aug…
...two extremes:
- rapidly waning test sensitivity. High % have had COVID. Low % of infections detected. Low IFR.
- slowly waning test sensitivity. Lower % have had COVID. Higher % of infections detected. Higher IFR.
(See the analysis for Mumbai.) 6/
science.thewire.in/health/mumbai-…
- rapidly waning test sensitivity. High % have had COVID. Low % of infections detected. Low IFR.
- slowly waning test sensitivity. Lower % have had COVID. Higher % of infections detected. Higher IFR.
(See the analysis for Mumbai.) 6/
science.thewire.in/health/mumbai-…
Detection of infections: to date, between 2.5% and 3.5% of Delhi's total COVID-19 infections have been detected. But at the moment it's higher: my estimate is about 8% of infections are currently being detected. (95% CI: 4-16%). Why is infection detection rising?... 7/


Why are more infections being detected?
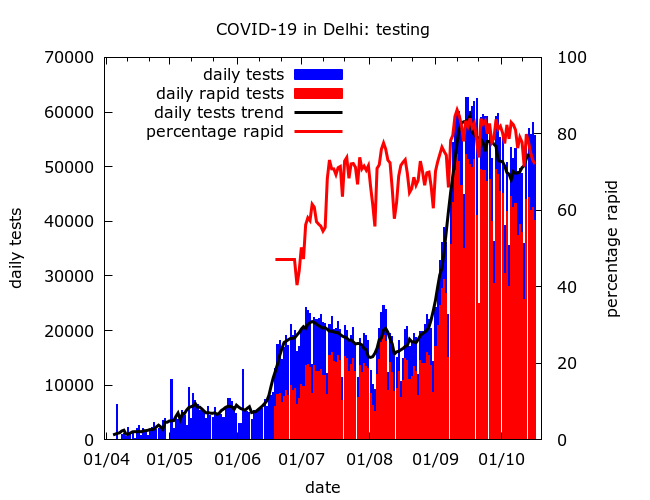
1) There is more testing - even correcting for the high proportion (currently ~80%) which are rapid
2) *Maybe* spread has shifted towards middle-class areas where detection is higher? (As in Mumbai - below) 8/
science.thewire.in/health/mumbai-…
1) There is more testing - even correcting for the high proportion (currently ~80%) which are rapid
2) *Maybe* spread has shifted towards middle-class areas where detection is higher? (As in Mumbai - below) 8/
science.thewire.in/health/mumbai-…
Fatality rate: Delhi's naive infection fatality rate (ignoring undercounting) is low:
- overall ~0.06% (95% CI: 0.05-0.07%).
- currently ~0.085% (95% CI: 0.04%-0.18%).
There is some indication that it has been rising - fourth serosurvey data will make this clearer. 9/
- overall ~0.06% (95% CI: 0.05-0.07%).
- currently ~0.085% (95% CI: 0.04%-0.18%).
There is some indication that it has been rising - fourth serosurvey data will make this clearer. 9/


A mystery: why is Delhi's naive IFR so low (0.05-0.07%)? Even correcting for plausible levels of undercounting IFR is low. Possibly the answer lies in uneven spread: have the elderly been partly shielded because of slower spread in planned colonies? 10/
scroll.in/latest/974615/…
scroll.in/latest/974615/…
The approach (Monte Carlo) is to put plausible distributions on some of the many unknown quantities and run lots of experiments (10,000) to get distributions on prevalence, IFR, detection of infections, etc. (11/11)
Much more detail here: maths.mdx.ac.uk/research/model…
Much more detail here: maths.mdx.ac.uk/research/model…
• • •
Missing some Tweet in this thread? You can try to
force a refresh


