Very provocative new paper by @dylanhmorris @jlloydsmith on effects of temp & humidity on survival of SARS-CoV-2 on surfaces. Need to be careful in interpreting most novel aspects of this paper.
Thread.
Thread.
https://twitter.com/dylanhmorris/status/1317452511624790017
Background
Effects of temperature & humidity on survival of viruses is potentially of huge importance as it can influence transmission b/w people & has been argued to be key mechanism driving flu seasonality. See perspective by @mlipsitch C Viboud pnas.org/content/106/10…
Effects of temperature & humidity on survival of viruses is potentially of huge importance as it can influence transmission b/w people & has been argued to be key mechanism driving flu seasonality. See perspective by @mlipsitch C Viboud pnas.org/content/106/10…
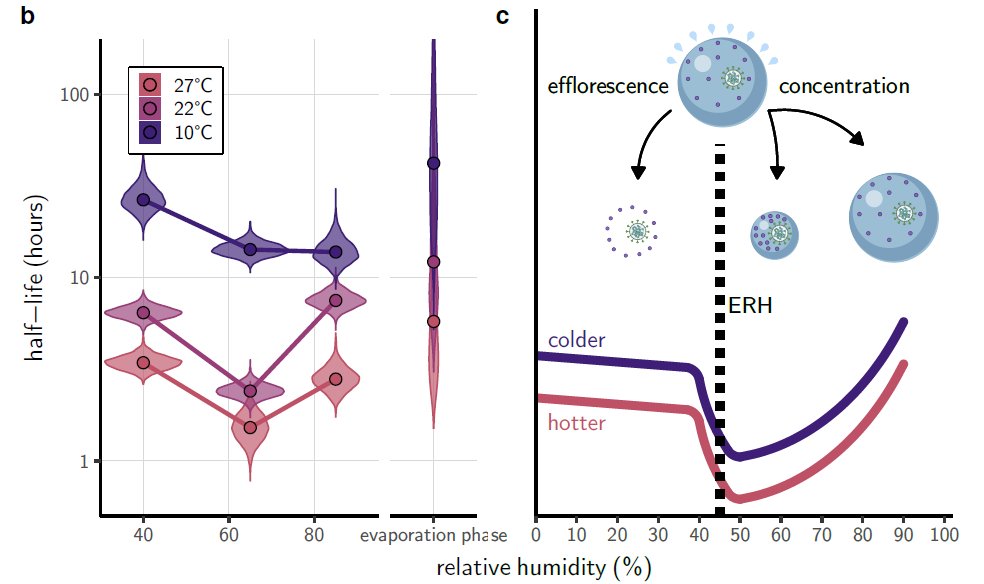
New paper suggests that viral survival on surfaces declines w/ temp & is lowest at intermediate humidity. If robust, could guide how to reduce risk of indoor transmission - warmer & 40-60% RH best. Indoor risk v important for next 4-6 mo. But... 
I have some concerns w/ this interpretation for several reasons:
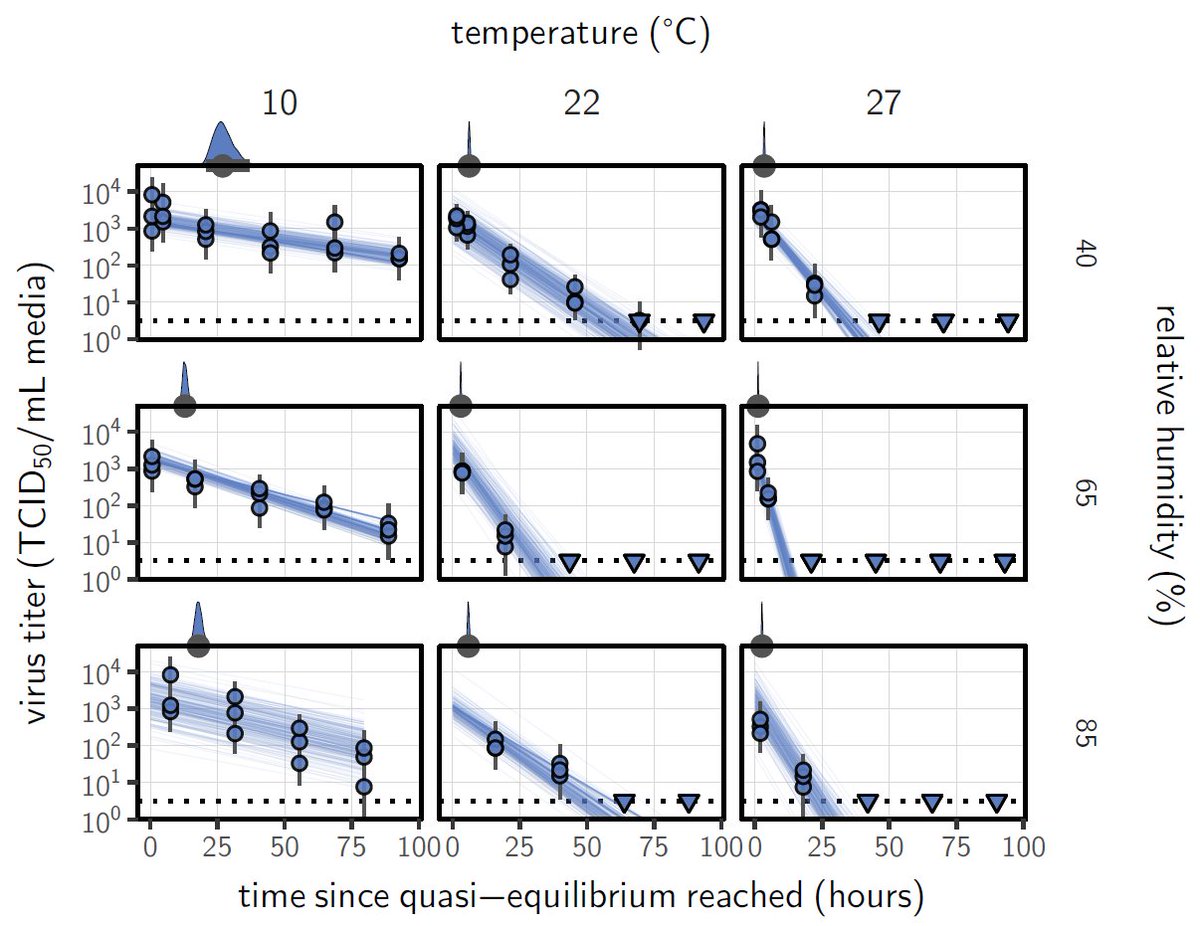
1) data/analyses in paper itself: estimates of viral half-life are estimates from regressions (sometimes extrapolations) of estimates of raw data & N=3 w/ 10x variation among N=3 points.
1) data/analyses in paper itself: estimates of viral half-life are estimates from regressions (sometimes extrapolations) of estimates of raw data & N=3 w/ 10x variation among N=3 points.

Note: This work is challenging and requires BSL-3 lab. Credit to authors for studying infectious virus, not decay of RNA. But need to be careful in overstretching results, especially when data are limited & messy & results at odds w/ other results.
-Authors choose half-life as key response variable but this point is on edge of data for 8/9 treatments. Why not use time to decrease 90%?
-Slopes don't seem to go through data on key panel (10C 85% RH); slope looks steeper, residuals patterned?
-Slopes don't seem to go through data on key panel (10C 85% RH); slope looks steeper, residuals patterned?

-Another key panel (22C 85% RH) has no data for early time point so 1/2-life is extrapolation. Initial titres for other 85%RH are much higher (10C: ~10^3.5) or a little lower (27C: 10^2.5) than estimated intercept. Despite this CI extremely tight. Puzzling.
Why am I scrutinizing the high humidity treatment? B/c pattern proposed here - that viral survival is actually higher at higher humidities - is at odds with some data for other viruses. e.g. messy data from:
pnas.org/content/106/9/…
pnas.org/content/106/9/…

This fig from paper supposedly brings in data from other viruses but I can't see pattern in it (can authors re-plot w/ 1/10th-life vs RH for diff temps?):

-Finally, experiment has just 3 humidities & is proposing a non-linear relationship. That's asking quite a bit from the data which, as noted above, are estimates of 1/2-lives based on regressions of N=3 estimates of TCID50 for each time step, temp, RH.
2) Suggestion that moderate humidity reduces viral survival needs to be weighed against impact of humidity on effects on lung tissue. Study @VirusesImmunity in mice indicates lower humidity increases susceptibility: pnas.org/content/116/22…
3) New study is on viral survival on surfaces. Epidemiological data indicate this is a relatively minor pathway in SARS-CoV-2 transmission. Anecdotes exist (including recent NZ trash lid) but just anecdotes so far.
https://twitter.com/DiseaseEcology/status/1279097818351726592
https://twitter.com/DiseaseEcology/status/1313193505276133376
How does relative humidity affect transmission via aerosols/droplets? Animal study (golden hamsters?) would be ideal for this. Does study already exist? If so, please link to it.
So, would I make policy based on this paper & try to have indoor buildings (e.g. schools) maintain humidities at intermediate levels (40-70%)? No, I don't think it's strong enough for that, especially w/ other transmission pathways & possible effects of RH on susceptibility.
In contrast, the patterns of Temperature here are strong and consistent with other results. Warmer air greatly reduces viral survival - compare 27C vs 22C.
So warmer air is much better than cooler air, and very dry air is bad. Meat packing, ice hockey - unfortunately good conditions for high viral survival (on surfaces).
But is very humid air also bad? I'm not convinced, but could be.
But is very humid air also bad? I'm not convinced, but could be.
Addendum- flu data vs humidity above is transmission among lab animals not survival. Will add survival data tomorrow.
Adding link to thoughtful response (& my responses - it's a conversation) from @dylanhmorris:
My overall take:
Strong support for viral survival & transmission being highest at low temps, low RH.
Uncertainty about whether RH>50% increases or decreases risk
https://twitter.com/dylanhmorris/status/1320808152233840640
My overall take:
Strong support for viral survival & transmission being highest at low temps, low RH.
Uncertainty about whether RH>50% increases or decreases risk
• • •
Missing some Tweet in this thread? You can try to
force a refresh