How many SARS-CoV-2 infections are there per COVID-19 case now?
Early estimates & guesses suggested there were 10 infections for every case, but these estimates were done when testing capacity was very low. With higher testing capacity & better engagement where are we now?
Thread
Early estimates & guesses suggested there were 10 infections for every case, but these estimates were done when testing capacity was very low. With higher testing capacity & better engagement where are we now?
Thread
Background
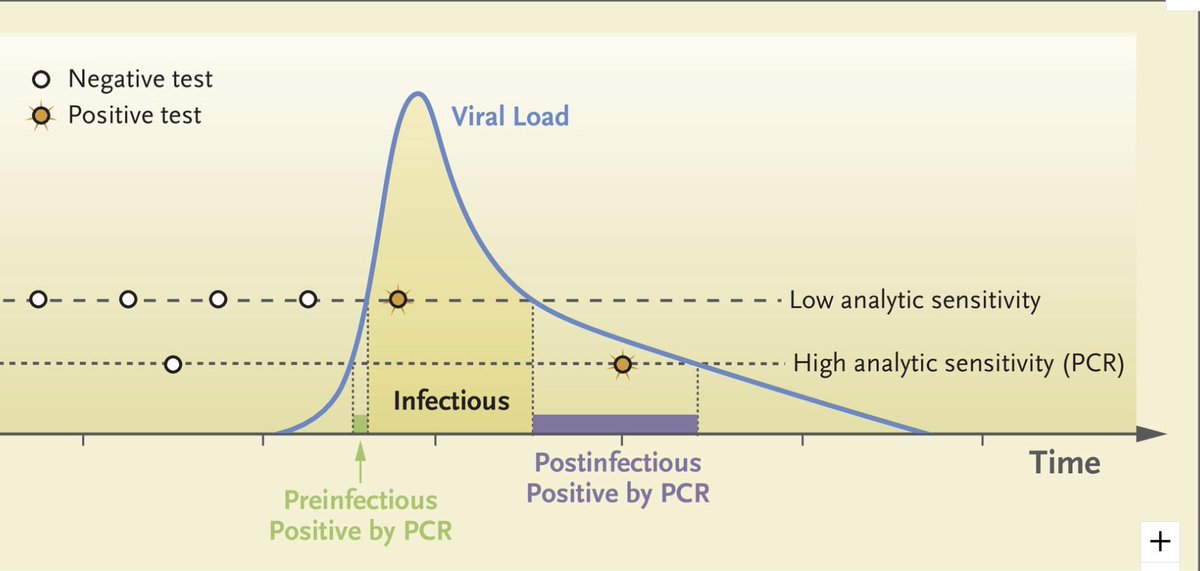
It's well known that confirmed COVID-19 cases are only a fraction of all infections. Infections can be missed because people are asymptomatic, have mild enough symptoms that they don't get tested, or can't get tested even if they want to due to accessibility.
It's well known that confirmed COVID-19 cases are only a fraction of all infections. Infections can be missed because people are asymptomatic, have mild enough symptoms that they don't get tested, or can't get tested even if they want to due to accessibility.
In Mar-Apr underascertainment of infections was so large & uncertain it led to claims that there may have been hundreds of infections per confirmed case. A famous example is paper suggesting 1/2 of UK MAY have been infected by Mar
ft.com/content/5ff646… medrxiv.org/content/10.110…
ft.com/content/5ff646… medrxiv.org/content/10.110…
This suggestion turned out to be grossly incorrect (<5% of UK pop had been infected in Mar: medrxiv.org/content/10.110…).
1st rigorous estimates of infec/case in Apr from serosurveys suggested it was ~10x (10 infections/case).
e.g. in NYC late Apr: 11x: sciencedirect.com/science/articl…
1st rigorous estimates of infec/case in Apr from serosurveys suggested it was ~10x (10 infections/case).
e.g. in NYC late Apr: 11x: sciencedirect.com/science/articl…
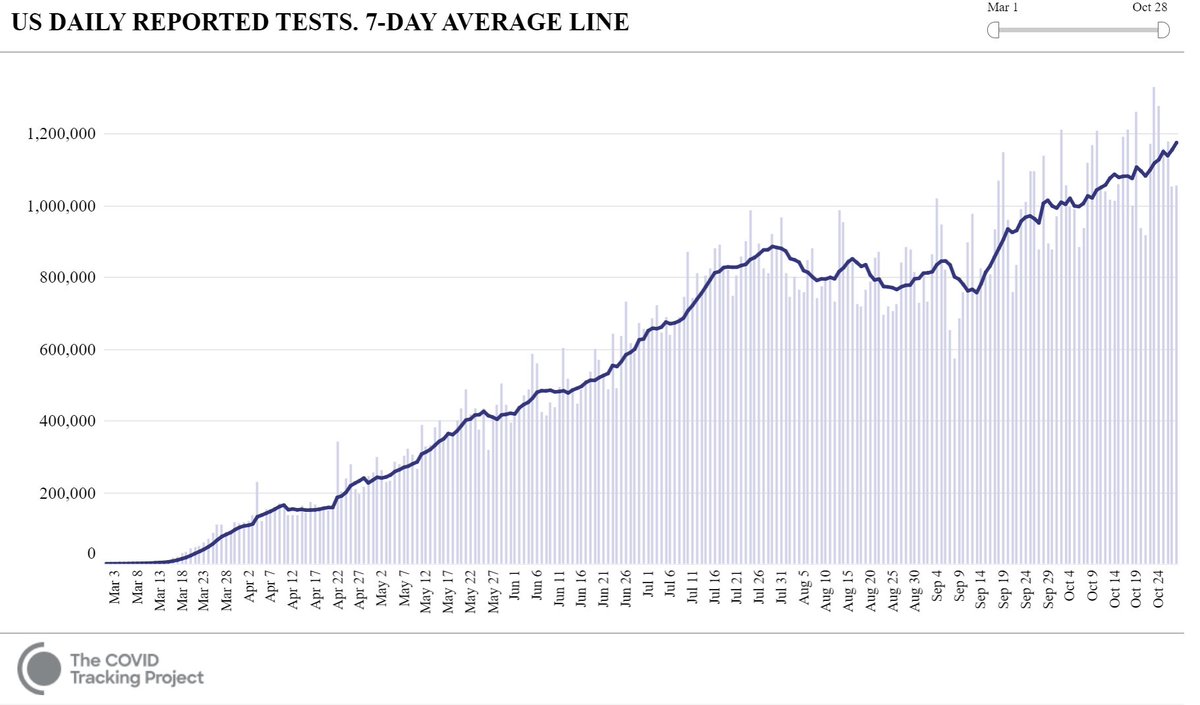
But testing capacity has increased enormously globally. In US >5x more tests/day in Oct than in Apr. Does this mean the # of infections/case is now 2x? No, b/c when we add tests, test positivity usually goes down, so it's a case of diminishing returns. So is it now 3x? 5x? 8x? 
Why does it matter? For one, many models use a ratio of infections to cases to try to assess how much immunity might limit transmission. This helps us understand what fraction of a pop has been exposed & likely has (some) immunity, at least for some time:
science.sciencemag.org/content/sci/ea…
science.sciencemag.org/content/sci/ea…
The ratio of infections/case is used for risk assessment calculators like this one from @joshuasweitz that has recently been expanded from US to UK, Italy, France:
covid19risk.biosci.gatech.edu
This tools uses 5x or 10x
covid19risk.biosci.gatech.edu
This tools uses 5x or 10x
The difficulty is that to know the ratio of infections to cases when this ratio is changing over time we need either sequential seroprevalence studies or actual estimates of the fraction infected.
Sequential seroprevalence studies exist, but antibodies wane over time which means that serosurveys underestimate the # infected for infections months ago:
https://twitter.com/CHP_Gian/status/1321746327940878336
One can account for waning w/ a model & some have (medrxiv.org/content/10.110…). But in order to estimate # of infections/case when it is changing there must be a substantial number of infections/cases b/w serosurveys so one can quantify the new frac of pop infected.
That limits the places we can estimate the infections/case. Sequential serosurveys in places like NYC w/ few cases/pop b/w Aug & Sept wouldn't help much b/c there hasn't been enough transmission to measurably change seroprevalence (i.e. hard to differentiate 24% & 25%).
However, there is another source of data that can give us an answer, at least for 1 place: England!
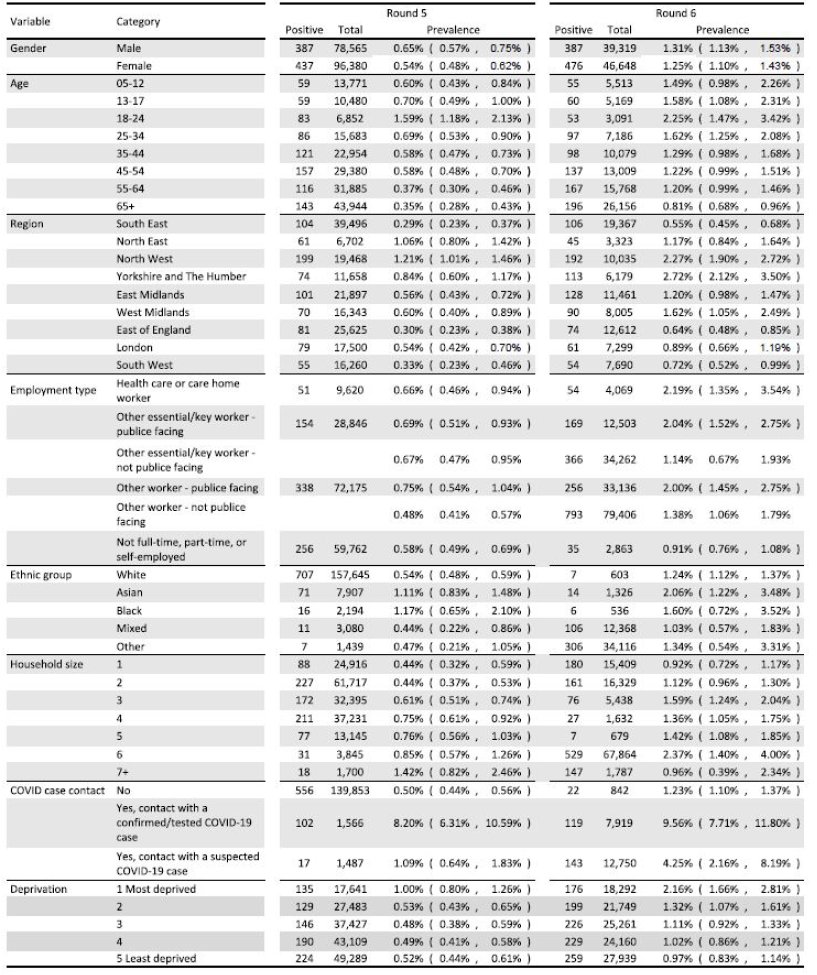
An amazing effort by a huge team (@SRileyIDD @DrKAinslie @profhelenward et al) has been collecting estimates of the fraction of people that are infected with SARS-CoV-2 over time.
An amazing effort by a huge team (@SRileyIDD @DrKAinslie @profhelenward et al) has been collecting estimates of the fraction of people that are infected with SARS-CoV-2 over time.
It's an amazing project where they collect swabs from ~150K random people ~monthly in England & test by PCR. Study design is fantastic & scale (150K!) means they can estimate infection prevalence (by age, etc.) moderately accurately for each 2-3wk period.
medrxiv.org/content/10.110…
medrxiv.org/content/10.110…
So many amazing insights from this study, but here I'll focus on infections/case. To estimate the # of infections/case I need to make a big assumption:
-infection prev for England (location of study) is same as for UK (couldn't easily find daily COVID cases for just England)
-infection prev for England (location of study) is same as for UK (couldn't easily find daily COVID cases for just England)
(Sorry, England, you're apparently not a country in eyes of COVID-19 case counters @nytimes @OurWorldInData @MaxCRoser @JohnsHopkins)
Also b/c swabs are collected over several weeks, I need a time period where cases are relatively stable or else do harder calculation. I used Round 3 of survey & cases 7d after sampling to reflect delay b/w infection & detection (could be longer; would change answer ~10%).
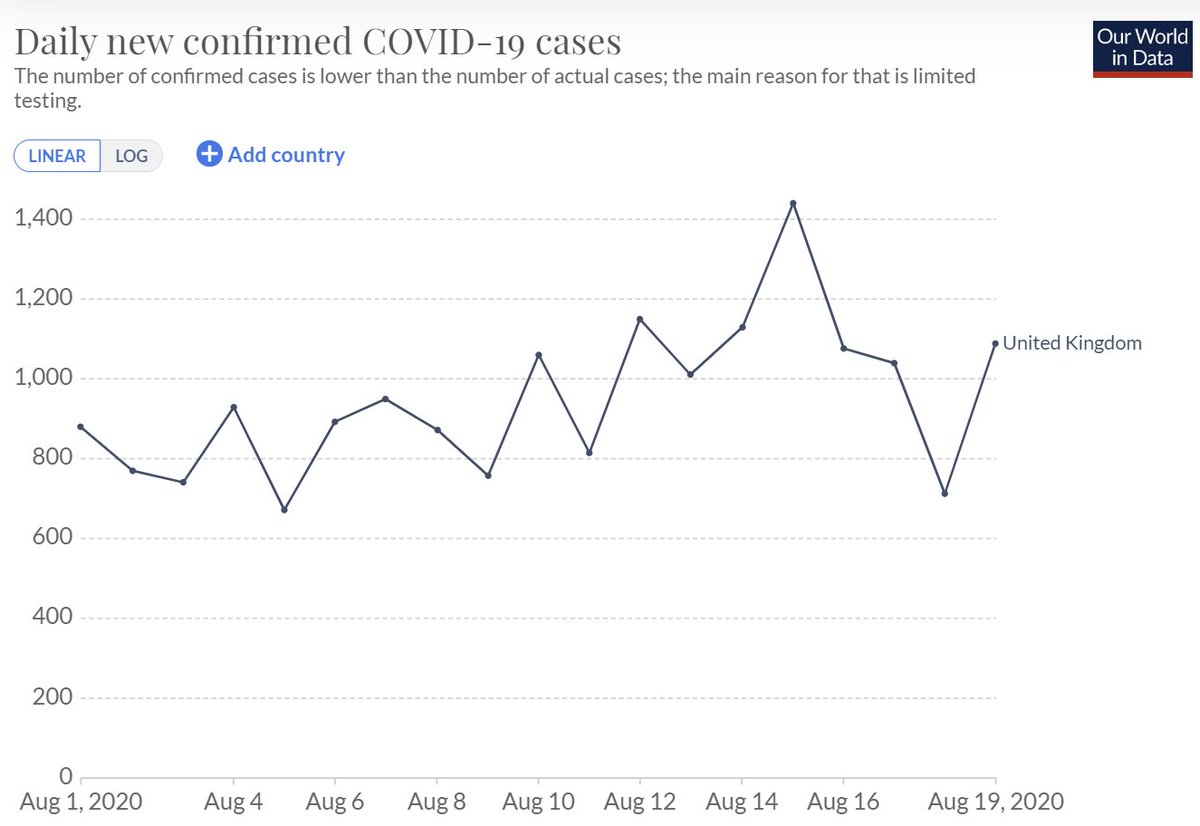
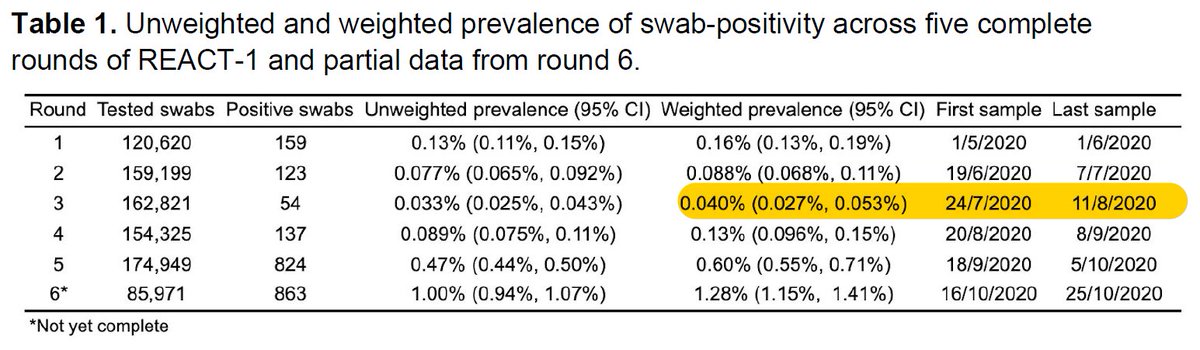
So, w/ prev 0.04% & UK pop (66.65M) & 0.75 test sensitivity & 10 d of testing + (medrxiv.org/content/10.110…) I get ~3555 infections/day. Given ~940 cases detected/d this gives ratio of infections/cases of ~3.8.

This is hugely useful for me for thinking about how many infections are happening each day. For example, if you had to guess how many infected people are getting on each airplane each day in a given city to assess risk of COVID on flights.
(note: to get actual risk you'd need to adjust # infections to # infectious. More details on that & how to stop importing infected travelers here:
https://twitter.com/DiseaseEcology/status/1271281847754846211
https://twitter.com/DiseaseEcology/status/1276023991870709761)
It's great to have this estimate, but it's 1 estimate for 1 month in 1 country & I made key assumptions & simplifications. I'd love to see this done better for England. If I've missed an analysis that has done this properly please post link to it! @SRileyIDD @DrKAinslie
I also calculated ratios for other sampling periods (Rounds) for England (5-13x) but cases were more variable during those periods so calcs are poorer quality. But @SRileyIDD @DrKAinslie could estimate a continuous ratio if they wanted to (& maybe have?).
Conclusion: This ratio of infections to cases (~4x in England in Aug) is very valuable for many things. If there are estimates (not guesses) of infections/cases from other places & discrete periods from post-July (or data to enable calculations) please provide links! Thank you!
Some folks that might be interested or could help make this better @trvrb @mlipsitch @CT_Bergstrom @nataliexdean @youyanggu @joshuasweitz @taaltree @andrewazman
• • •
Missing some Tweet in this thread? You can try to
force a refresh