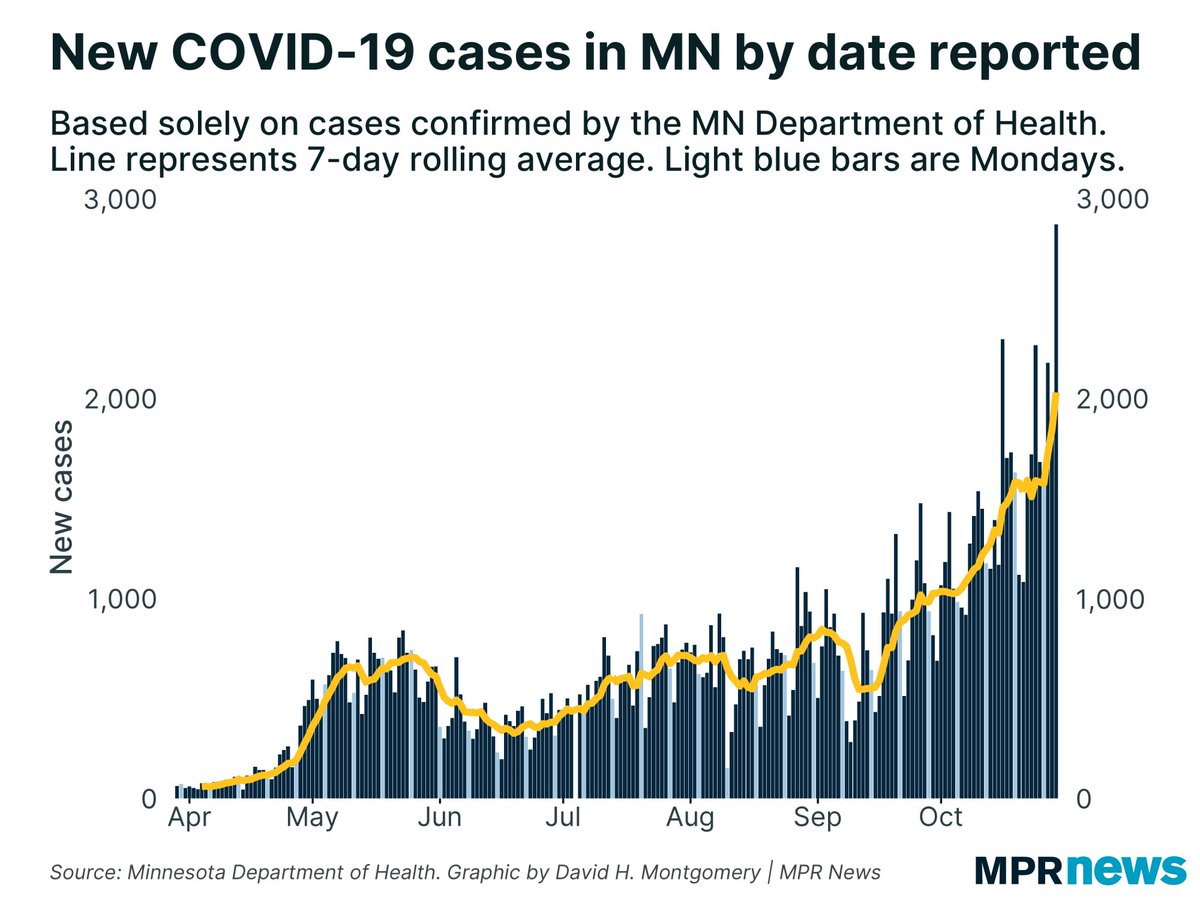
While I’m waiting to see what’s up with today’s #COVID19 case data in MN (), I can share some other charts, and the news isn’t good here, either.

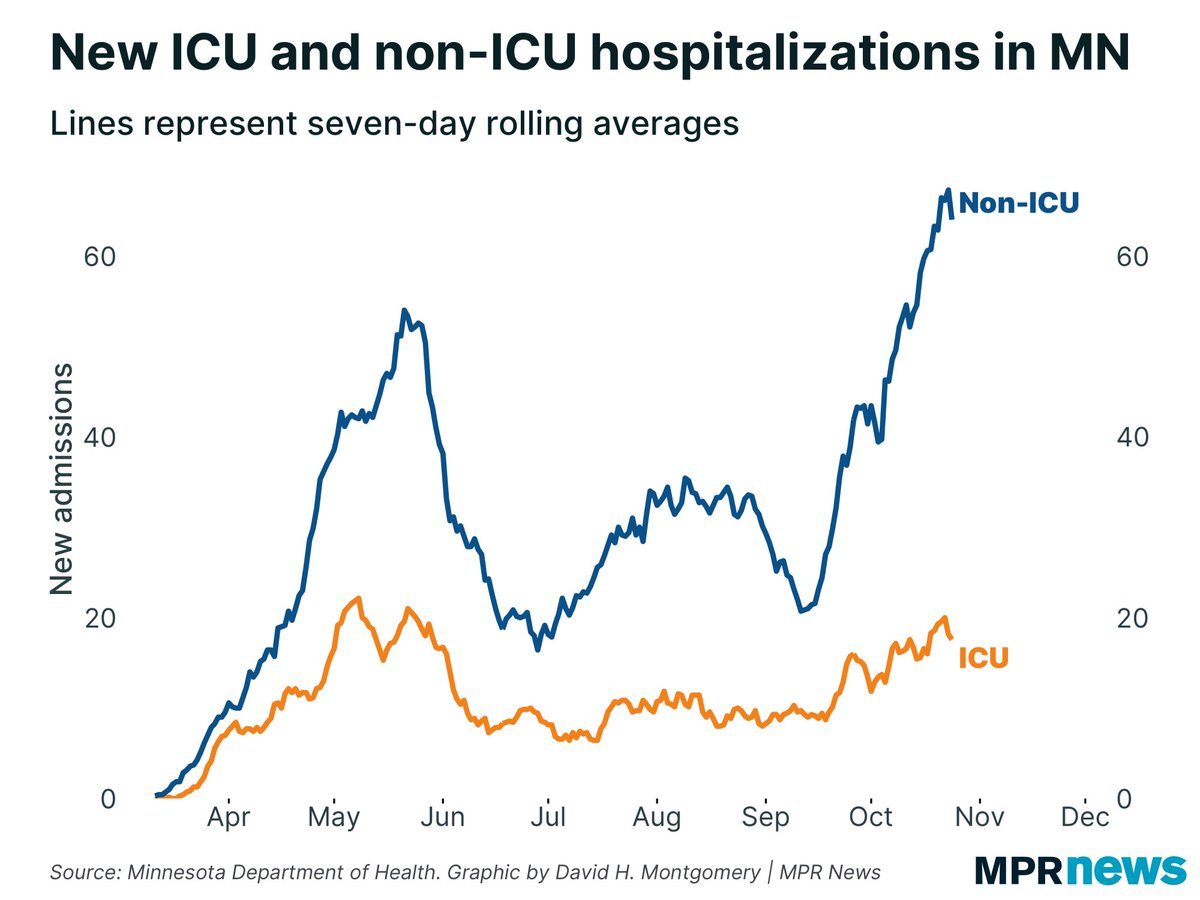
New hospitalizations continued to rise, once again to record levels:
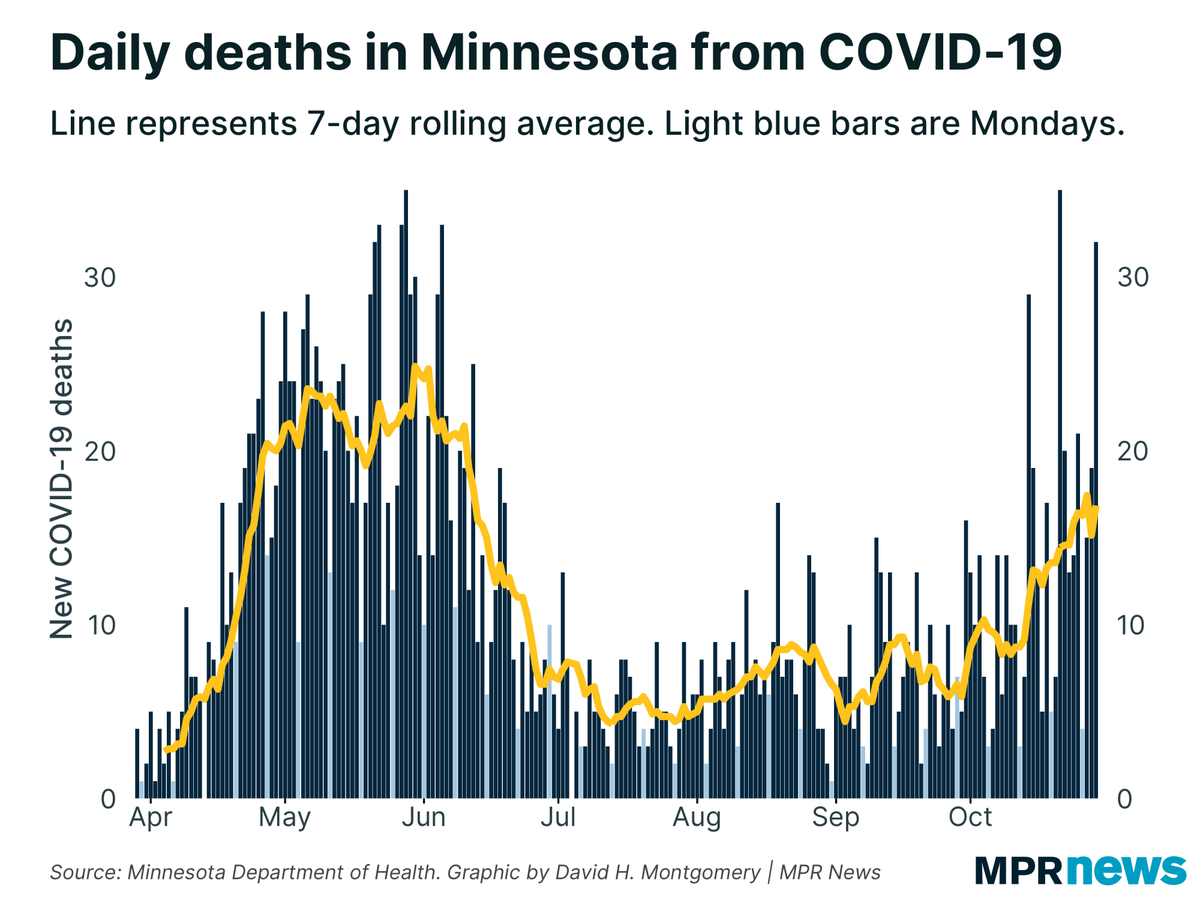
The 7-day average of new deaths is also the highest it’s been in 6 months, over 17/day:
Assuming today’s case data is accurate, the rise in cases is still starkest on a per-capita basis in northwestern MN, where the case rate is at record highs. It’s also rising in the suburban counties around Hennepin/Ramsey:
New #COVID19 deaths have been rising in recent days among the non-long-term-care population:

• • •

Missing some Tweet in this thread? You can try to force a refresh
 

Keep Current with David Montgomery

David Montgomery Profile picture

Stay in touch and get notified when new unrolls are available from this author!

Read all threads

This Thread may be Removed Anytime!

PDF

Twitter may remove this content at anytime! Save it as PDF for later use!

Try unrolling a thread yourself!

how to unroll video
  1. Follow @ThreadReaderApp to mention us!

  2. From a Twitter thread mention us with a keyword "unroll"
@threadreaderapp unroll

Practice here first or read more on our help page!

More from @dhmontgomery

29 Oct
Buckle up, this is a bad news day for #COVID19 in Minnesota.

To start, a new record number of newly reported cases — 2,872, smashing the old record of 2,297 from two weeks ago.

MN is now *averaging* 2,000 cases per day. Image
Meanwhile MN also reported more than 30 #COVID19 deaths today for the second time this month, as the weekly average moves up.

Keep in in mind these are deaths deriving from cases a couple weeks ago. Case loads are higher now. Image
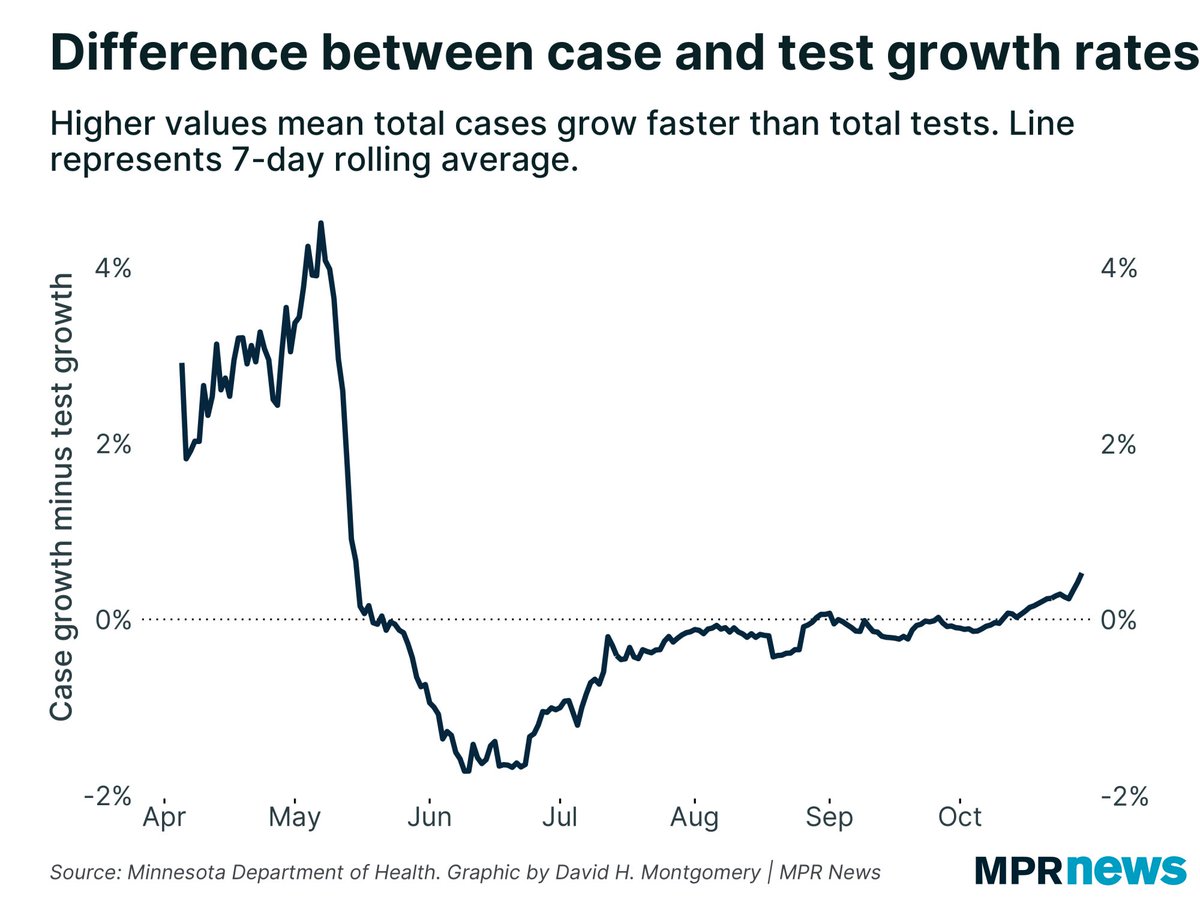
Now, some of today’s record number of cases is due to testing jumping back up to 30,000 after a few lower days.

But MN was already reporting 2,000+ cases/day with LOW testing. The outbreak is real. MN’s 7-day positivity rate is up to 8.7%. Cases are growing faster than tests. ImageImage
Read 10 tweets
29 Oct
My latest for @MPRnews is a look at Minnesota’s political geography — where the votes are for Democrats and Republicans here, and how this is changing in ways that will determine whether Biden or Trump wins.

Lots of charts! mprnews.org/story/2020/10/…
@MPRnews So Greater Minnesota has been a stronghold for Republicans for a long time, reliably giving a net margin of tens of thousands of voters.

In 2016, Donald Trump blew all past Republican performers there out of the water. SIX TIMES Romney’s margin there: mprnews.org/story/2020/10/… Image
@MPRnews But even with this unprecedented performance in rural Minnesota, getting more net votes there than any top-of-the-ticket Republican this century, Trump fell just short… because DFL turnout in Hennepin & Ramsey ALSO exploded in 2016: mprnews.org/story/2020/10/… Image
Read 9 tweets
28 Oct
Another day of nearly 2,000 #COVID19 cases and fewer than 20,000 tests in Minnesota, leading to an elevated positivity rate. The 7-day average is currently 8.2%, up from 6.3% last Monday. Image
Newly reported #COVID19 cases in Minnesota were down slightly day-over-day, but up a lot week-over-week: Image
New #COVID19 hospitalizations have also set a new record. For the first time this outbreak, Minnesota has been averaging more than 100 new admissions per day over a full week: Image
Read 12 tweets
27 Oct
So today’s #COVID19 case data in MN is astonishingly bad — so bad that my first thought is there’s a data issue. I’ve inquired with @mnhealth to see if something’s wrong, and will delete this tweet if it turns out there is.

Short story: cases up, tests down, leading to this:
@mnhealth Here you can see newly reported cases near record levels, while newly reported tests fell to a typical Tuesday low value.

I wonder if some lab only reported their positive tests today, and not their negatives?
@mnhealth There’s not a big backlog of old cases in today’s data:
Read 6 tweets
26 Oct
Recent #COVID19 data suggest’s MN’s recent explosive growth in cases might have hit a plateau. Newly reported cases have averaged just over 1,500/day for a week now. The positivity rate has also flattened out.

No guarantee this will continue, though.
Zooming in, case growth has flattened or begun to decline recently in just about all parts of Minnesota EXCEPT the northwest, where cases continue to rise ceaselessly. (Also maybe the metro suburbs, to a much smaller degree.)

Again, all trends continue until they don’t.
New #COVID19 hospitalizations continue to rise, though. This could mean the plateauing of new cases is an illusion. It could mean the infected population is shifting to more vulnerable groups. Or it could be that hospitalizations are just a trailing indicator.
Read 6 tweets
25 Oct
Yet another day of 20+ newly reported #COVID19 deaths in Minnesota. Until two weeks ago, MN hadn’t had any such days since June. The 7-day average is now up to 16 deaths/day. Image
Most of these deaths are happening in long-term care facilities, but not all; non-LTC deaths are also up from last month. Image
Central Minnesota is still reporting the highest per capita death rate from #COVID19: Image
Read 7 tweets

Did Thread Reader help you today?

Support us! We are indie developers!


This site is made by just two indie developers on a laptop doing marketing, support and development! Read more about the story.

Become a Premium Member ($3/month or $30/year) and get exclusive features!

Become Premium

Too expensive? Make a small donation by buying us coffee ($5) or help with server cost ($10)

Donate via Paypal Become our Patreon

Thank you for your support!

Follow Us on Twitter!