Recent #COVID19 data suggest’s MN’s recent explosive growth in cases might have hit a plateau. Newly reported cases have averaged just over 1,500/day for a week now. The positivity rate has also flattened out.
No guarantee this will continue, though.
Zooming in, case growth has flattened or begun to decline recently in just about all parts of Minnesota EXCEPT the northwest, where cases continue to rise ceaselessly. (Also maybe the metro suburbs, to a much smaller degree.)
Again, all trends continue until they don’t.
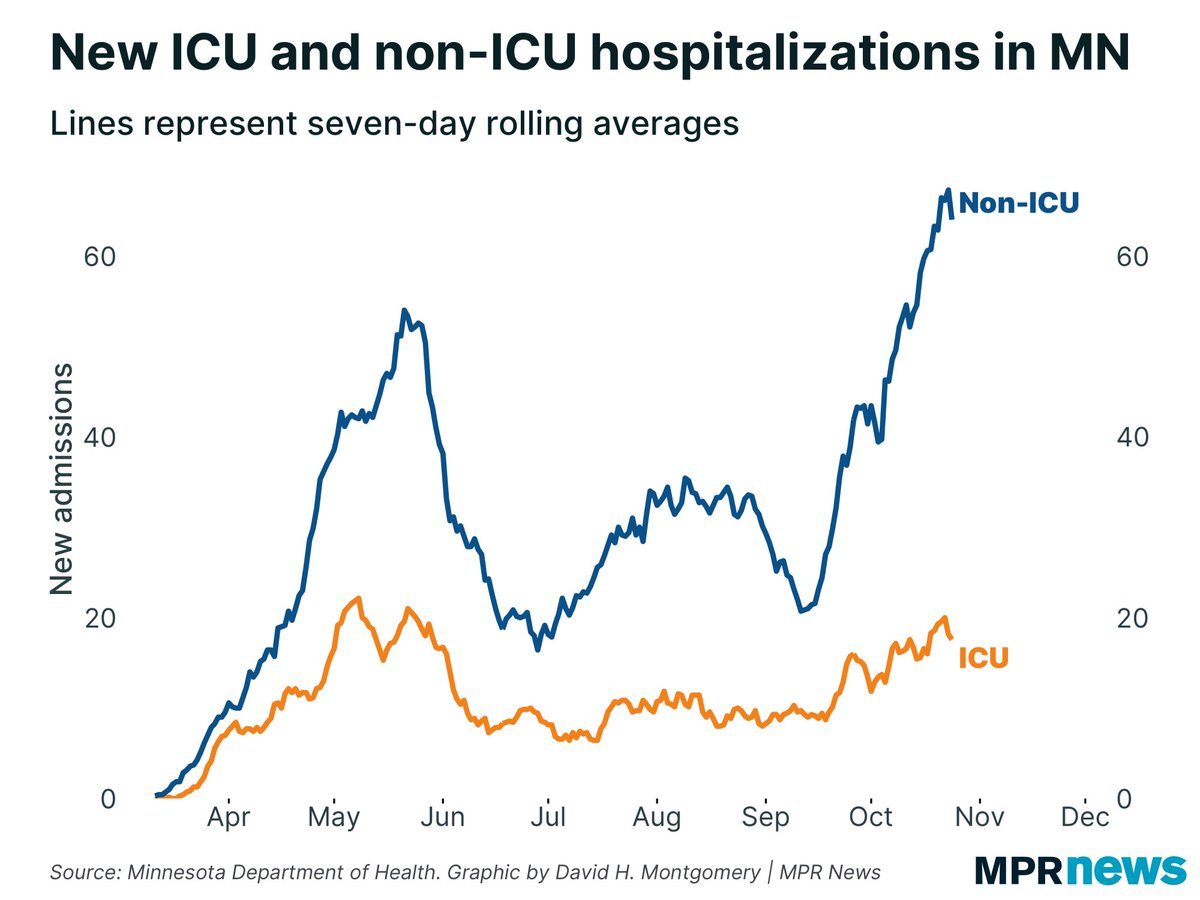
New #COVID19 hospitalizations continue to rise, though. This could mean the plateauing of new cases is an illusion. It could mean the infected population is shifting to more vulnerable groups. Or it could be that hospitalizations are just a trailing indicator.
New #COVID19 deaths dipped today, both day-over-day and week-over-week. But they remain at a very elevated level — an average of 16/day, and one day of data doesn’t mean much, especially after a weekend.
New #COVID19 deaths continue to happen disproportionately in central Minnesota, which has also been reporting the most new cases for some time.
No big change over the last few days in the age structure of Minnesota’s new #COVID19 cases. A little dip in 50-somethings, which could be interesting if it persists.
• • •
Missing some Tweet in this thread? You can try to
force a refresh
Another day of nearly 2,000 #COVID19 cases and fewer than 20,000 tests in Minnesota, leading to an elevated positivity rate. The 7-day average is currently 8.2%, up from 6.3% last Monday.
Newly reported #COVID19 cases in Minnesota were down slightly day-over-day, but up a lot week-over-week:
New #COVID19 hospitalizations have also set a new record. For the first time this outbreak, Minnesota has been averaging more than 100 new admissions per day over a full week:
), I can share some other charts, and the news isn’t good here, either.
New hospitalizations continued to rise, once again to record levels:
The 7-day average of new deaths is also the highest it’s been in 6 months, over 17/day:
Assuming today’s case data is accurate, the rise in cases is still starkest on a per-capita basis in northwestern MN, where the case rate is at record highs. It’s also rising in the suburban counties around Hennepin/Ramsey:
So today’s #COVID19 case data in MN is astonishingly bad — so bad that my first thought is there’s a data issue. I’ve inquired with @mnhealth to see if something’s wrong, and will delete this tweet if it turns out there is.
Short story: cases up, tests down, leading to this:
@mnhealth Here you can see newly reported cases near record levels, while newly reported tests fell to a typical Tuesday low value.
I wonder if some lab only reported their positive tests today, and not their negatives?
@mnhealth There’s not a big backlog of old cases in today’s data:
Yet another day of 20+ newly reported #COVID19 deaths in Minnesota. Until two weeks ago, MN hadn’t had any such days since June. The 7-day average is now up to 16 deaths/day.
Most of these deaths are happening in long-term care facilities, but not all; non-LTC deaths are also up from last month.
Central Minnesota is still reporting the highest per capita death rate from #COVID19:
20 more #COVID19 deaths today in Minnesota, on top of yesterday’s record 35 — a sad sign that yesterday wasn’t a fluke. The 7-day trend continues to rise.
13 of today’s 20 #COVID19 deaths were in long-term care facilities. The blue line in this chart is doing scary things right now:
#COVID19 deaths are up everywhere in the state except for the 5 suburban counties:
Yikes. Minnesota reported 35 new #COVID19 deaths today. That ties the state’s record high, set back on May 28.
25 of these 35 new #COVID19 deaths were among residents of long-term care facilities.
Minnesota’s 7-day trend of newly reported hospital admissions is also at a record high, averaging 80/day over the last week. Previously this had peaked at 78 in late May: