During my leave I’ve really enjoyed reading about the inspiring women trailblazers in statistics who paved the way for us. Here are some of my favourite quotes in chronological order. Please share yours! #WSDS
Florence Nightingale states in her essay Cassandra 👇
🖼 source: Wikimedia commons Quote by Nightingale on women not being able to take occupat
Clara E. Collet writes in her chapter on women's work in Life and Labour of the People of London👇 (freely available to read: public-library.uk/dailyebook/Lif… )
🖼 source: facebook.com/SenateHouseLib… Clara Collet: life to large numbers of married woman... is n
Janet Lane-Claypon pioneered the use of cohort studies and case-control studies & wrote 👇

🖼 source: en.wikipedia.org/wiki/Janet_Lan… General public health measures will only carry us a certain
Frances Wood writes in an article on the increase in the cost of food after war 👇

🖼source: significancemagazine.com/science/563-th…
Enid Charles was a pioneer in the fields of demography and population statistics and wrote 👇 Academic discussion of family allowances is often vitiated b
Gertrude Cox was a pioneer in experimental design and was the first woman elected into the International Statistical Institute in 1949.

🖼source: Wikipedia Main contribution of the statistician is getting the investi
Florence Nightingale David won the first Elizabeth L. Scott Award in 1992 for dismantling barriers for women in Statistics

🖼 source: magazine.amstat.org/blog/2016/03/3…
Stella Cunliffe was the Director of Statistics at the UK Home Office and became the first female president of the @RoyalStatSoc in 1975.

🖼: Causeweb prepare to guide sociologists into more scientifically accep
@RoyalStatSoc Elizabeth Scott or the “woman who used regression to influence the salaries of many” said 👇

🖼: rss.onlinelibrary.wiley.com/doi/pdf/10.111…
@RoyalStatSoc Margaret Butler started working as statistician followed by a great career path in the public sector in the earliest days of computers and nuclear energy.

🖼 : semiwiki.com/general/2128-m… we have yet to attain a critical mass i nthe scientif and en
@RoyalStatSoc We’ve come a long way but there’s still work to be done to incorporate diversity into our institutions and resources including Wikipedia. At @statsyss we’re planning to address this with an
event that we’ll be announcing shortly…
#BlackInStats #BlackInData #LatinasInStats Gaps in Wikipedia

• • •

Missing some Tweet in this thread? You can try to force a refresh
 

Keep Current with Women in Statistics and Data Science

Women in Statistics and Data Science Profile picture

Stay in touch and get notified when new unrolls are available from this author!

Read all threads

This Thread may be Removed Anytime!

PDF

Twitter may remove this content at anytime! Save it as PDF for later use!

Try unrolling a thread yourself!

how to unroll video
  1. Follow @ThreadReaderApp to mention us!

  2. From a Twitter thread mention us with a keyword "unroll"
@threadreaderapp unroll

Practice here first or read more on our help page!

More from @WomenInStat

6 Nov
I’m really looking forward to attending this 👇 #Nightingale2020 has been one of the few things worth celebrating this year! Her lessons on sanitation couldn’t be more relevant.
#WSDS
As part of the bicentennary celebrations of the birth of the first @RoyalStatSoc woman elected fellow, at the society we’ve also organised several events throughout the year rss.org.uk/news-publicati… Florence Nightingale, Lady with the lamp, Polar area diagram
@RoyalStatSoc At @statsyss we were particularly proud to organise #FloViz,a #dataviz competition to reinterpret her famous polar diagram. The winning entries by @gunning_edward @sianbladon & Roddy Jaques 👇were announced on her birthday, you can see them: statsyss.wordpress.com/2020/05/13/flo… 3 reinterpretations of the polar area diagram, winning of th
Read 11 tweets
6 Nov
Support mechanisms for students and early career researchers have become ever so important during the pandemic, yet more difficult to provide.

🖼️Another beautiful and on-point creation by @allison_horst Four people supporting a trampolin to catch two baloons & co
@allison_horst As a consequence, the power and potential of the support they receive from online communities like this one have been strengthened by the circumstances. I have personally valued them more than ever.
@allison_horst When I registered to curate this account earlier in the year I didn’t know there was going to be either a pandemic or elections. I just thought it would be a nice way to return to work after extended maternal leave, and a great way to get my confidence & stats interests back.
Read 13 tweets
5 Nov
Throughout my career, I’ve become a bit wary of institutions that claim to be the best and specify exceptional candidates in job offers and PhD studentships…

(Shout-out to the great @Letxuga007 for the mean gif 😉)
I’d like to take this opportunity to demand the right for the less excellent or “tending towards average” to be given opportunities and have their well deserved place in Academia!

🖼️DIY creation using @allison_horst's fab artwork Distribution & average
This hyperbolic language is exclusionary and will not only deter the “average” student from applying but also very smart yet humble candidates who are perhaps more realistic and indeed honest in their self assessments 🤔
Read 7 tweets
28 Oct
Tweetorial on going from regression to estimating causal effects with machine learning.

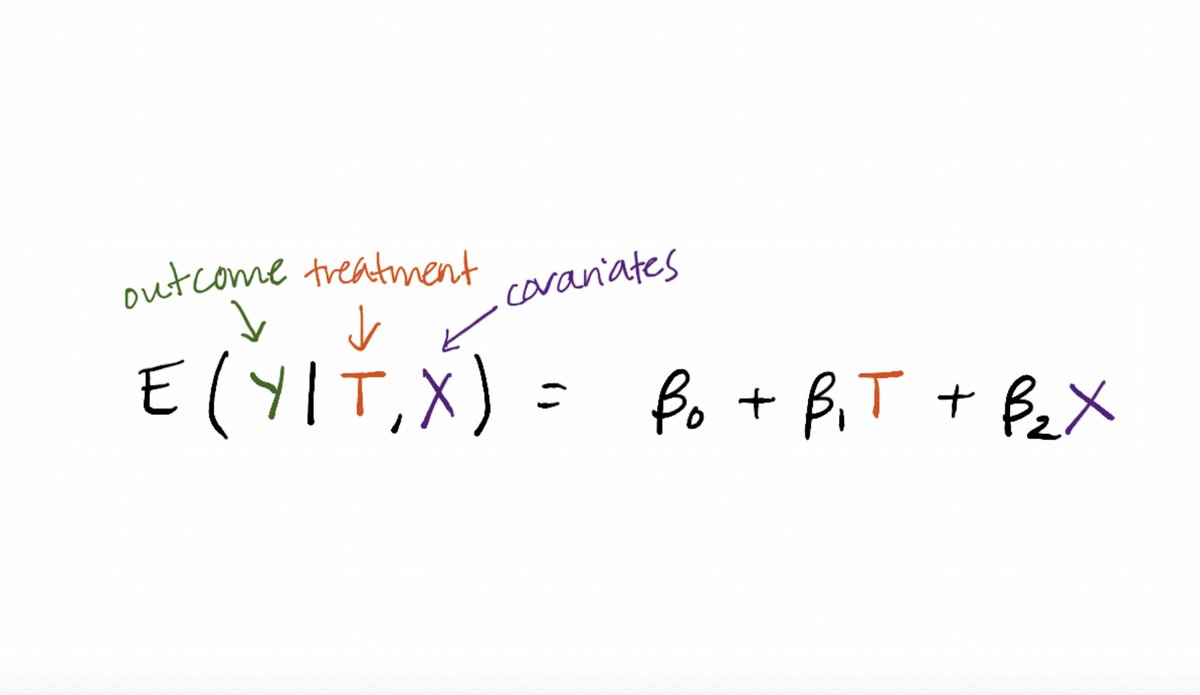
I get a lot of questions from students regarding how to think about this *conceptually*, so this is a beginner-friendly #causaltwitter high-level overview with additional references. Hand-drawn graphic of a regression formula E(Y|T,X)=\beta_0+
One thing to keep in mind is that a traditional parametric regression is estimating a conditional mean E(Y|T,X).

The bias—variance tradeoff is for that conditional mean, not the coefficients in front of T and X. Hand-drawn graphic of a regression formula E(Y|T,X)=\beta_0+
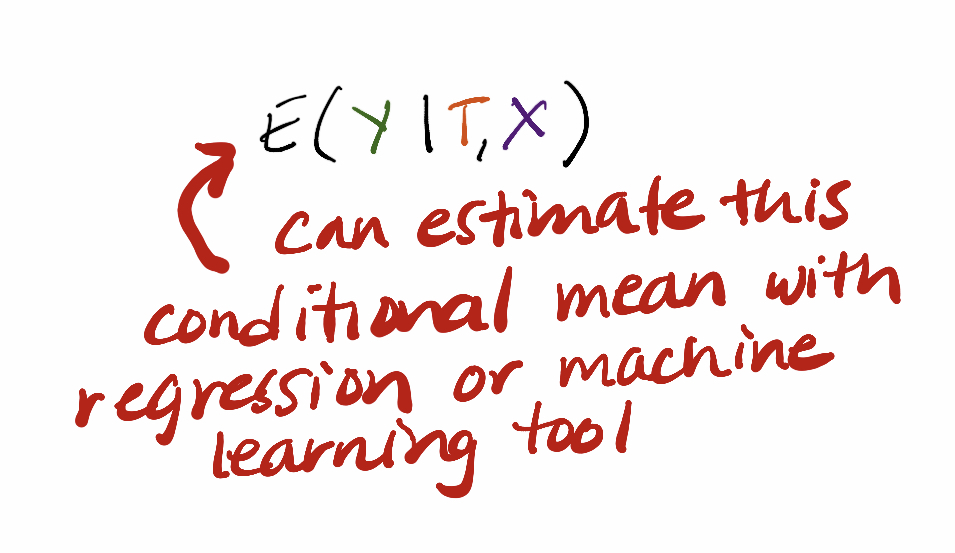
The next step to think about conceptually is that this conditional mean E(Y|T,X) can be estimated with other tools. Yes, standard parametric regression, but also machine learning tools like random forests.

It’s OK if this is big conceptual leap for you! It is for many people! Hand-drawn graphic of the conditional mean E(Y|T,X) with red
Read 13 tweets
26 Oct
What do professors do day-to-day (in a pandemic)?

This varies *a lot* by type of role, seniority, and institution.

I’m tenured at a research-intensive institution and I am not teaching this term.
I spend a fair amount of time meeting with students and collaborators. Today, Monday, I have 5 such meetings.

There are also lots of emails and administrative tasks all the time.
Each day this week I’ll drop a tweet in this thread to add in unique things I haven’t mentioned yet to demystify the life of this particular professor.
Read 6 tweets
8 Oct
🧵 time! I’d love to talk about the responsibilities we have as data practitioners. In this ~~information age~~ I think it’s critical we use data, ML, stats, and algorithms fairly, and with an eye toward making the world better for people.
I found this piece on data visualization very striking: medium.com/nightingale/it…
“Knowledge is never subjective.” As the creator of a graph, you hold the narrative power.
Read 11 tweets

Did Thread Reader help you today?

Support us! We are indie developers!


This site is made by just two indie developers on a laptop doing marketing, support and development! Read more about the story.

Become a Premium Member ($3/month or $30/year) and get exclusive features!

Become Premium

Too expensive? Make a small donation by buying us coffee ($5) or help with server cost ($10)

Donate via Paypal Become our Patreon

Thank you for your support!

Follow Us on Twitter!