October 31 – Ontario weekly update
Data is 100% public and official, and fully cited.
#COVID19Canada #COVID19Ontario
Data is 100% public and official, and fully cited.
#COVID19Canada #COVID19Ontario

Ontario (population: 14,745,040):
Total deaths by/with covid-19: 3,209 (218 deaths per every million people in ON or 0.02%)
38.8% of Canadian population but 30.7% of Canada deaths by/with covid-19
Total deaths by/with covid-19: 3,209 (218 deaths per every million people in ON or 0.02%)
38.8% of Canadian population but 30.7% of Canada deaths by/with covid-19
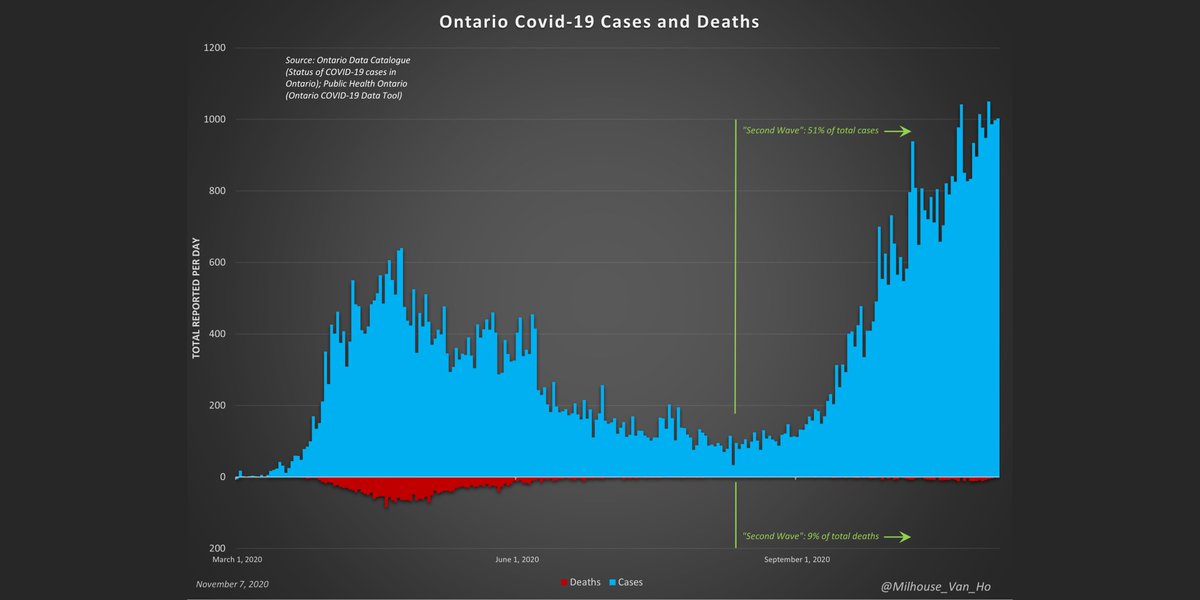
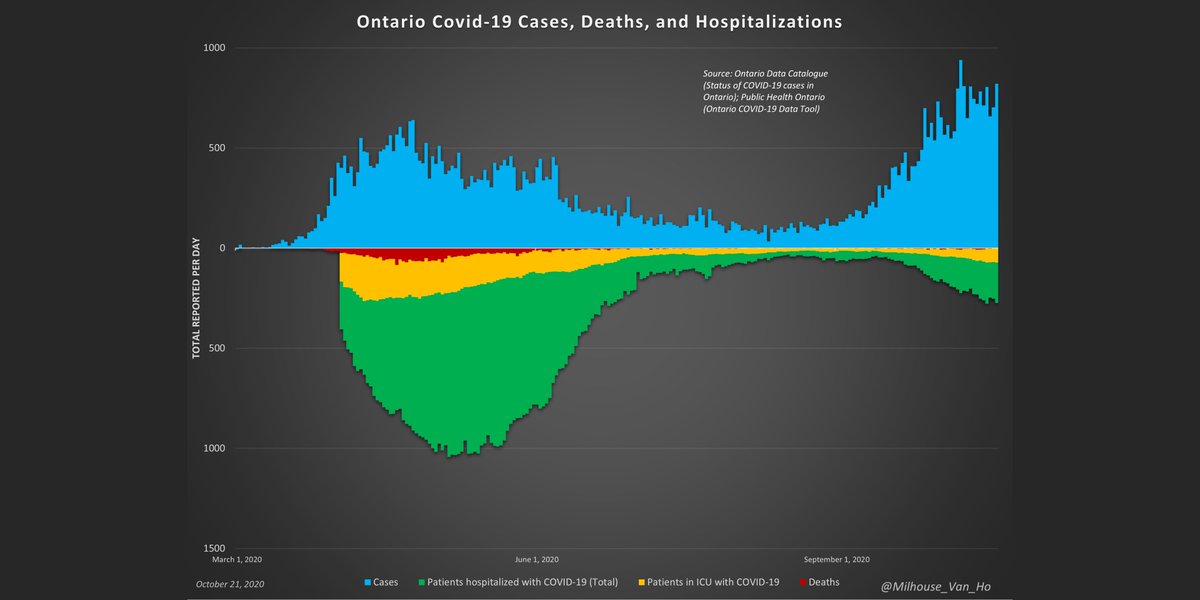
The two most important metrics to watch: deaths and ICU occupancy.
Ontario now reports:
- 86 in ICU
- 49 in ICU on a ventilator
Ontario now reports:
- 86 in ICU
- 49 in ICU on a ventilator

As data on daily new hospitalizations is not publicly available, this is the average daily net change in hospitalizations (ICU and non-ICU). 

Ontario “Second Wave”:
- Growth is not exponential
- May be able to declare a peak when average week-over-week growth reaches zero
- Growth is not exponential
- May be able to declare a peak when average week-over-week growth reaches zero

The Ontario government's level of testing and testing criteria have likely affected the number of cases (positive test results). 

Deaths in Ontario, 2015-19, plus all deaths in 2020, Jan-July.
(n.b. Based on 2020 YTD data for Covid-19 - figures to be revised upward as needed.)
(n.b. Based on 2020 YTD data for Covid-19 - figures to be revised upward as needed.)

This is what 2020 might look like in Ontario month-to-month if:
1. All-cause deaths (excl. Covid-19) are in line with 2017-19 averages
2. All Covid-19 deaths are single-cause excess deaths
(n.b. Based on 2020 YTD data for Covid-19 - figures to be revised upward as needed.)
1. All-cause deaths (excl. Covid-19) are in line with 2017-19 averages
2. All Covid-19 deaths are single-cause excess deaths
(n.b. Based on 2020 YTD data for Covid-19 - figures to be revised upward as needed.)

Covid-19 has been a crisis in Ontario's long-term care (LTC) system vs. among the general public.
(n.b. Based on 2020 YTD data for Covid-19 - figures to be revised upward as needed.)
(n.b. Based on 2020 YTD data for Covid-19 - figures to be revised upward as needed.)

This is the number of deaths by/with covid-19 per million people, among both:
1. the general public, outside the long-term care (LTC) system
2. long-term care (LTC) residents
(n.b. Based on 2020 YTD data for Covid-19 - figures to be revised upward as needed.)
1. the general public, outside the long-term care (LTC) system
2. long-term care (LTC) residents
(n.b. Based on 2020 YTD data for Covid-19 - figures to be revised upward as needed.)

Ontario - Covid-19 still presents a risk primarily to the elderly, not to children and hardly to working-age adults.
(n.b. Based on 2020 YTD data for Covid-19 - figures to be revised.)
(n.b. Based on 2020 YTD data for Covid-19 - figures to be revised.)

The average age of a death by or with covid-19 is higher than life expectancy.
Deaths among those over 80 account for 68.7% of deaths by/with covid-19, but only 52.2% of all deaths (all causes) in 2018.
Deaths among those over 80 account for 68.7% of deaths by/with covid-19, but only 52.2% of all deaths (all causes) in 2018.

Bear in mind that the risk of death will sadly always rise in line with one's advancing age.
In 2018, 18.8% of those in the over-90 age cohort passed away.
(n.b. Based on 2020 YTD data for Covid-19 - figures to be revised.)
In 2018, 18.8% of those in the over-90 age cohort passed away.
(n.b. Based on 2020 YTD data for Covid-19 - figures to be revised.)

If you are under 70, your risk of dying after being infected with SARS-CoV-2 is lower than your annual risk of death.
If you are over 70, your risk of dying after being infected is only slightly higher than your annual risk of death.
If you are over 70, your risk of dying after being infected is only slightly higher than your annual risk of death.

Greater Toronto and Ottawa account for 50.3% of Ontario’s population but 79.7% of Ontario’s covid-19 deaths.
City of Toronto (population: 2,731,571 or 18.5% of Ontario):
Total deaths by/with covid-19: 1,399 (512 deaths per every million people in Toronto or 0.05%)
43.6% of Ontario deaths by/with covid-19
Total deaths by/with covid-19: 1,399 (512 deaths per every million people in Toronto or 0.05%)
43.6% of Ontario deaths by/with covid-19

Suburban Toronto (population: 3,685,945 or 25.0% of Ontario):
Total deaths by/with covid-19: 823 (223 deaths per every million people in the region or 0.02%)
25.6% of Ontario deaths by/with covid-19
Total deaths by/with covid-19: 823 (223 deaths per every million people in the region or 0.02%)
25.6% of Ontario deaths by/with covid-19

City of Ottawa (population: 1,006,210 or 6.8% of Ontario):
Total deaths by/with covid-19: 336 (334 deaths per every million people in Ottawa or 0.03%)
10.5% of Ontario deaths by/with covid-19
Total deaths by/with covid-19: 336 (334 deaths per every million people in Ottawa or 0.03%)
10.5% of Ontario deaths by/with covid-19

• • •
Missing some Tweet in this thread? You can try to
force a refresh


