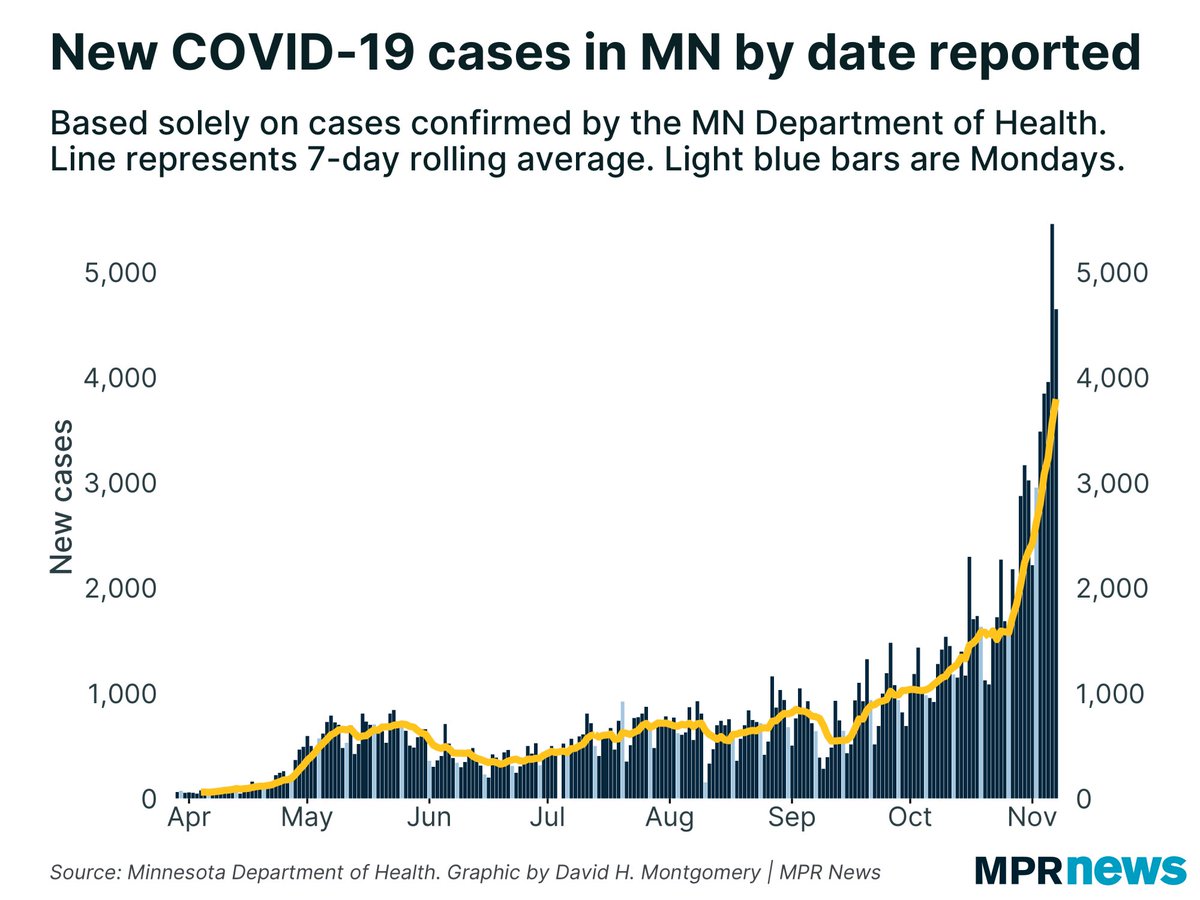
Minnesota reported 3,930 new #COVID19 cases today, down from 5,924 yesterday.

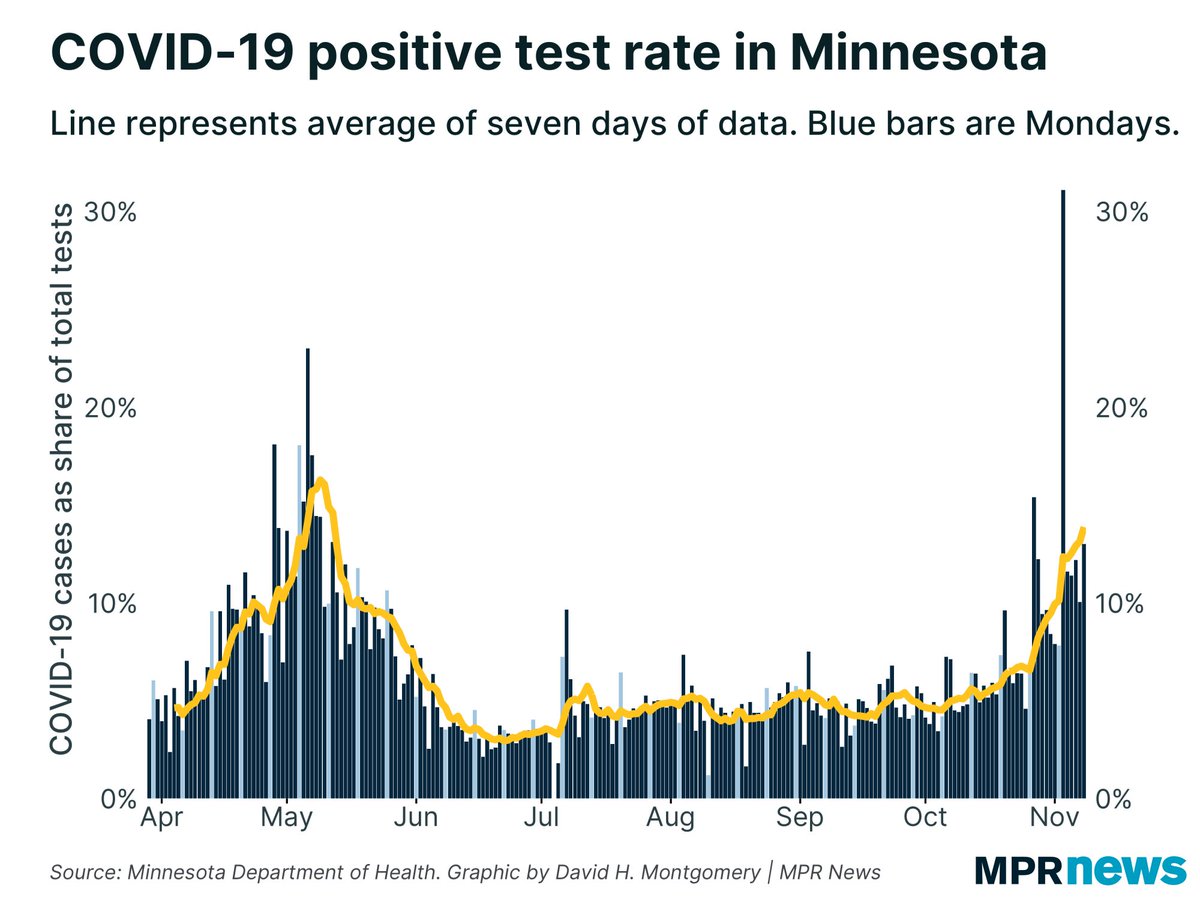
But this isn’t good news. Testing volume fell, as it often does in Monday reports. Lower testing explains ALL of the drop, & then some — the positivity rate continued to climb, even as cases fell. ImageImage
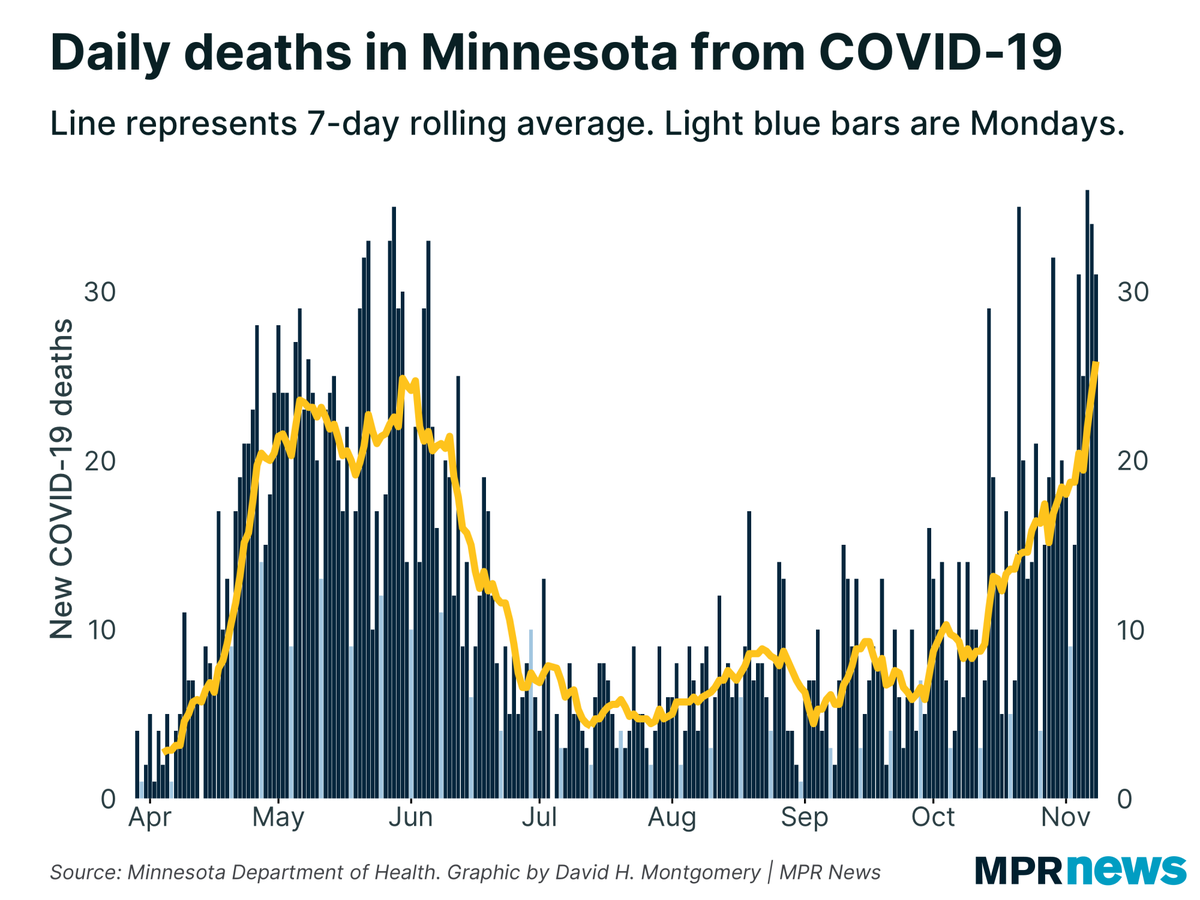
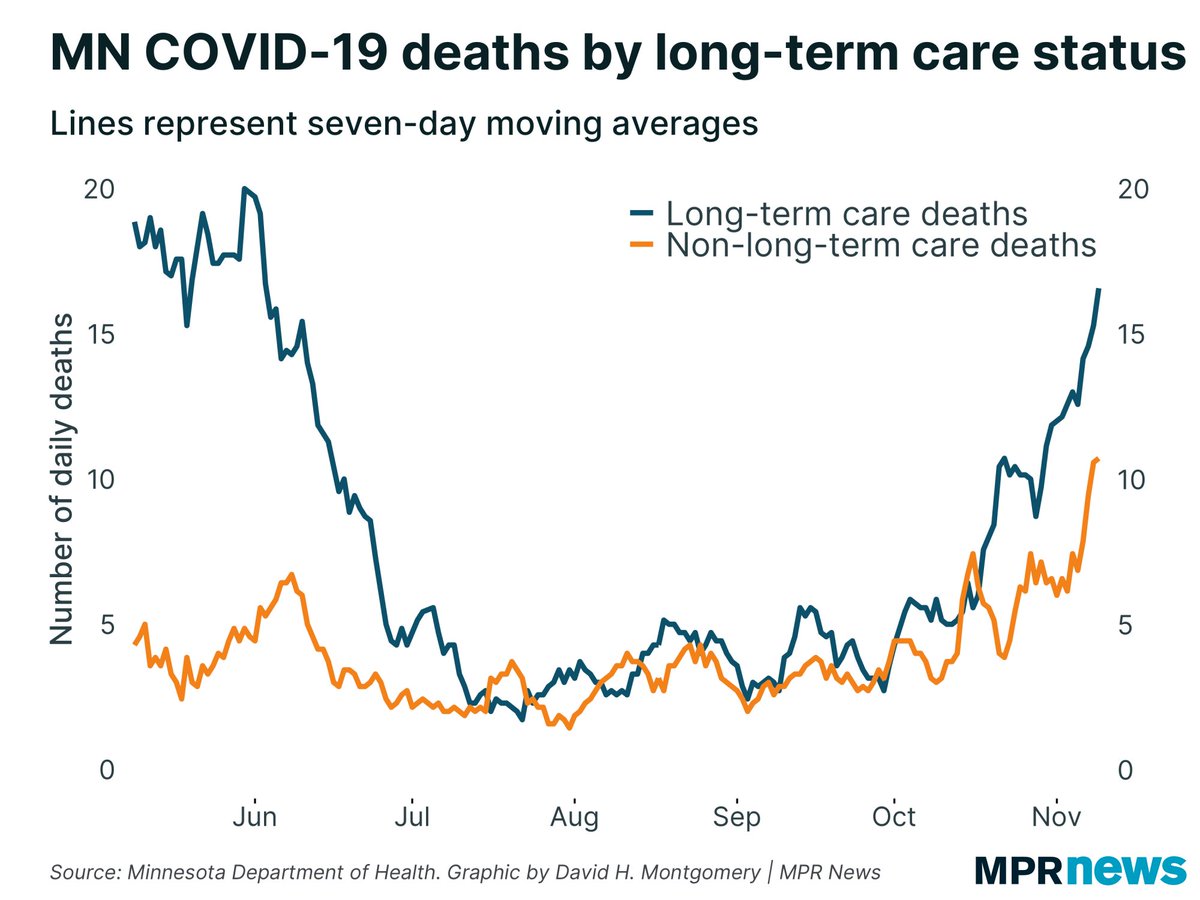
Like new cases, newly reported #COVID19 deaths fell day-over-day but are rising week-over-week. The 7-day average here is now 27 #COVID19 deaths per day, a record high for Minnesota. Image
#COVID19 deaths are rising both in and out of long-term care facilities. Non-LTC #COVID19 deaths are higher than they’ve ever been. Image
Northwestern Minnesota no longer has the state’s fastest-growing #COVID19 outbreak. It’s been passed by east-central MN.

But new cases are rising at accelerating rates everywhere. Image
#COVID19 is expanding exponentially in Minnesota right now, with case counts on pace to double in just 26 days.

It took 8 months to get nearly 185,000 cases. We’re on track to get another 185,000 in less than 1 month. Image
#COVID19 deaths are also growing exponentially. MN has reported 2,675 #COVID19 deaths so far. At the current growth rate, we’ll get nearly 1,700 more deaths by Christmas. Image
#COVID19 is most prevalent among Minnesotans in their 20s, but every single age group is seeing exponential growth right now, including kids and seniors. Image
New #COVID19 hospital admissions continue to rise to new records. Current average: 176 new admissions per day. And we can expect this to keep rising as delayed weekend reports trickle in the next day or two. Image
#COVID19 hospital bed use in Minnesota is rising dramatically: Image
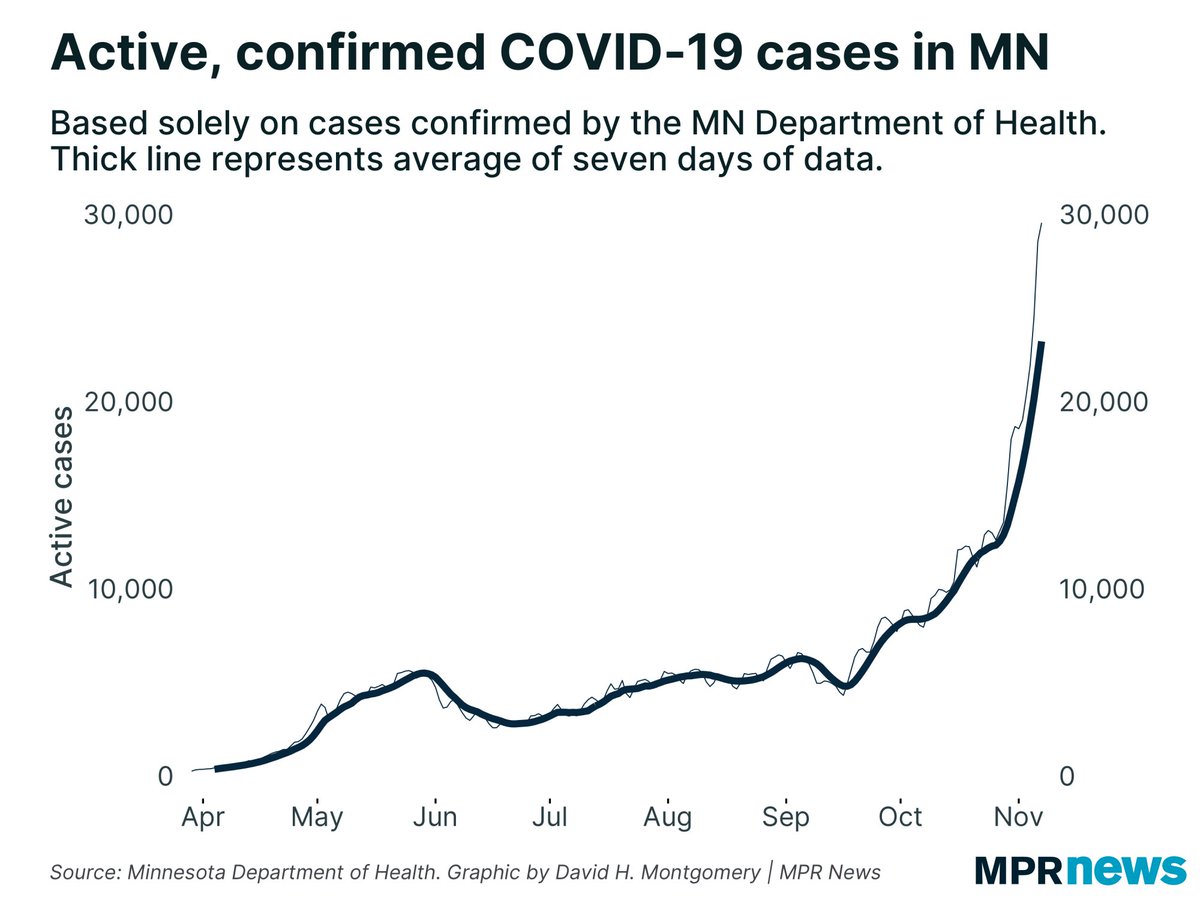
Unsurprisingly, Minnesota is also setting daily record new levels of active, confirmed #COVID19 cases. Image
Minnesota has had strong #COVID19 testing volume recently, but that doesn’t explain the spike in cases. Case volume is growing much faster than testing volume. Image
Something to watch for tomorrow: the last few weeks have seen massive spikes in positive cases on Tuesdays, as cases continue to rise but newly reported testing volume drops. They’ve all been flukey, but part of a sustained rise. Image

• • •

Missing some Tweet in this thread? You can try to force a refresh
 

Keep Current with David Montgomery

David Montgomery Profile picture

Stay in touch and get notified when new unrolls are available from this author!

Read all threads

This Thread may be Removed Anytime!

PDF

Twitter may remove this content at anytime! Save it as PDF for later use!

Try unrolling a thread yourself!

how to unroll video
  1. Follow @ThreadReaderApp to mention us!

  2. From a Twitter thread mention us with a keyword "unroll"
@threadreaderapp unroll

Practice here first or read more on our help page!

More from @dhmontgomery

11 Nov
THREAD: Buckle up, because here’s a story about how the course of history was altered… by sheep in coats. 1/
2/ Our story begins with Auguste de Marmont, the Duke of Ragusa. Born in 1774, Marmont met a young cadet named Napoleon Bonaparte, and soon became the rising general’s friend, and later aide-de-camp. Marmont rose through the ranks himself, commanding a corps by 1805.
3/ In 1809, Napoleon made Marmont a Marshal of France, though wags quipped that Marmont had only been promoted because of his long friendship with Napoleon. Marmont fought in Spain and Germany, and in the defense of France from the Coalition’s invasion in 1814.
Read 42 tweets
11 Nov
56 new #COVID19 deaths in Minnesota. That’s not just a record, it’s half again as large as the old record, set just last week. Minnesota is now averaging 32 COVID deaths per day over the past week, and rising *sharply*. Image
These new #COVID19 deaths in Minnesota are rising both in and out of long-term-care facilities. Non-LTC deaths are at a record high. LTC deaths are averaging 19.7/day, a faction below the record of 20/day set on May 30. Image
New #COVID19 hospitalizations are down a bit from yesterday’s record, but are up week-over-week, setting a new 7-day average record of 186/day. A month ago this was 67/day. Image
Read 8 tweets
10 Nov
A new one-day record today for newly reported #COVID19 hospitalizations in Minnesota: Image
Today’s 4,906 newly reported cases put Minnesota’s 7-day average up to 4,665 cases per day, up 200 from yesterday’s figure, as this continues its steady rise: Image
Unlike recent weeks, we didn’t see a collapse in testing values in today’s Tuesday report. The positivity rate actually declined, both day-over-day and week-over-week. But as I always say, don’t make too big a deal over minor blips in the data. Wait to see what’s sustained. Image
Read 10 tweets
8 Nov
Another day, another record-bad #COVID19 report in Minnesota. 5,924 newly reported cases, just three days after MN first crossed *4,000*:
EVEN WORSE: Another day of 30+ #COVID19 deaths means Minnesota is officially seeing the most deadly phase of its outbreak. More deadly than May! The seven-day average death rate now is nearly 26/day. It peaked in May below 25/day.
Minnesota’s positivity rate is also continuing to rise, now up to a 7-day average of 13.9%. The all-time record here from May is 16.3%.
Read 13 tweets
7 Nov
Minnesota is up to nearly 30,000 active #COVID19 cases, up from 13,000 two weeks ago.
The positivity rate and case count are both continuing to rise:
Another day of 30+ deaths, averaging 24/day over the last week:
Read 6 tweets
6 Nov
STORY: In 2020, Hennepin County saw total votes equal to 90.4% of registered voters. That seems suspiciously high to some people. But turnout rates were just as high in GOP strongholds, too — even before accounting for MN’s same-day registration. mprnews.org/story/2020/11/… Image
Here’s the 2020 election in Minnesota in one chart — change in vote share vs. change in turnout. As you can see, turnout was up big in Trump counties as well as Biden counties. Hennepin’s not an outlier. mprnews.org/story/2020/11/… Image
For example: Hennepin County saw 90.4% of previously registered voters vote. But Wright County, where Trump won 61.9% of the vote, had 94.3% turnout by this measure. Sherburne County was Trump 65.1% with 92% turnout. Morrison County was Trump 75.8%, 93.5% turnout.
Read 5 tweets

Did Thread Reader help you today?

Support us! We are indie developers!


This site is made by just two indie developers on a laptop doing marketing, support and development! Read more about the story.

Become a Premium Member ($3/month or $30/year) and get exclusive features!

Become Premium

Too expensive? Make a small donation by buying us coffee ($5) or help with server cost ($10)

Donate via Paypal Become our Patreon

Thank you for your support!

Follow Us on Twitter!