1/
Get a cup of coffee.
In this thread, I'll help you understand the basics of Estimation Theory.
Get a cup of coffee.
In this thread, I'll help you understand the basics of Estimation Theory.
2/
Life is a series of random events.
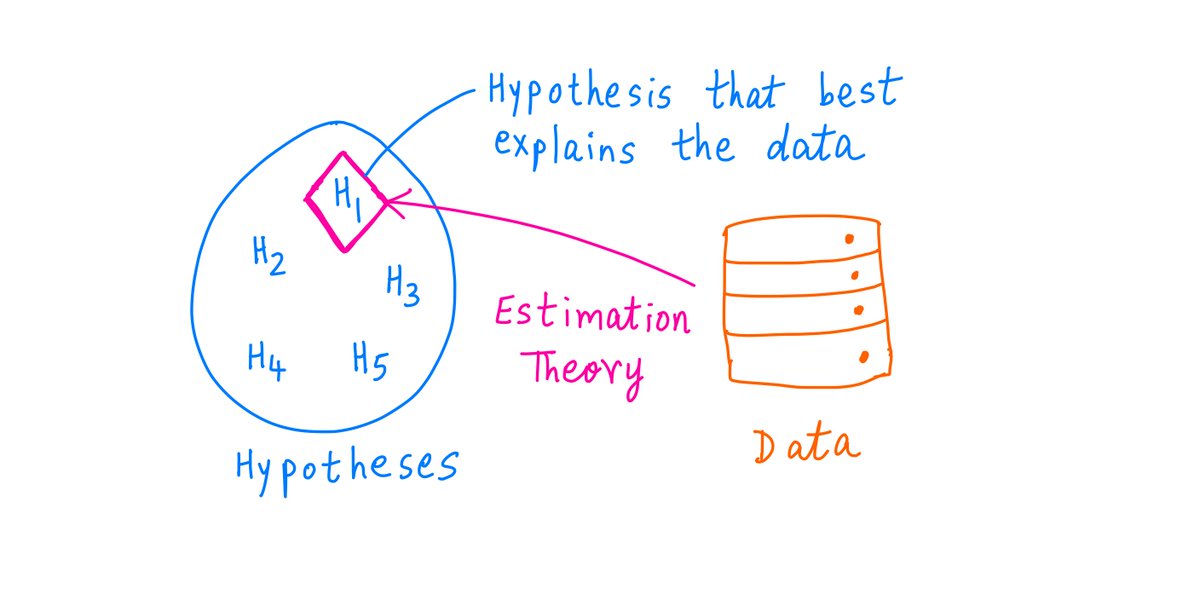
Estimation theory is the science of figuring out the *hypotheses* that best explain these events.
Life is a series of random events.
Estimation theory is the science of figuring out the *hypotheses* that best explain these events.
3/
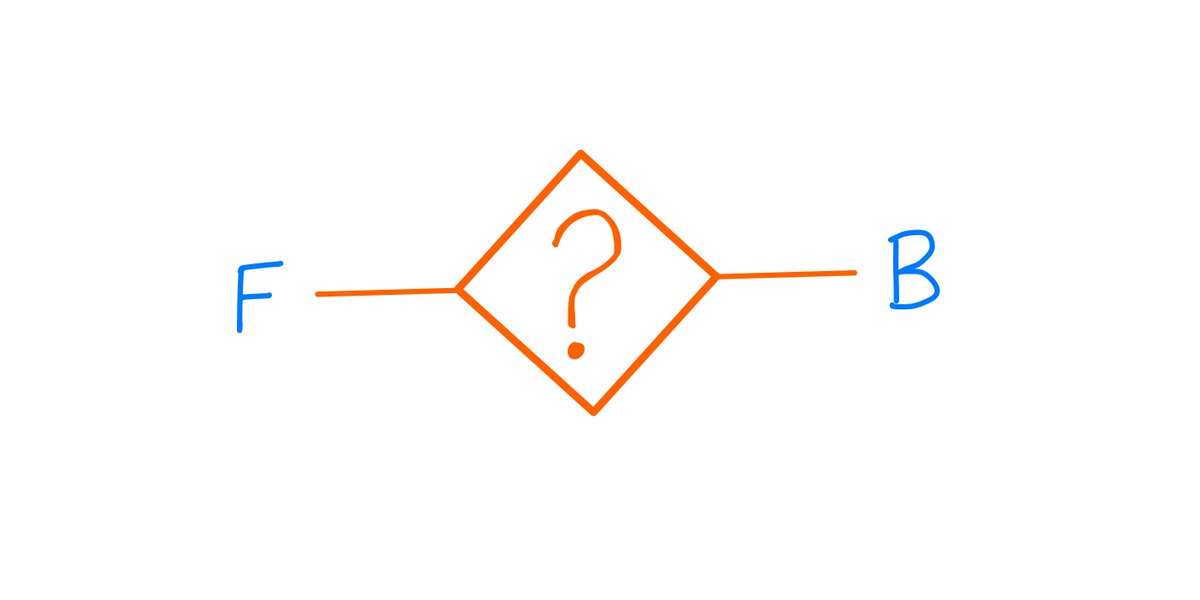
For example, suppose I have 2 coins: F and B.
F is a Fair coin. When you toss it, it has a 50/50 chance of coming up heads or tails.
B, on the other hand, is a Biased coin. It favors heads 60/40 over tails.
For example, suppose I have 2 coins: F and B.
F is a Fair coin. When you toss it, it has a 50/50 chance of coming up heads or tails.
B, on the other hand, is a Biased coin. It favors heads 60/40 over tails.

4/
The coins look, feel, and weigh exactly the same. There's no physical test that can tell them apart.
Now, I give you one of the coins.
Your job is to try and figure out which coin I've given you.
Is it F or is it B?
The coins look, feel, and weigh exactly the same. There's no physical test that can tell them apart.
Now, I give you one of the coins.
Your job is to try and figure out which coin I've given you.
Is it F or is it B?
5/
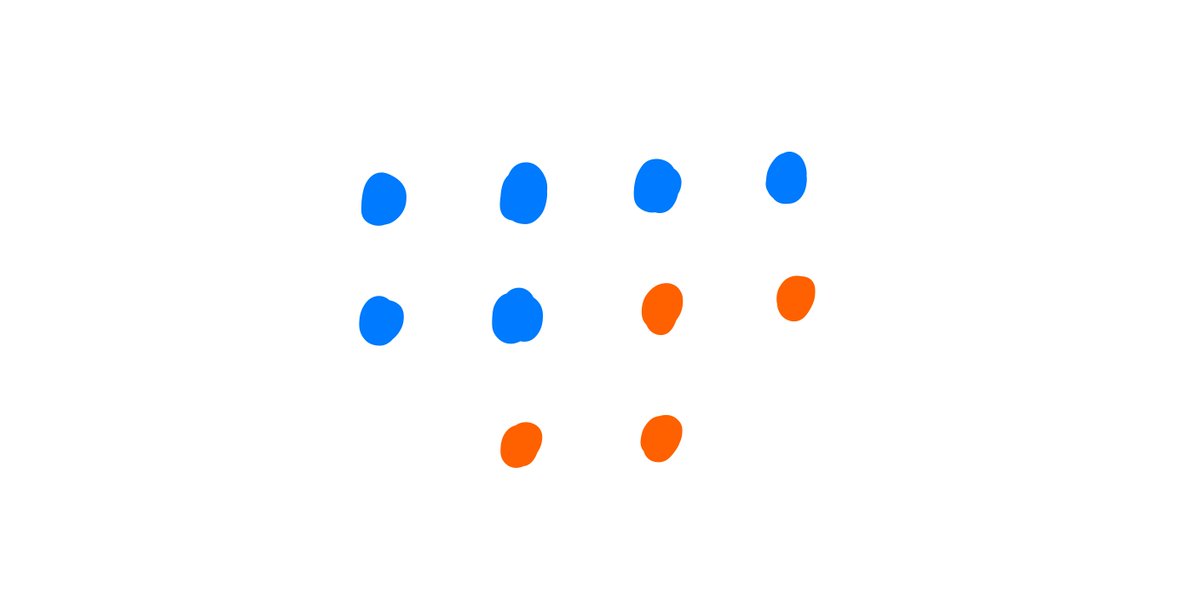
Say you toss the coin 10 times.
You get heads 6 times and tails the other 4 times.
Does that automatically mean that you have the biased coin (B)?
Not necessarily. After all, the fair coin (F) can also give you 6 heads and 4 tails.
Say you toss the coin 10 times.
You get heads 6 times and tails the other 4 times.
Does that automatically mean that you have the biased coin (B)?
Not necessarily. After all, the fair coin (F) can also give you 6 heads and 4 tails.
6/
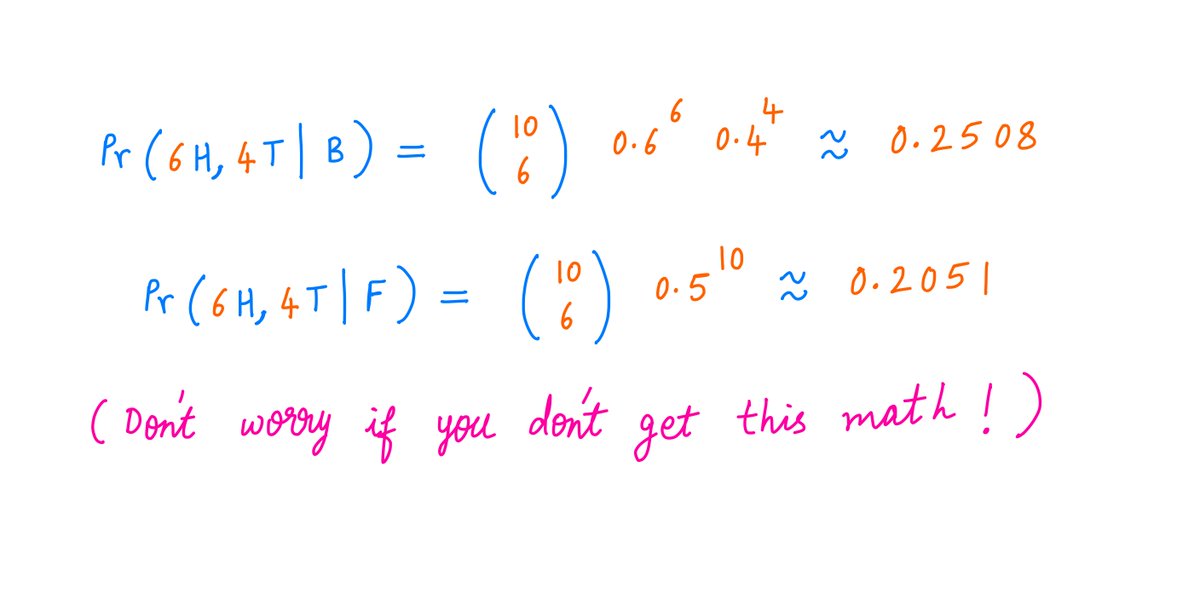
But if you think about it, the *likelihood* of B giving you 6 heads and 4 tails is higher than the likelihood of F giving you the same 6 heads and 4 tails.
B has a ~25.1% chance of giving you this outcome. F only has a ~20.5% chance of giving you this outcome.
But if you think about it, the *likelihood* of B giving you 6 heads and 4 tails is higher than the likelihood of F giving you the same 6 heads and 4 tails.
B has a ~25.1% chance of giving you this outcome. F only has a ~20.5% chance of giving you this outcome.
7/
So we have:
The Facts: 6 heads, 4 tails
Hypothesis 1: You got the biased coin B
Hypothesis 2: You got the fair coin F
Clearly, *both* hypotheses can explain the facts.
But Hypothesis 1 is a slightly *better* explanation than Hypothesis 2.
So we have:
The Facts: 6 heads, 4 tails
Hypothesis 1: You got the biased coin B
Hypothesis 2: You got the fair coin F
Clearly, *both* hypotheses can explain the facts.
But Hypothesis 1 is a slightly *better* explanation than Hypothesis 2.
8/
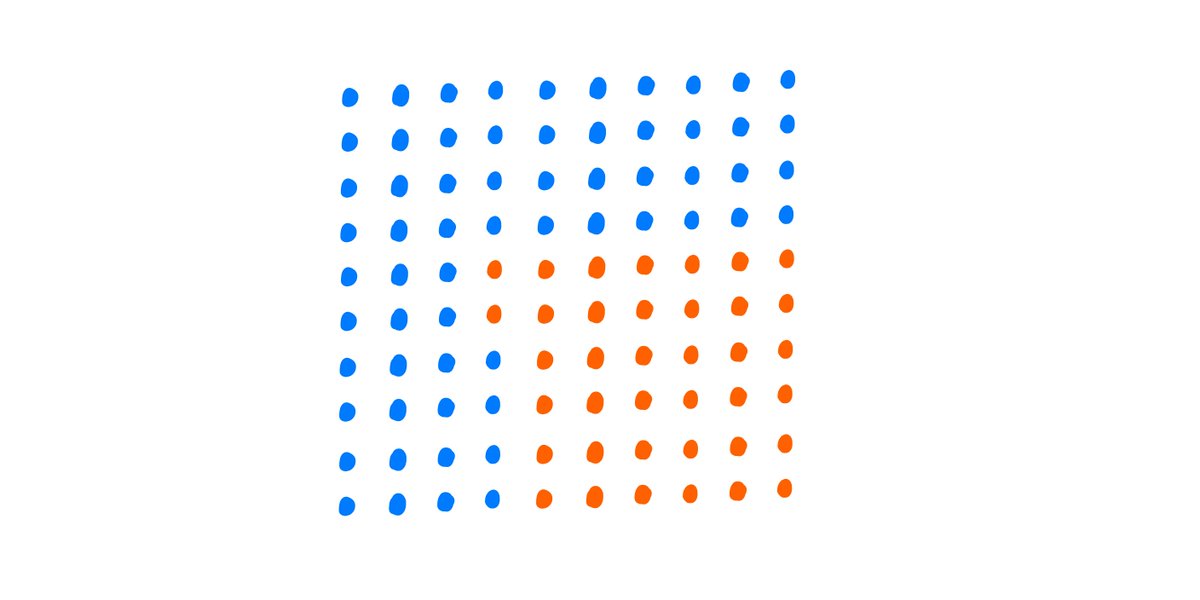
What if you tossed the coin *100* times, and got 62 heads, 38 tails? Not exactly 60/40, but close.
Now, it turns out -- you can be *even more confident* that you have the biased coin.
What if you tossed the coin *100* times, and got 62 heads, 38 tails? Not exactly 60/40, but close.
Now, it turns out -- you can be *even more confident* that you have the biased coin.
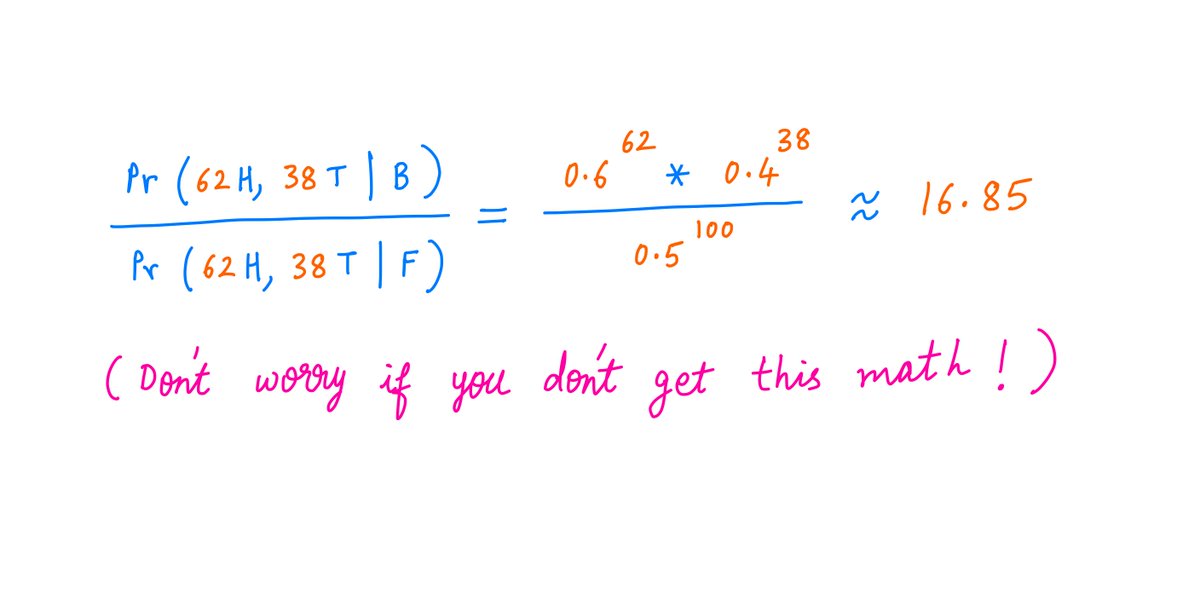
9/
Why?
Because the biased coin has a *much greater probability* of giving you 62 heads and 38 tails compared to the fair coin.
The ratio of the two probabilities is about 17 to 1.
Why?
Because the biased coin has a *much greater probability* of giving you 62 heads and 38 tails compared to the fair coin.
The ratio of the two probabilities is about 17 to 1.
10/
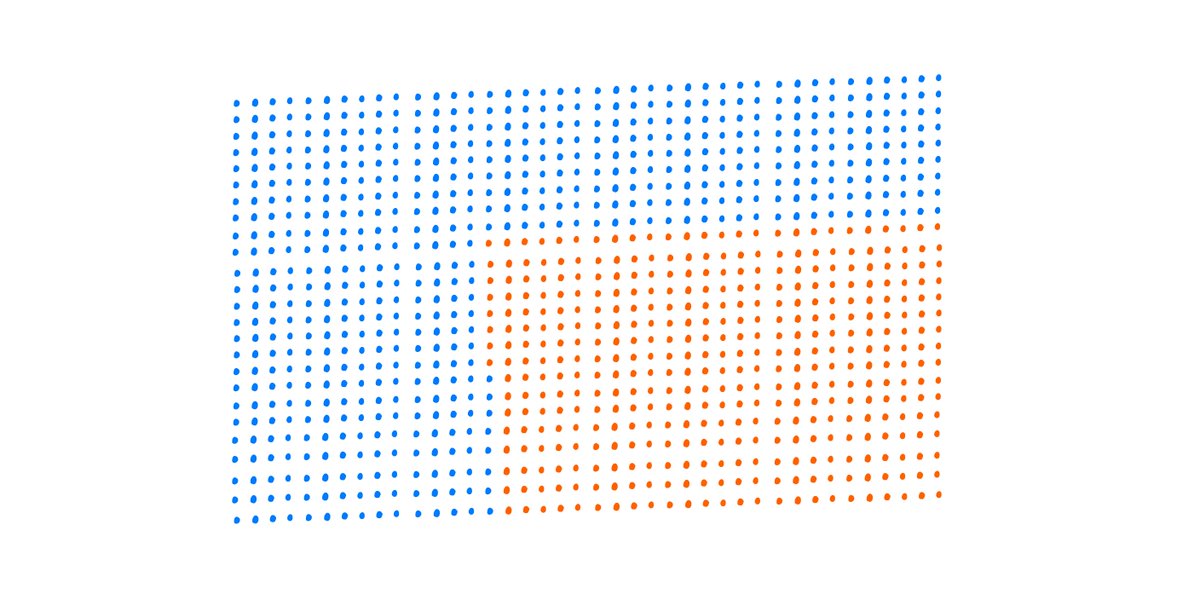
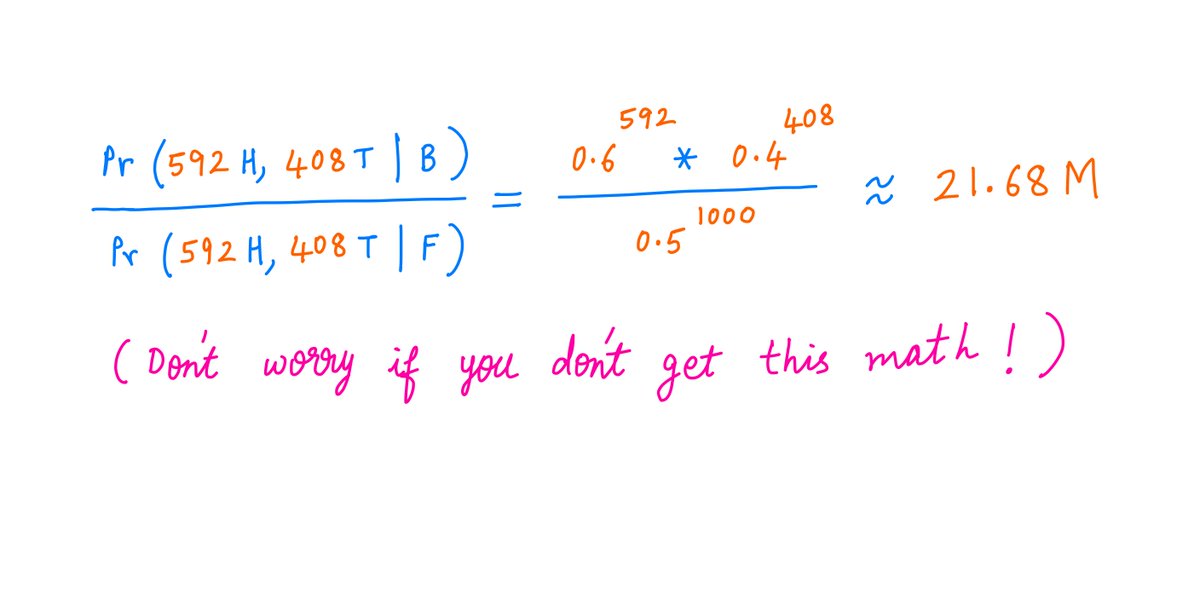
What if you tossed the coin *1000* times, and got 592 heads, 408 tails?
Now you can be *super* confident that you have the biased coin.
Its probability of giving you the observed outcome is a whopping *21.7 million* times the fair coin's probability!
What if you tossed the coin *1000* times, and got 592 heads, 408 tails?
Now you can be *super* confident that you have the biased coin.
Its probability of giving you the observed outcome is a whopping *21.7 million* times the fair coin's probability!
11/
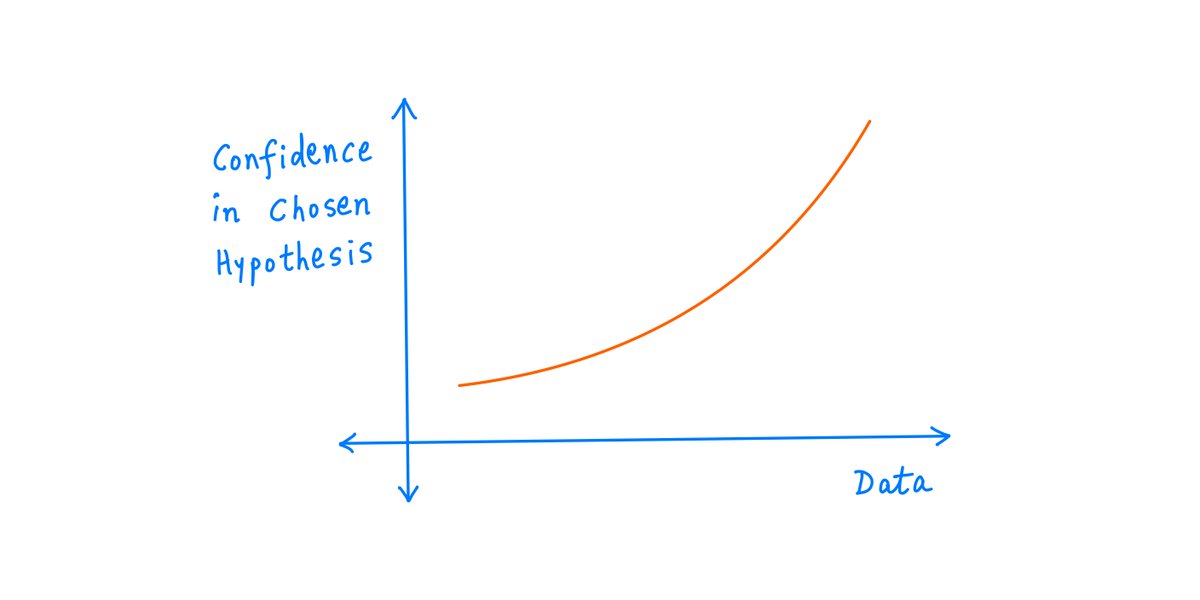
So, the more *data* you gather (here, each coin toss is a data point), the more *confident* you can be that you're picking the right hypothesis.
This seems intuitive -- more data, higher confidence.
And indeed, it's an important result in estimation theory.
So, the more *data* you gather (here, each coin toss is a data point), the more *confident* you can be that you're picking the right hypothesis.
This seems intuitive -- more data, higher confidence.
And indeed, it's an important result in estimation theory.
12/
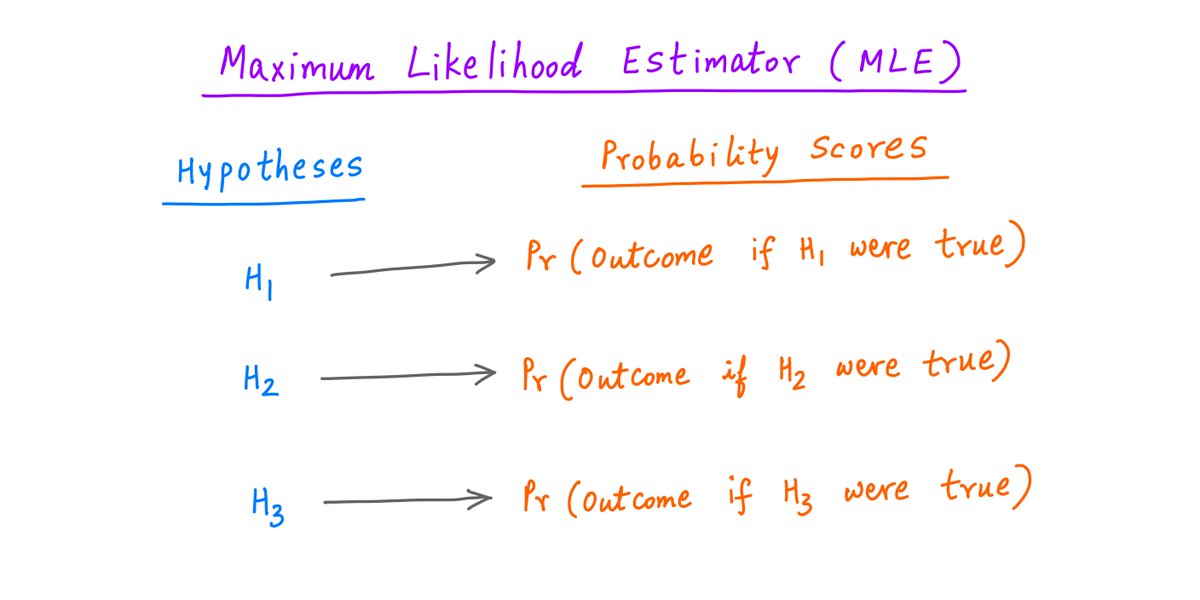
The strategy we've followed so far is called the Maximum Likelihood Estimator (MLE).
We start with a) some competing hypotheses, and b) an experimental outcome.
For each hypothesis, we find the probability that we'd get this outcome -- *if* the hypothesis were indeed true.
The strategy we've followed so far is called the Maximum Likelihood Estimator (MLE).
We start with a) some competing hypotheses, and b) an experimental outcome.
For each hypothesis, we find the probability that we'd get this outcome -- *if* the hypothesis were indeed true.
13/
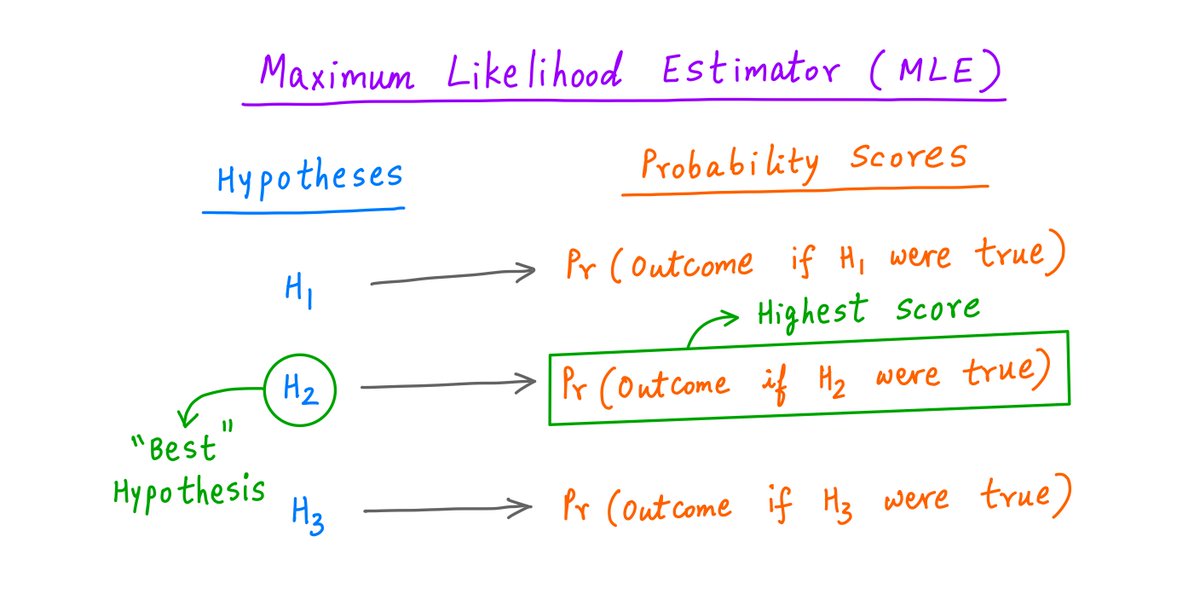
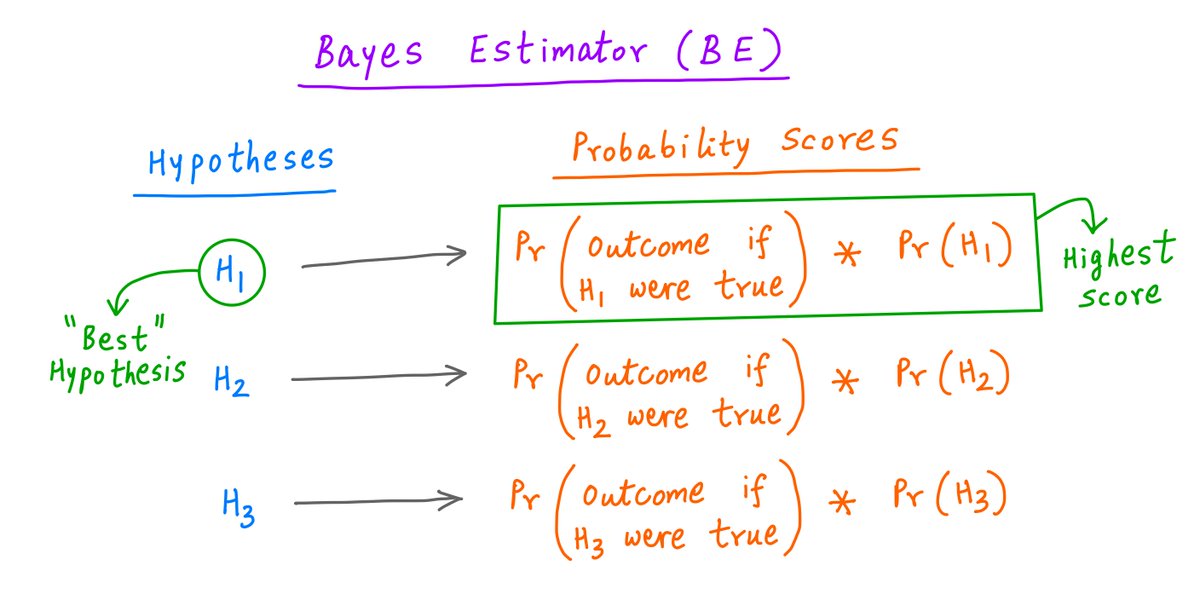
This way, each hypothesis gets a "probability score".
Now we simply select the hypothesis with the highest score.
In the MLE philosophy, that's the hypothesis that "best" explains the outcome we got.
This way, each hypothesis gets a "probability score".
Now we simply select the hypothesis with the highest score.
In the MLE philosophy, that's the hypothesis that "best" explains the outcome we got.
14/
For example, for our "6 heads and 4 tails" outcome, MLE assigned a score of ~25.1% to the "biased coin" hypothesis and ~20.5% to the the "fair coin" hypothesis.
MLE therefore chose "biased coin" as the hypothesis that best explained the observed outcome.
For example, for our "6 heads and 4 tails" outcome, MLE assigned a score of ~25.1% to the "biased coin" hypothesis and ~20.5% to the the "fair coin" hypothesis.
MLE therefore chose "biased coin" as the hypothesis that best explained the observed outcome.
15/
MLE is a pretty good heuristic. Given enough data, it usually picks a reasonable hypothesis.
But it has one important drawback.
It only looks at how likely the *outcome* is under each hypothesis.
It doesn't consider whether the *hypothesis* itself is likely or not.
MLE is a pretty good heuristic. Given enough data, it usually picks a reasonable hypothesis.
But it has one important drawback.
It only looks at how likely the *outcome* is under each hypothesis.
It doesn't consider whether the *hypothesis* itself is likely or not.
16/
So, MLE can end up choosing hypotheses that are highly unlikely to be true.
For example, when I had just 2 coins (F and B), MLE reasonably chose B for the "6 heads, 4 tails" outcome.
But suppose I had a purse of 1000 coins -- with 999 of them fair and exactly 1 biased?
So, MLE can end up choosing hypotheses that are highly unlikely to be true.
For example, when I had just 2 coins (F and B), MLE reasonably chose B for the "6 heads, 4 tails" outcome.
But suppose I had a purse of 1000 coins -- with 999 of them fair and exactly 1 biased?
17/
Let's say, just like before, I gave you 1 coin from my purse.
And just like before, let's say you tossed it 10 times and got 6 heads and 4 tails.
Now, is it more likely that you have a fair coin, or that you have the lone biased coin?
Let's say, just like before, I gave you 1 coin from my purse.
And just like before, let's say you tossed it 10 times and got 6 heads and 4 tails.
Now, is it more likely that you have a fair coin, or that you have the lone biased coin?
18/
Notice that MLE doesn't care *how* the coin got to you -- whether it was picked from a set of 2, or a set of 1000.
MLE's logic is still *exactly* the same. A biased coin is more likely to produce "6 heads, 4 tails" than a fair coin. So the biased hypothesis wins.
Notice that MLE doesn't care *how* the coin got to you -- whether it was picked from a set of 2, or a set of 1000.
MLE's logic is still *exactly* the same. A biased coin is more likely to produce "6 heads, 4 tails" than a fair coin. So the biased hypothesis wins.
19/
It doesn't matter to MLE that the biased hypothesis is a 999-to-1 shot (only 1 out of 1000 coins is biased).
MLE will happily conclude that we hit a 1-in-1000 jackpot -- based *solely* on the 6/4 outcome.
It could be a 1-in-a-quintrillion jackpot -- for all MLE cares.
It doesn't matter to MLE that the biased hypothesis is a 999-to-1 shot (only 1 out of 1000 coins is biased).
MLE will happily conclude that we hit a 1-in-1000 jackpot -- based *solely* on the 6/4 outcome.
It could be a 1-in-a-quintrillion jackpot -- for all MLE cares.
20/
That doesn't quite sound right!
Clearly, we shouldn't pick the biased hypothesis solely based on the 6/4 *outcome*.
We should also consider the 999/1 *prior* probabilities.
That doesn't quite sound right!
Clearly, we shouldn't pick the biased hypothesis solely based on the 6/4 *outcome*.
We should also consider the 999/1 *prior* probabilities.
21/
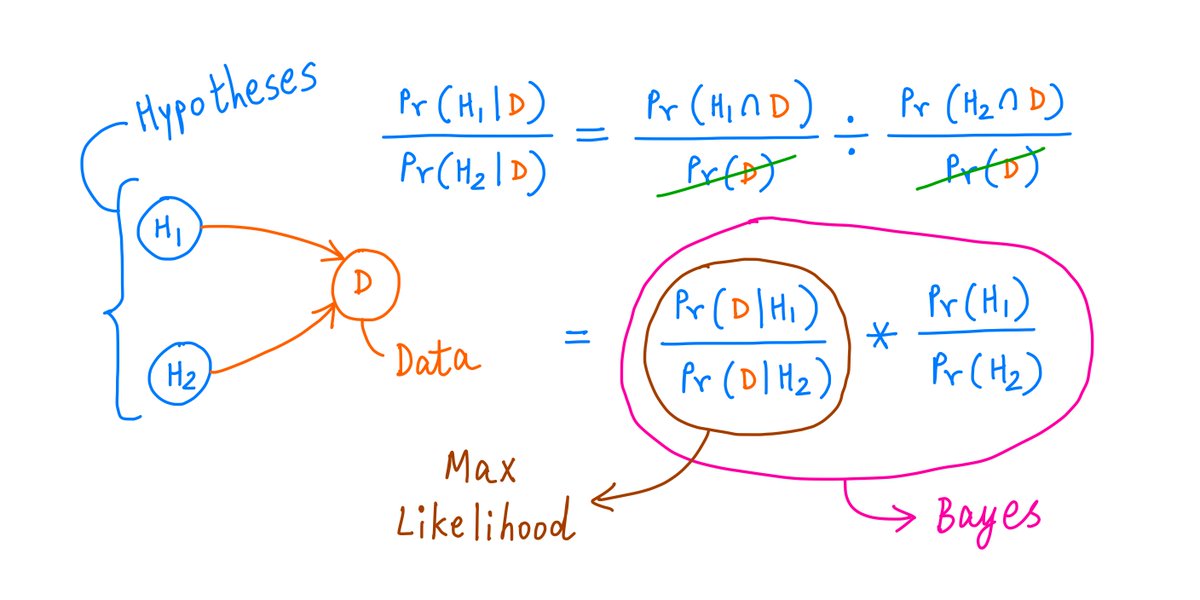
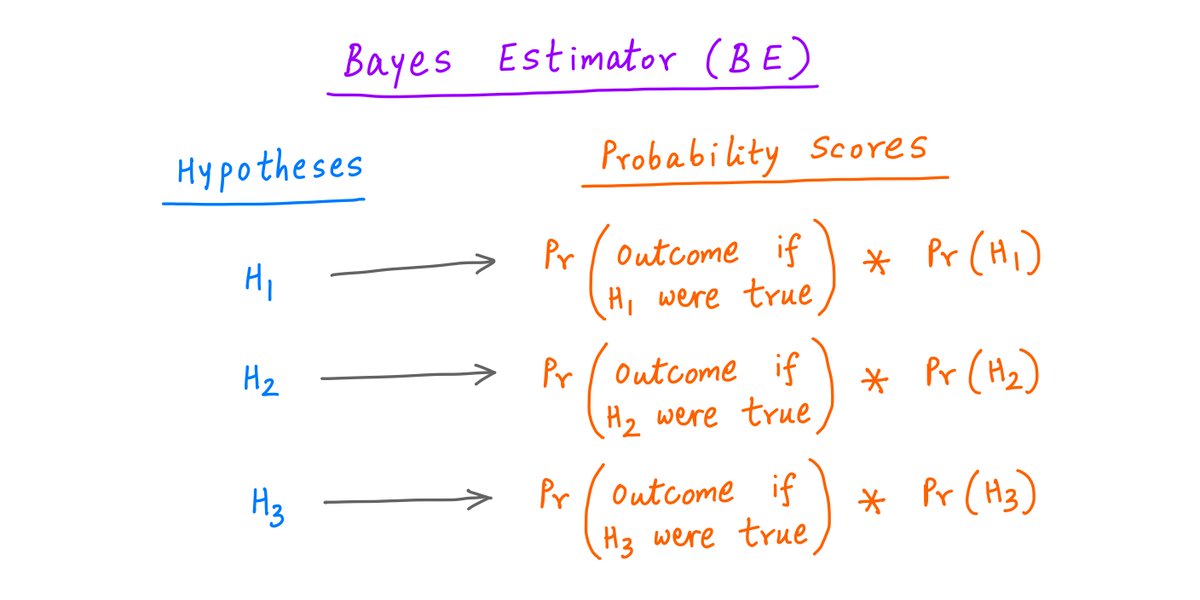
Enter the Bayes' Estimator (BE).
BE considers *both* -- the likelihood of the outcome under each hypothesis, *and* the likelihood of each hypothesis being true in the first place.
These likelihoods are *multiplied* together -- and that's the score each hypothesis gets.
Enter the Bayes' Estimator (BE).
BE considers *both* -- the likelihood of the outcome under each hypothesis, *and* the likelihood of each hypothesis being true in the first place.
These likelihoods are *multiplied* together -- and that's the score each hypothesis gets.
22/
Then the process is the same as MLE.
The hypothesis with the highest score is deemed to be the *best*.
Then the process is the same as MLE.
The hypothesis with the highest score is deemed to be the *best*.
23/
For example, with our 999-to-1 prior probabilities favoring fair coins, BE picks "fair" over "biased" for both "6 heads, 4 tails" and "62 heads, 38 tails".
A biased coin is more likely to yield these outcomes, but the fair coins' 999-to-1 advantage wins out.
For example, with our 999-to-1 prior probabilities favoring fair coins, BE picks "fair" over "biased" for both "6 heads, 4 tails" and "62 heads, 38 tails".
A biased coin is more likely to yield these outcomes, but the fair coins' 999-to-1 advantage wins out.
24/
But for the "592 heads, 408 tails" outcome, BE chooses "biased" over "fair". That's because, in this case, a fair coin has such a low chance of producing the observed outcome that even with a 999-to-1 advantage, it loses to the biased coin.
But for the "592 heads, 408 tails" outcome, BE chooses "biased" over "fair". That's because, in this case, a fair coin has such a low chance of producing the observed outcome that even with a 999-to-1 advantage, it loses to the biased coin.
25/
Clearly, BE is superior to MLE. It takes more things into account.
Why even bother with MLE then?
Clearly, BE is superior to MLE. It takes more things into account.
Why even bother with MLE then?
26/
Well, for one thing, BE requires knowledge (or estimates) of prior probabilities. This isn't always possible.
Most of the time, we have a coin and we want to find out if it's fair. We don't really know where the coin came from.
Well, for one thing, BE requires knowledge (or estimates) of prior probabilities. This isn't always possible.
Most of the time, we have a coin and we want to find out if it's fair. We don't really know where the coin came from.
27/
Second, with enough data points, MLE usually reaches the same conclusions as BE.
Large sample sizes *will* eventually overcome even heavily lopsided prior probabilities (like 999-to-1) -- as we saw with the "592 heads, 408 tails" example.
Second, with enough data points, MLE usually reaches the same conclusions as BE.
Large sample sizes *will* eventually overcome even heavily lopsided prior probabilities (like 999-to-1) -- as we saw with the "592 heads, 408 tails" example.
28/
Let's do another example.
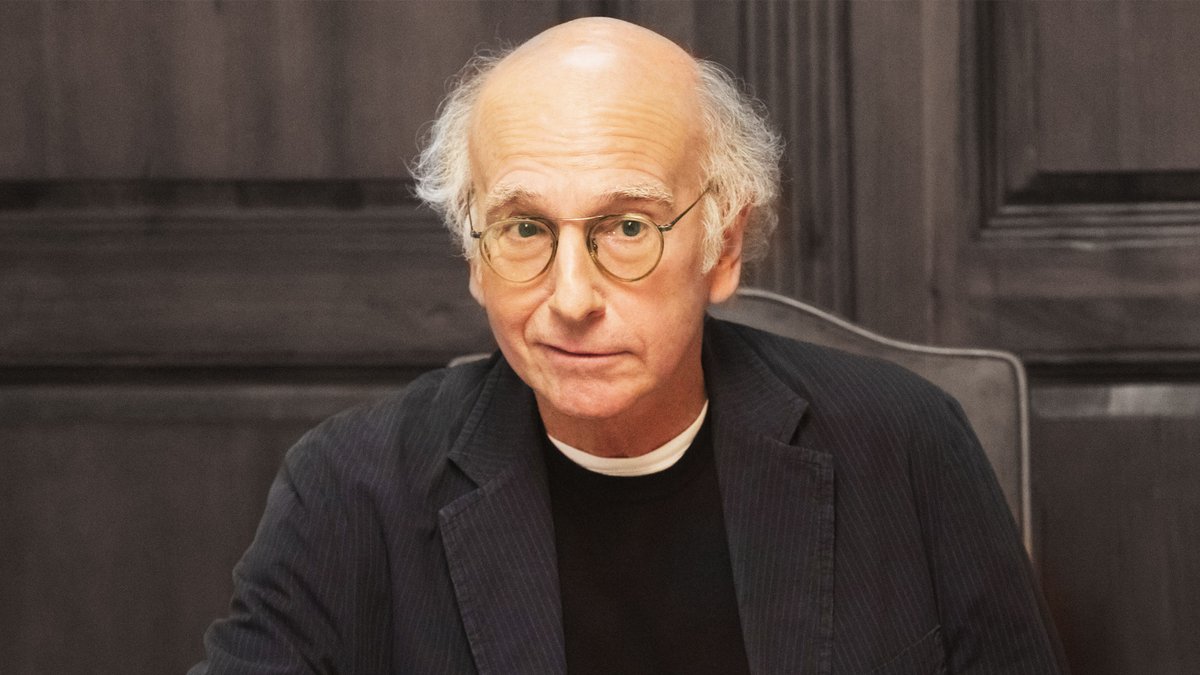
Imagine that you're Larry David -- the co-creator of Seinfeld and Curb Your Enthusiasm. (Wonderful shows if you haven't watched them!)
Recently, you noticed a couple instances where the weatherman predicted rain, but the skies were clear.
Let's do another example.
Imagine that you're Larry David -- the co-creator of Seinfeld and Curb Your Enthusiasm. (Wonderful shows if you haven't watched them!)
Recently, you noticed a couple instances where the weatherman predicted rain, but the skies were clear.
29/
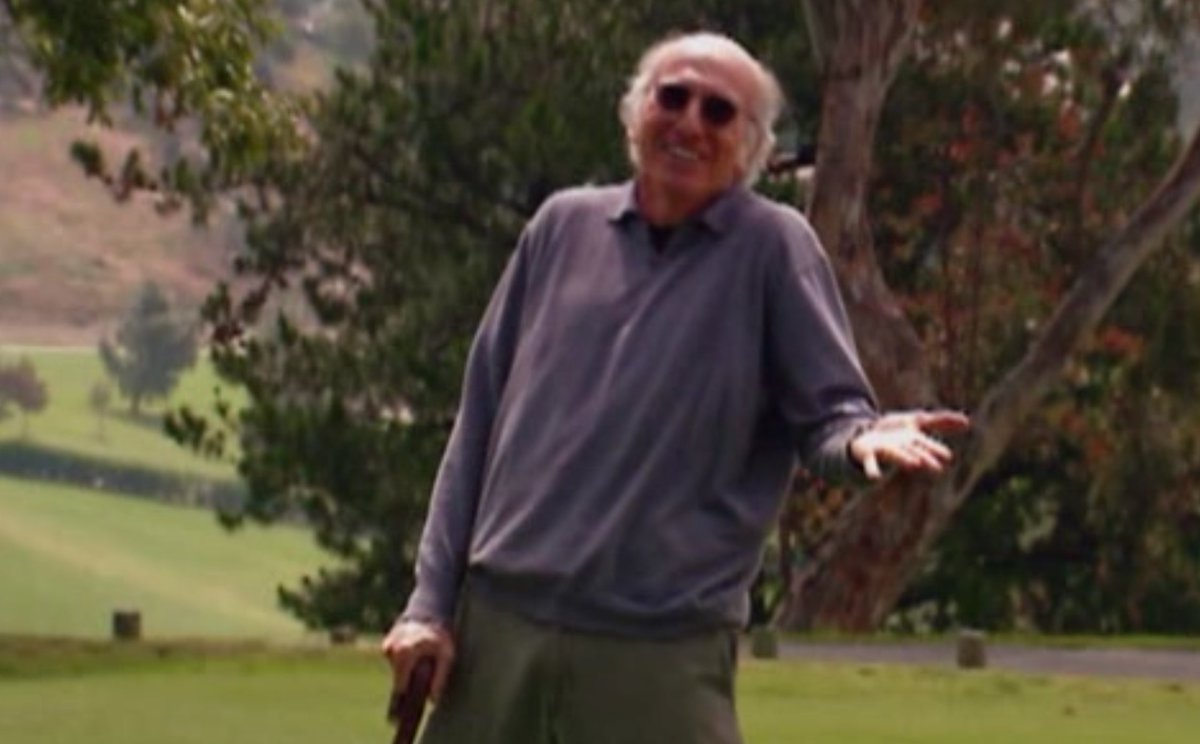
On one such occasion, you saw the weatherman playing golf.
Because he had predicted rain, everyone else had canceled their golf plans.
And so, the weatherman and his buddies had the whole course to themselves!
On one such occasion, you saw the weatherman playing golf.
Because he had predicted rain, everyone else had canceled their golf plans.
And so, the weatherman and his buddies had the whole course to themselves!
30/
So, you have a sneaking suspicion that the weatherman is deliberately calling rain on sunny days -- so he can hit the empty links with his friends. This is your hypothesis.
Well, you can use estimation theory to test this hypothesis!
So, you have a sneaking suspicion that the weatherman is deliberately calling rain on sunny days -- so he can hit the empty links with his friends. This is your hypothesis.
Well, you can use estimation theory to test this hypothesis!
31/
Let's say about 80% of the days are sunny where you live, and 20% are rainy.
And let's say *unmanipulated* weather forecasts have a 90% accuracy. That is, if a day is sunny, the forecast will predict sun 90% of the time and rain the other 10%. And vice-versa for rainy days.
Let's say about 80% of the days are sunny where you live, and 20% are rainy.
And let's say *unmanipulated* weather forecasts have a 90% accuracy. That is, if a day is sunny, the forecast will predict sun 90% of the time and rain the other 10%. And vice-versa for rainy days.
32/
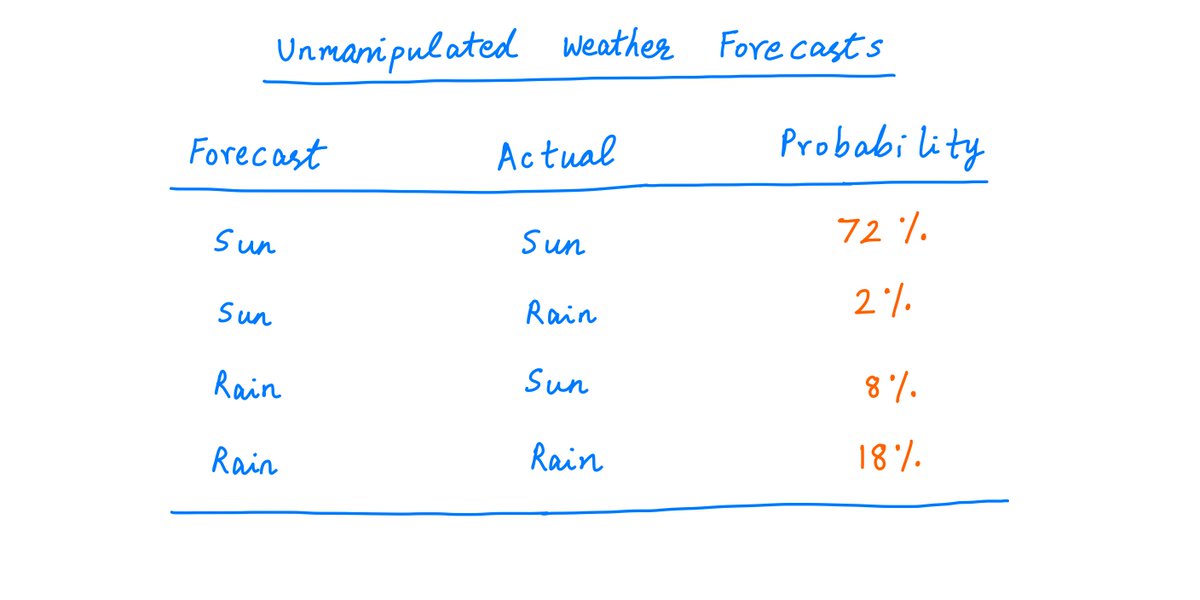
So, if the weatherman is being honest, your data points will come from the distribution below.
For example, ~72% of the time, you'll get a sunny forecast and a sunny day. About 8% of the time, the forecast will call for rain but it'll actually be a sunny day. And so on.
So, if the weatherman is being honest, your data points will come from the distribution below.
For example, ~72% of the time, you'll get a sunny forecast and a sunny day. About 8% of the time, the forecast will call for rain but it'll actually be a sunny day. And so on.
33/
But what if the weatherman is deliberately calling rain on (expected) sunny days -- as you suspect?
The weatherman can't call rain on *all* such days -- or he'll quickly be caught.
So let's say he calls rain on expected sunny days about 25% of the time.
But what if the weatherman is deliberately calling rain on (expected) sunny days -- as you suspect?
The weatherman can't call rain on *all* such days -- or he'll quickly be caught.
So let's say he calls rain on expected sunny days about 25% of the time.
34/
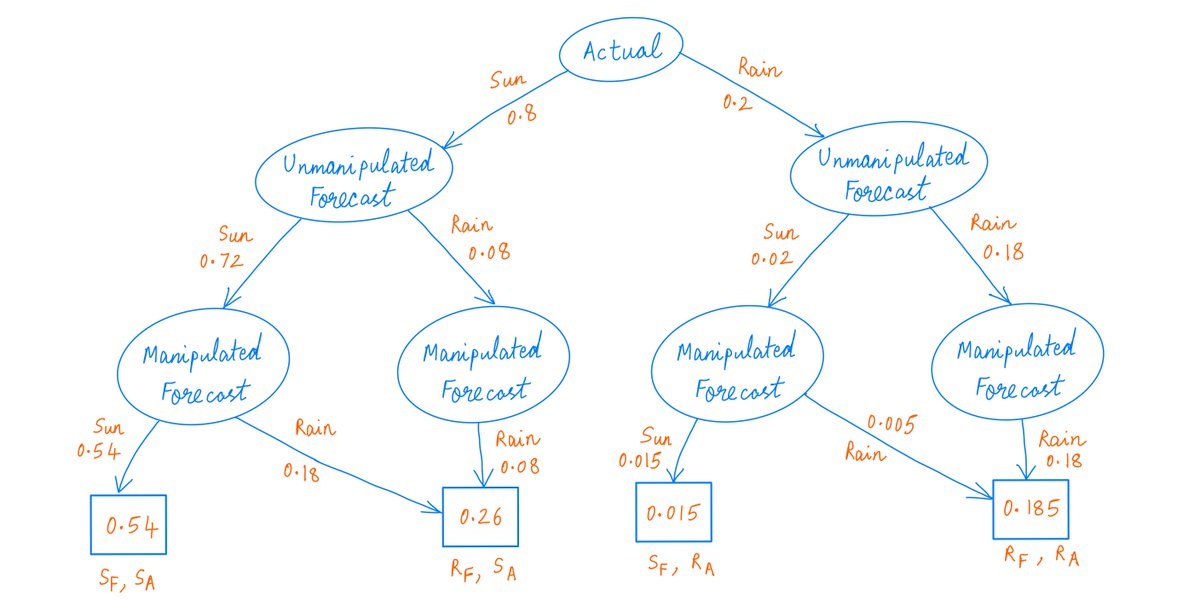
Here's an Algebraic Decision Diagram showing the various possible outcomes and their probabilities -- assuming the weatherman is lying.
The numbers on each branch and in the terminal nodes are cumulative probabilities. (S_F, R_A) means (sunny forecast, rainy day) and so on.
Here's an Algebraic Decision Diagram showing the various possible outcomes and their probabilities -- assuming the weatherman is lying.
The numbers on each branch and in the terminal nodes are cumulative probabilities. (S_F, R_A) means (sunny forecast, rainy day) and so on.
35/
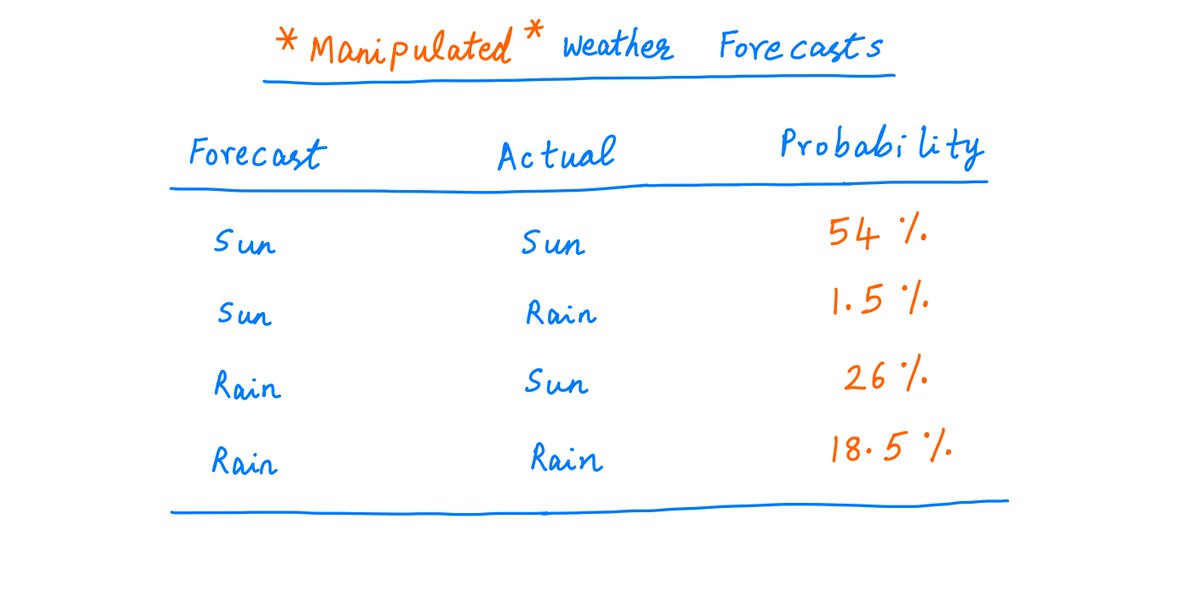
And here's the resulting *manipulated* probability distribution.
As you can see, the percentage of days forecast to be sunny and also actually sunny drops from 72% to 54%. And so on.
And here's the resulting *manipulated* probability distribution.
As you can see, the percentage of days forecast to be sunny and also actually sunny drops from 72% to 54%. And so on.
36/
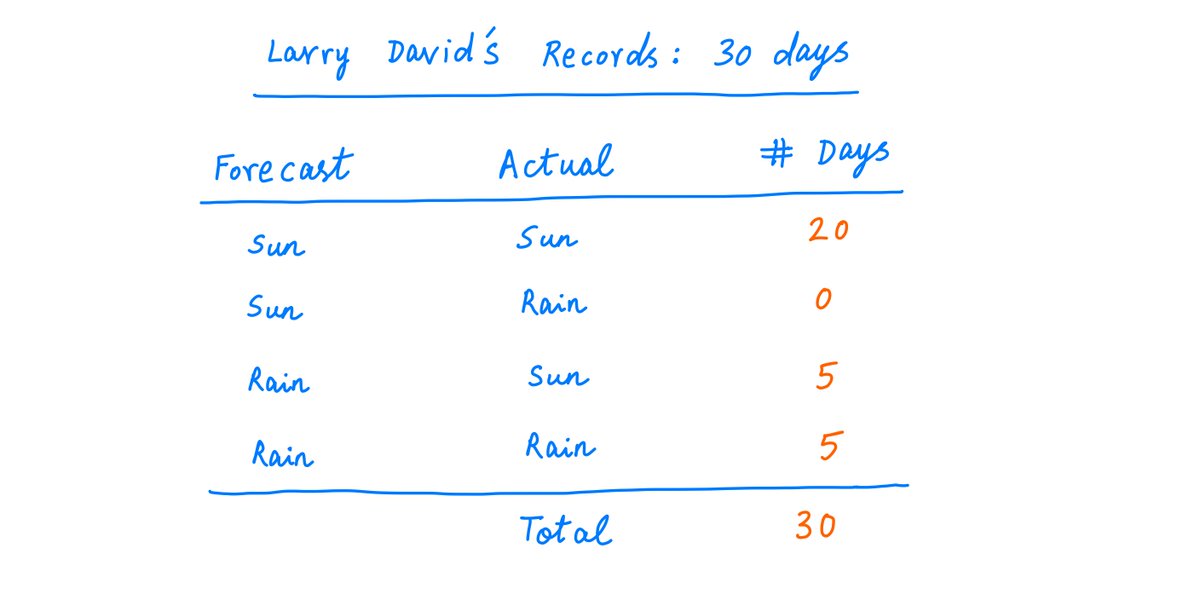
So, all you need to do is keep records of what was forecast and what actually happened.
Over time, you'll be able to determine with high confidence whether the weatherman is lying.
For example, suppose you keep records for 30 days, and observe the following:
So, all you need to do is keep records of what was forecast and what actually happened.
Over time, you'll be able to determine with high confidence whether the weatherman is lying.
For example, suppose you keep records for 30 days, and observe the following:
37/
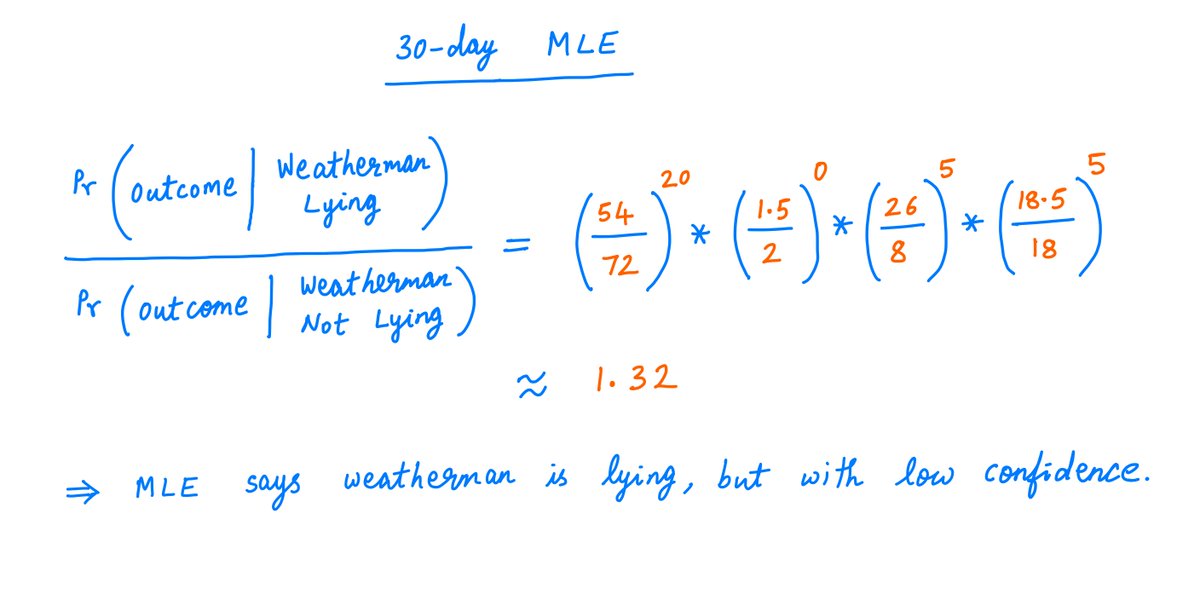
From this data, MLE predicts that the weatherman is lying (see probability calculations below) -- but not with any great degree of confidence. The ratio of probabilities is only ~1.32 to 1.
From this data, MLE predicts that the weatherman is lying (see probability calculations below) -- but not with any great degree of confidence. The ratio of probabilities is only ~1.32 to 1.
38/
39/
So you need more data.
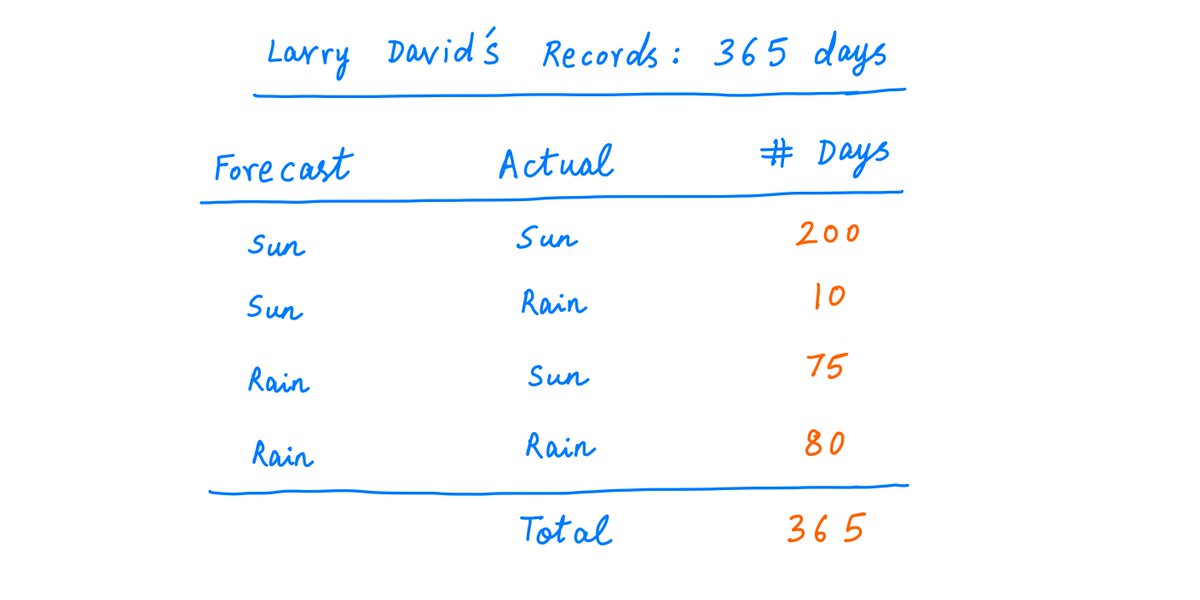
Let's say you keep records for 365 days, and they look like this:
So you need more data.
Let's say you keep records for 365 days, and they look like this:
40/
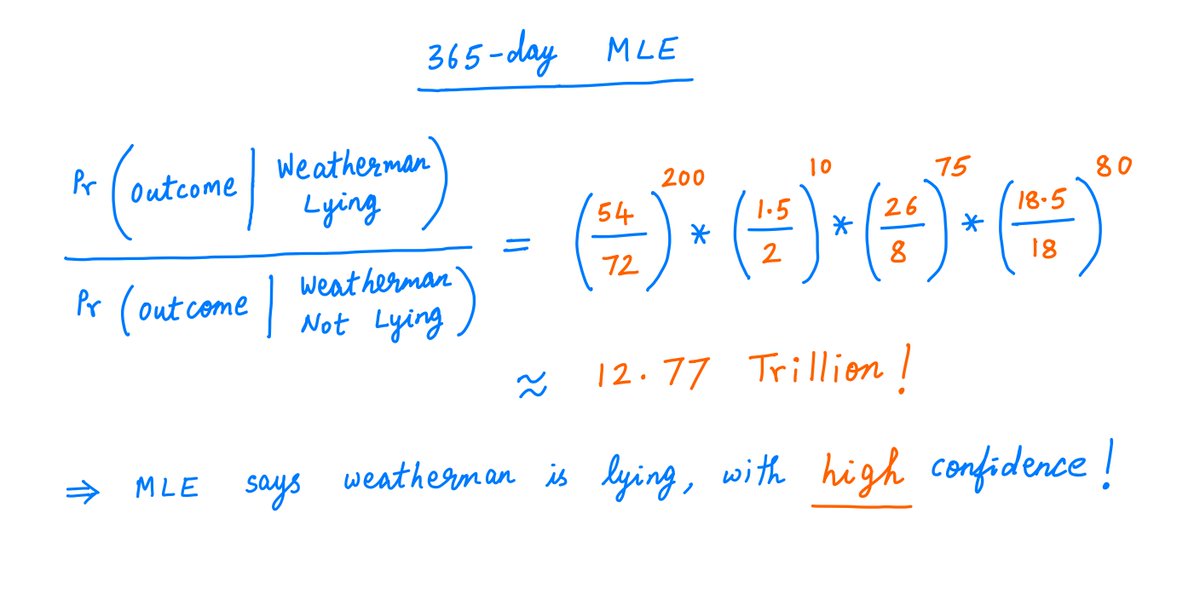
Now, it's virtually a slam dunk.
MLE can predict with very high confidence that the weatherman is lying. The ratio of probabilities is about 12.77 trillion!
That's pretty, pretty, pretty, pretty certain.
Now, it's virtually a slam dunk.
MLE can predict with very high confidence that the weatherman is lying. The ratio of probabilities is about 12.77 trillion!
That's pretty, pretty, pretty, pretty certain.
41/
42/
Key lesson: Think probabilistically, and be willing to challenge your own hypotheses.
When new data arrives, ask yourself: if my opinion is right, what are the chances of this outcome? And if I'm wrong, what are the chances then?
That's the essence of estimation theory.
Key lesson: Think probabilistically, and be willing to challenge your own hypotheses.
When new data arrives, ask yourself: if my opinion is right, what are the chances of this outcome? And if I'm wrong, what are the chances then?
That's the essence of estimation theory.
43/
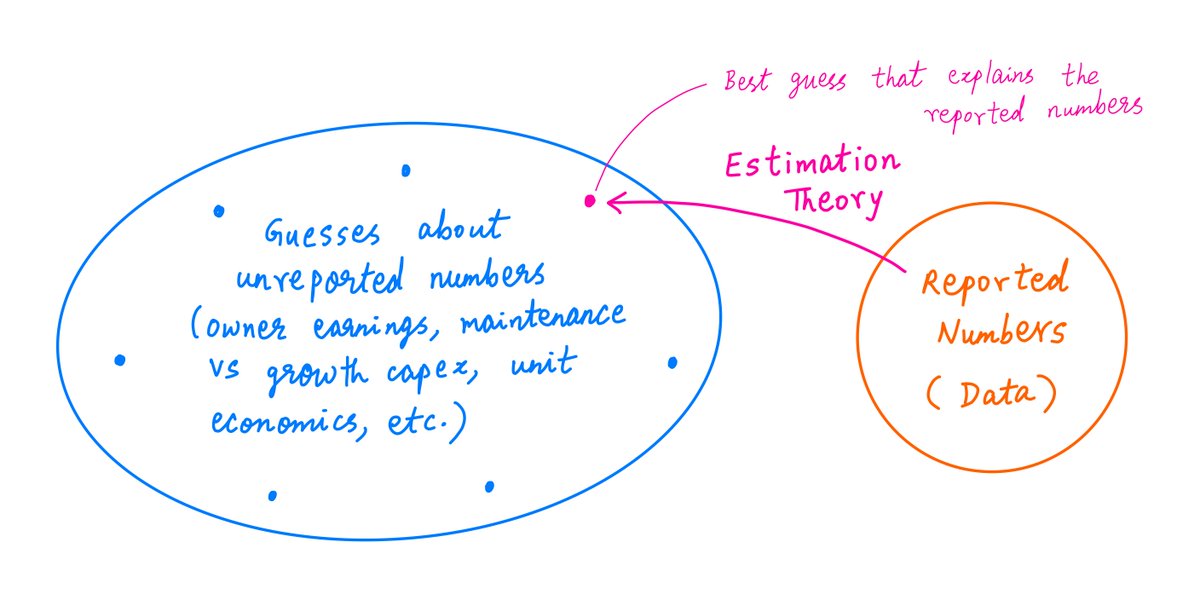
This is especially relevant to investing and analyzing companies.
Often, companies don't report the numbers we really want -- owner earnings, growth vs maintenance capex, unit economics, etc.
We have to tease out these *unreported* numbers from the reported numbers.
This is especially relevant to investing and analyzing companies.
Often, companies don't report the numbers we really want -- owner earnings, growth vs maintenance capex, unit economics, etc.
We have to tease out these *unreported* numbers from the reported numbers.
44/
One way out may be to entertain plausible *guesses* regarding the unreported numbers (including their prior probabilities) -- and then try to use the tools of estimation theory (MLE, BE, etc.) to zero in on the guesses that best explain the reported numbers.
One way out may be to entertain plausible *guesses* regarding the unreported numbers (including their prior probabilities) -- and then try to use the tools of estimation theory (MLE, BE, etc.) to zero in on the guesses that best explain the reported numbers.
45/
So: given some hypotheses and some data, estimation theory figures out which hypothesis is most likely to be true.
A less quantitative rule is Occam's Razor: it says that the simplest hypothesis (perhaps the one that makes the fewest assumptions) is usually the right one.
So: given some hypotheses and some data, estimation theory figures out which hypothesis is most likely to be true.
A less quantitative rule is Occam's Razor: it says that the simplest hypothesis (perhaps the one that makes the fewest assumptions) is usually the right one.
46/
But I prefer to say that the *most likely* hypothesis is most likely to be the right one. That's a tautology right there!
For more on Occam's Razor, here's a thread written by my friend @SahilBloom:
But I prefer to say that the *most likely* hypothesis is most likely to be the right one. That's a tautology right there!
For more on Occam's Razor, here's a thread written by my friend @SahilBloom:
https://twitter.com/SahilBloom/status/1326895385445593088?s=20
47/
I also recommend watching this superb ~16 min video by @3blue1brown about Bayes' Rule.
Bayes' Rule is a fundamental cornerstone of probability -- and it's where the Bayes' Estimator (BE) in this thread comes from.
I also recommend watching this superb ~16 min video by @3blue1brown about Bayes' Rule.
Bayes' Rule is a fundamental cornerstone of probability -- and it's where the Bayes' Estimator (BE) in this thread comes from.
48/
If you're still with me, I salute you. Your enthusiasm cannot be curbed!
Thanks for reading. Enjoy your weekend. Happy Diwali!
/End
If you're still with me, I salute you. Your enthusiasm cannot be curbed!
Thanks for reading. Enjoy your weekend. Happy Diwali!
/End
• • •
Missing some Tweet in this thread? You can try to
force a refresh