So last night, @mngop Chair @jkcarnah claimed "extreme abnormalities and statistical variations from Minnesota's historic voter trends” in the 2020 election. I delved into her specific claims, which turned out to be vague, off-base or simply wrong: mprnews.org/story/2020/11/…
@mngop @jkcarnah 2/ For example, @jkcarnah wrote, "Democrats saw declining vote totals in two consecutive presidential elections in Wright County, including a 14.8% decline in 2016, then in 2020 there was a sudden surge twice as large for Biden with 52.1% growth.” But…
@mngop @jkcarnah 3/ This is a claim based on total votes for Democratic presidential candidates, and ignores the fact that 2020 saw a massive turnout spike and a collapse in support for 3rd party candidates. Biden got 8K more votes in Wright County — and so did Trump!
@mngop @jkcarnah 4/ In fact, by both percent of the vote or net victory margin, Trump did BETTER in Wright County than he did in 2016. The exact same is true for another county @jkcarnah cited as abnormal, Sherburne. mprnews.org/story/2020/11/…
@mngop @jkcarnah 5/ Another of the counties cited, Carver, DID in fact shift to the left in 2020. But it’s not true that Carver County has been "shifting away from Democrats since 2008.” It’s actually been shifting LEFT. GOP vote share:
2004 62.8%, 2008 56.7%, 2012 58.9%, 2016 52.2%, 2020 51.2%
@mngop @jkcarnah 6/ Anoka County saw a huge swing away from Trump in 2020. But when you look at "historic voter trends,” it’s 2016 that’s “abnormal” in Anoka, not 2020. (& the 2016 spike in Trump’s margin was driven by Ds voting 3rd-party. Trump got fewer Anoka votes in 2016 than Romney.) Image
@mngop @jkcarnah 7/ St. Louis County has definitely move to the right in the Trump era. And Trump’s net margin got a bit worse there in 2020, as turnout rose and 3rd party voters went to Biden. But Trump's share of the vote in St. Louis went up, from 39.7% to 41%!
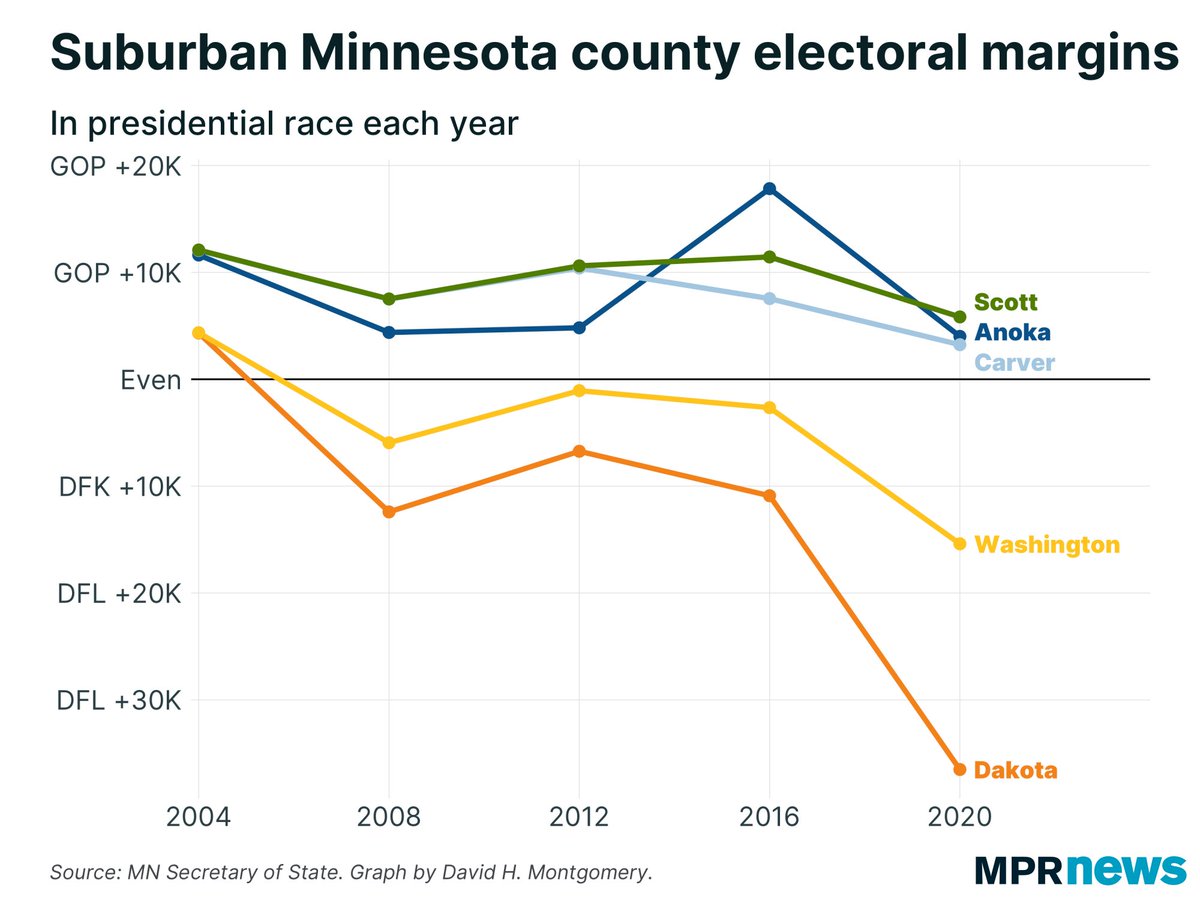
@mngop @jkcarnah 8/ The only county cited by Carnahan where Trump did worse in 2020 in a deviation from recent trends was Scott. But even here the magnitude was small: Trump got 53.2% in 2016 and 52.1% in 2020 — a 1.1-point shift in an election where Biden did 5.5 points better.
@mngop @jkcarnah 9/ And Scott County’s shift to the left wasn’t out of nowhere — it was in line with a shift against Trump in suburban counties seen elsewhere in Minnesota and around the nation. Every Twin Cities suburban county moved left in 2020; so did the suburban parts of Hennepin & Ramsey. Image
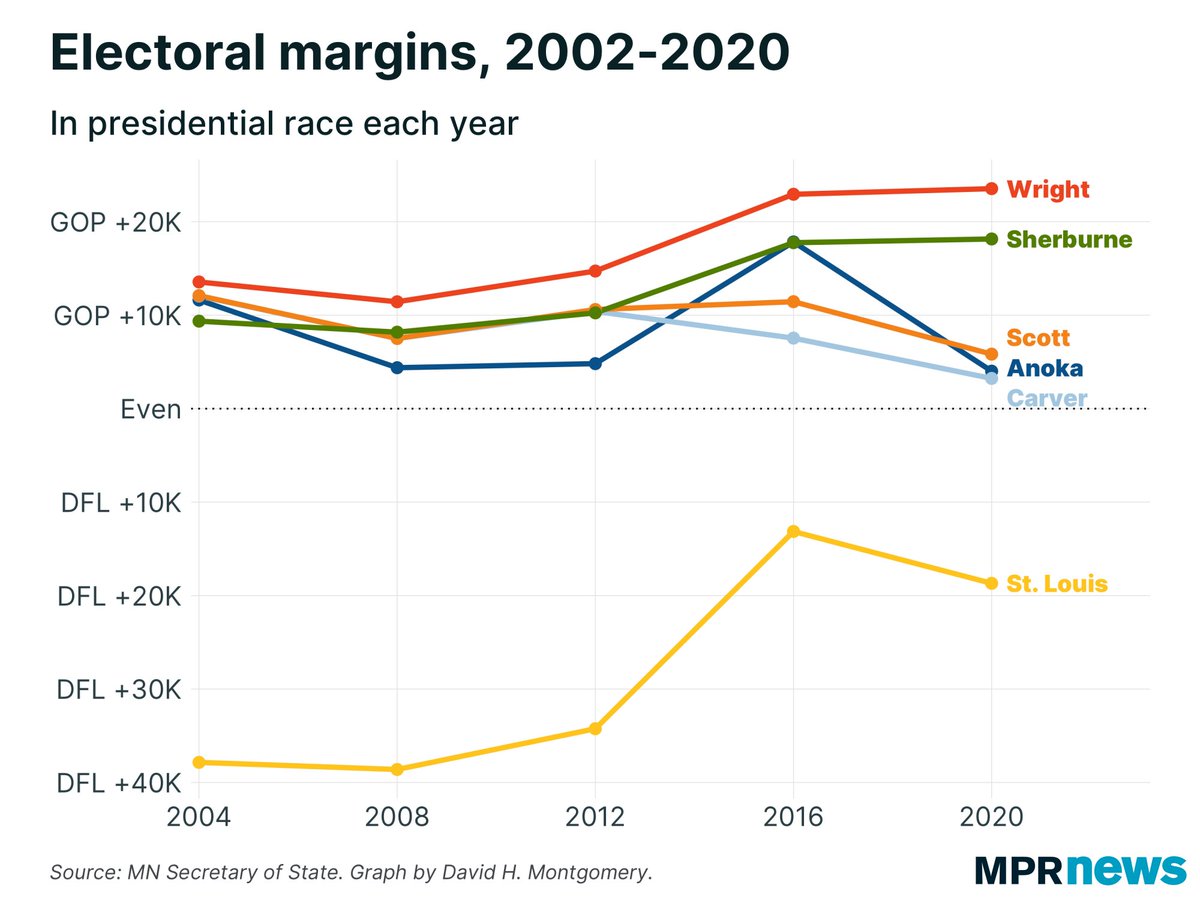
@mngop @jkcarnah 10/ Here you can see the net Republican vote margin for all six counties cited by @jkcarnah as "data abnormalities”: Image
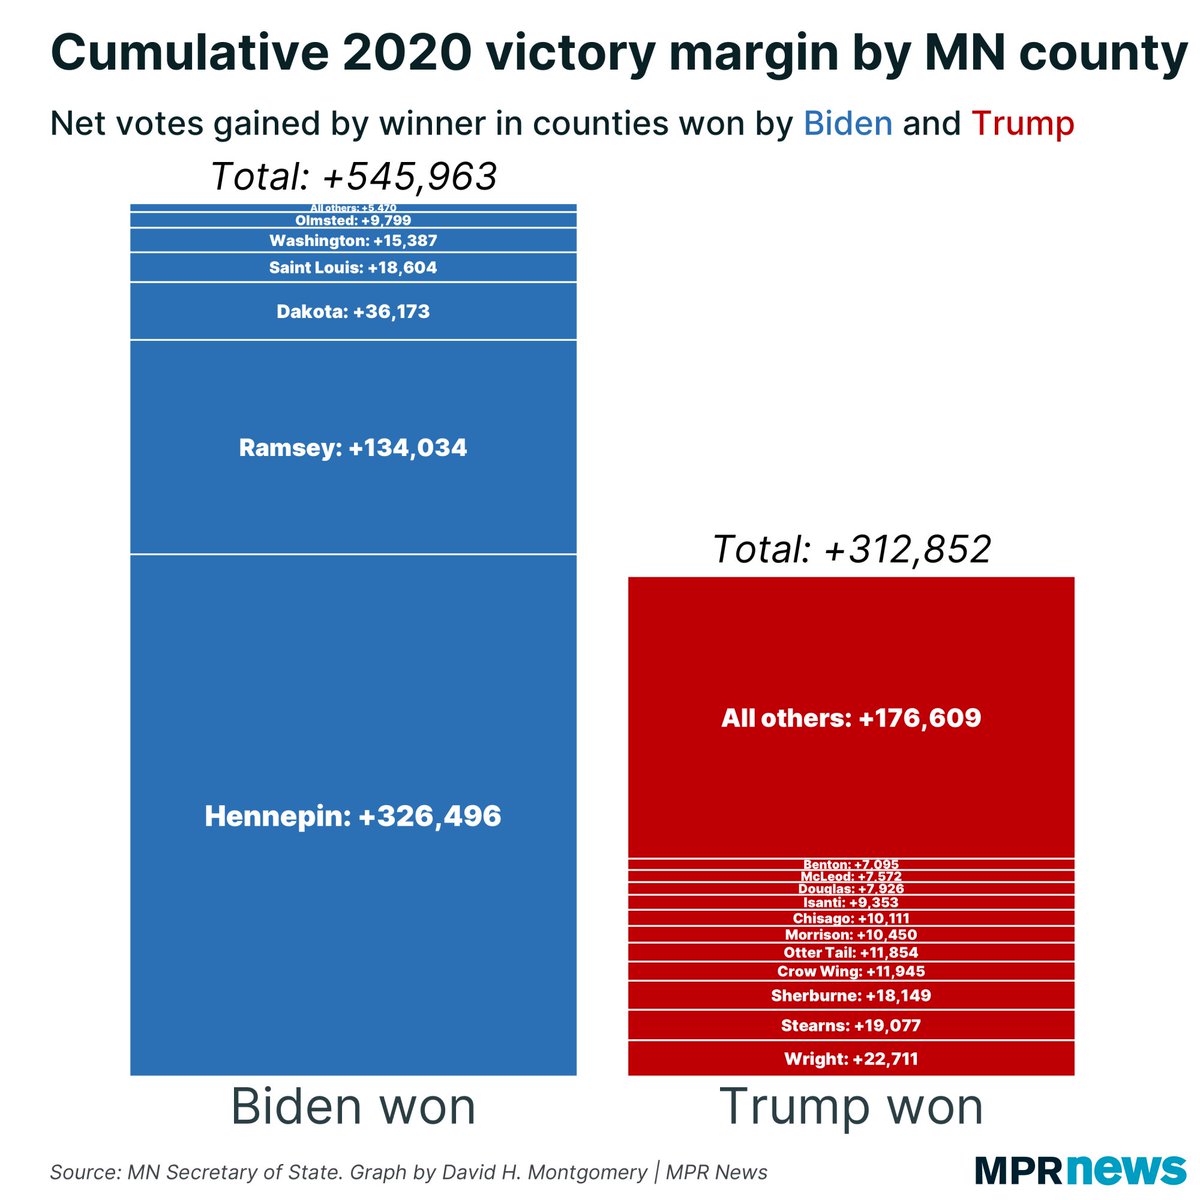
@mngop @jkcarnah 11/ And on top of all of this, even if Carnahan’s claims were true about these six counties, it wouldnt have mattered much in an election where Biden netted more votes out of Hennepin County alone than Trump did in all 74 counties he won combined: Image
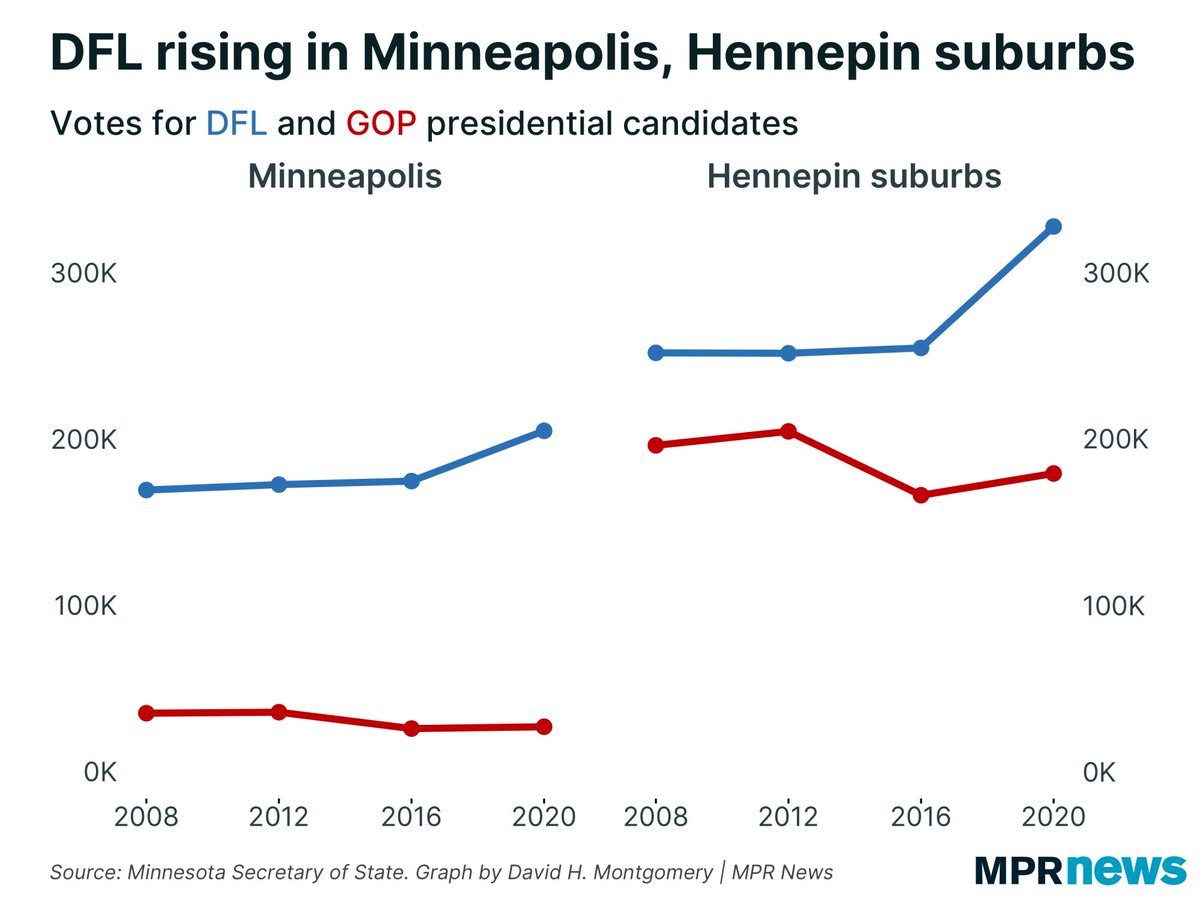
@mngop @jkcarnah 12/ For those curious about Biden’s expanded Hennepin County margin (itself the subject of unsubstantiated “data abnormality" claims I discussed here: mprnews.org/story/2020/11/…), it was driven mostly by the suburbs, not Minneapolis: Image
@mngop @jkcarnah 13/ None of this gets into the question, unaddressed by Carnahan, of the mechanism by which mass voter fraud was supposedly perpetrated in rock-red Republican counties like Wright and Sherburne.
@mngop @jkcarnah 14/ Anyway, check out my full article here diving into Carnahan’s claims of "extreme abnormalities and statistical variations from Minnesota's historic voter trends": mprnews.org/story/2020/11/…
@mngop @jkcarnah 15/ If you want a narrative framing to understand the 2020 election in Minnesota, rather than “extreme abnormalities,” I’d recommend this framing:

• • •

Missing some Tweet in this thread? You can try to force a refresh
 

Keep Current with David H. Montgomery

David H. Montgomery Profile picture

Stay in touch and get notified when new unrolls are available from this author!

Read all threads

This Thread may be Removed Anytime!

PDF

Twitter may remove this content at anytime! Save it as PDF for later use!

Try unrolling a thread yourself!

how to unroll video
  1. Follow @ThreadReaderApp to mention us!

  2. From a Twitter thread mention us with a keyword "unroll"
@threadreaderapp unroll

Practice here first or read more on our help page!

More from @dhmontgomery

20 Nov
Today was another bad day for #COVID19 deaths & hospitalizations in Minnesota. But I want to focus on better news: newly reported cases went down, while testing volume went up! This is exactly what we want to see (repeated on more than one day) when looking for a possible peak.
Now, this good news is good only in context. Even today’s “good” positivity rate is still 11.7%, far above the target of 5%. But in the context of this week’s slightly slower case growth rate and flat positivity rate, it’s slowly strengthening the case for an approaching peak.
Of course, bad reports Saturday and Sunday could change the direction of the trend again, making all this moot. All trends continue until they don’t! But compared to the ever-escalating bad news of past weeks, these possibly illusory glimmers of hope are an improvement!
Read 6 tweets
19 Nov
Another day, another grisly #COVID19 death record in Minnesota. 72 deaths, with a seven-day average of 41/day (also a record).
Today saw cases shoot back up after a few days of decline — as we would expect given that it’s Thursday, when reported testing volume usually increases. Today saw the second-highest number of reported cases on record, but also the second-highest number of reported tests.
With both cases and tests up, Minnesota’s positivity rate barely budged. It’s been largely flat (albeit high) for more than a week, even as cases continue to rise. I’m watching this stat very closely.
Read 8 tweets
18 Nov
Oooof. Minnesota today reported 67 new #COVID19 deaths, an all-time record. The 7-day average death rate is up to nearly 37 per day. Image
Going to leading indicators, newly reported cases have actually fallen for four straight days. This doesn’t mean TOO much given weekend effects, and we should expect a rise tomorrow. But it’s better than cases rising anyways, which happened more often than not the past few weeks. Image
Minnesota’s positivity rate, which controls cases for testing volumne, has been at a rough plateau for more than a week now. It’s gone on long enough it’s clearly not a blip, but what it means beyond that is too early to say… Image
Read 7 tweets
14 Nov
Another day, another smashed #COVID19 record in Minnesota. Today, 8,703 newly reported cases, 20% higher than the old record set two days ago.

The 7-day average is nearly 5,900 new cases per day.
Here’s cases by sample date, a week delayed. You can see tests done last Saturday had nearly 4,000 positives. A week or so before THAT, that would have been a record high for a weekday, let alone weekends that usually have lower volumes.
Now, today’s record 8,703 confirmed #COVID19 cases did come on a record 51,956 tests. But tests are growing at 1.2% per day, while cases are expanding by 3.1% per day. Minnesota’s 7-day average positivity rate is 15%.
Read 11 tweets
13 Nov
Another day of 40+ #COVID19 deaths in Minnesota, taking the 7-day average up to 35/day. That’s twice as high as two weeks ago.
These #COVID19 deaths are happening at record paces both in and out of long-term-care facilities.
But the news on newly confirmed cases… wasn’t terrible? Yes, more than 5,500 new cases, which is super high. But the number of cases went down from yesterday while tests went up, which hasn’t been the norm lately.

One day doesn’t make a trend, of course.
Read 7 tweets
12 Nov
The latest #COVID19 data is out in Minnesota and it continues to be mostly bad news. 39 newly reported deaths, the second-highest ever behind only yesterday’s record. The 7-day average is up to 34 deaths/day. Image
Deaths are rising and at record highs both in and out of long-term care facilities. The average #COVID19 death rate in LTC facilities is now HIGHER than the May peak: Image
Yet another daily record in the number of new #COVID19 hospitalizations: Image
Read 13 tweets

Did Thread Reader help you today?

Support us! We are indie developers!


This site is made by just two indie developers on a laptop doing marketing, support and development! Read more about the story.

Become a Premium Member ($3/month or $30/year) and get exclusive features!

Become Premium

Too expensive? Make a small donation by buying us coffee ($5) or help with server cost ($10)

Donate via Paypal Become our Patreon

Thank you for your support!

Follow Us on Twitter!