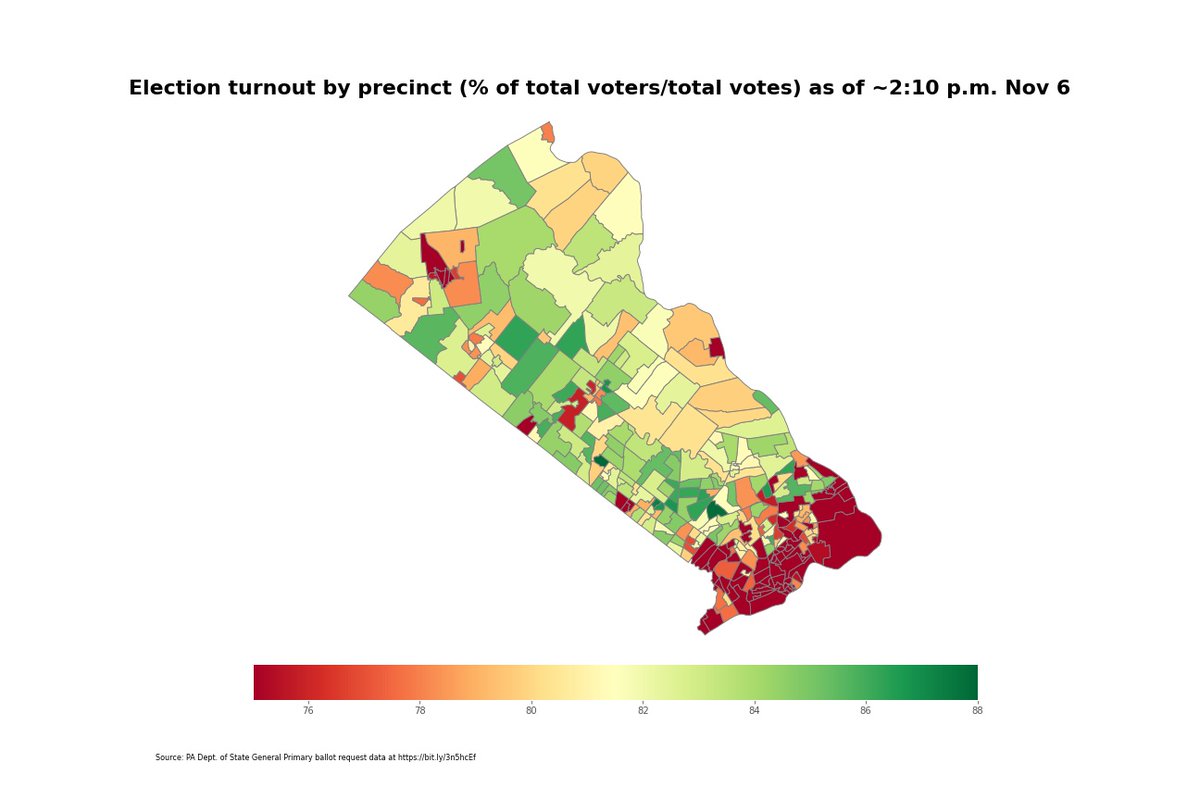
I was curious about voter party turnout in PA, but I'm waiting on a Monday certification deadline. While I'm waiting, I thought I'd take a look at precinct-level data in Philadelphia. There's about 1.12 million registered voters and about 740,000 votes cast in this election
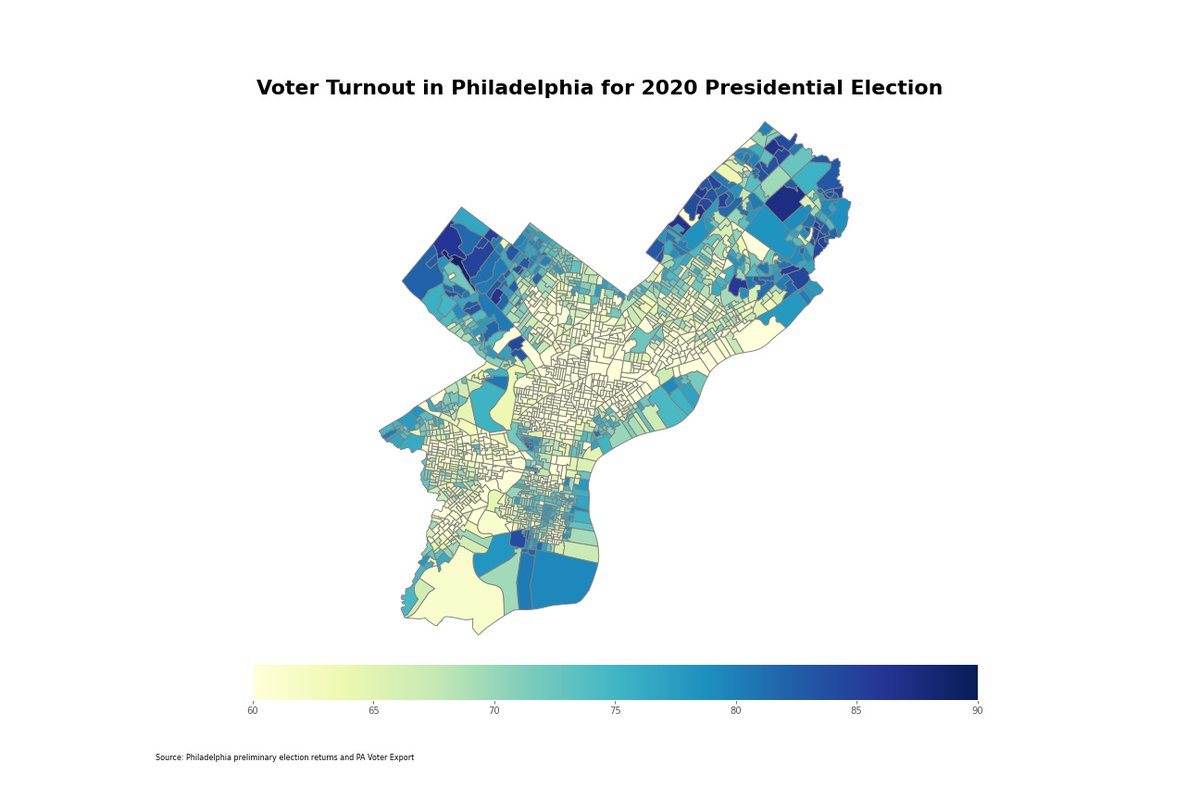
There's about 1,700 voting precincts in the city, with an average turnout of about 65.5%. Highest turnout at a single precinct was 88%, in a precinct at the 21st Ward in northwest Philadelphia.
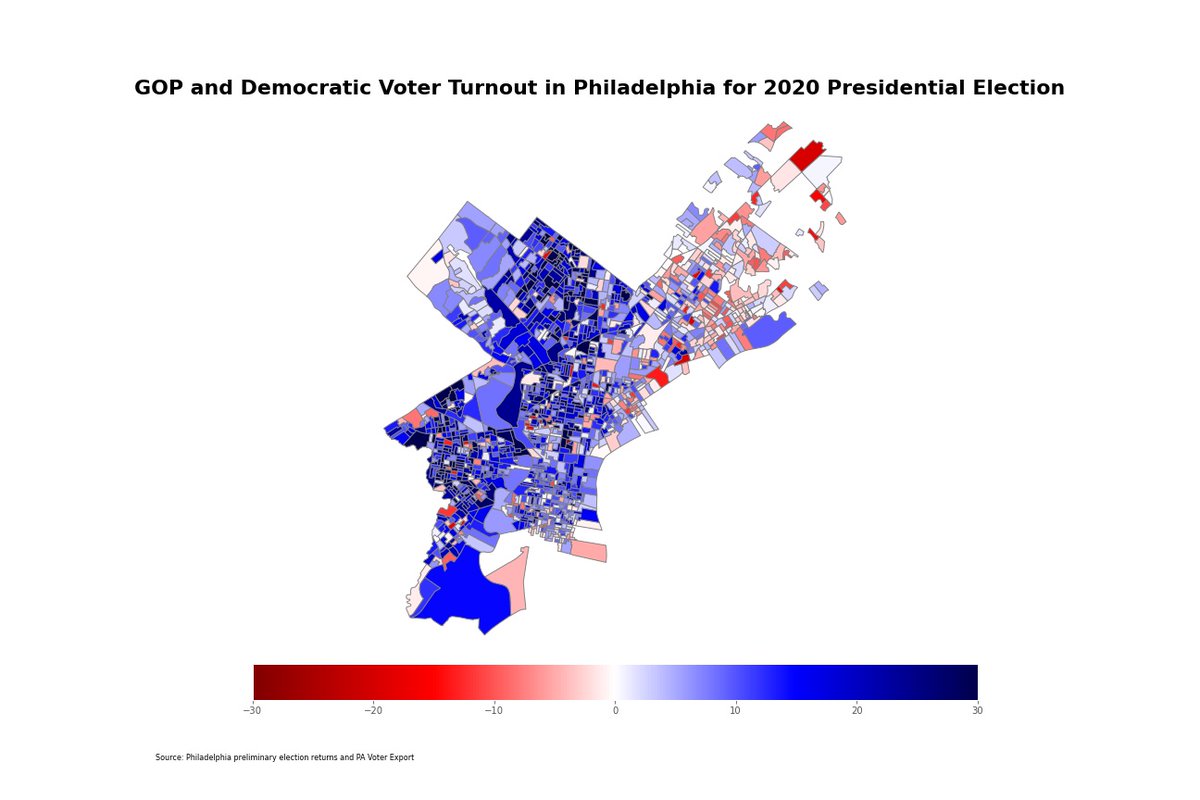
Philadelphia is a heavily democratic city, with only about 16 precincts having more GOP than DEM voters. That lead is very narrow though, with GOP voters at most having a 15 percentage point lead on Democratic voters (as % of total voters by precinct)
This map is probably a better representation of party control by precinct. It's the same data, we've just set our color bar limits to -50% to 50%. Many precincts in Philadelphia are almost entirely made up of Democrats.
Trump managed to secure about three wards in the city, and we can see the precincts those wards fell in here. For the most part, Trump took precincts where either Republicans led or were just barely led by Democrats.
The state's voter export has been updated at least once since the election, but we don't have the full breakdown of how every voter voted yet. We do, however, know whether or not all but about 30,000 voters cast a ballot.
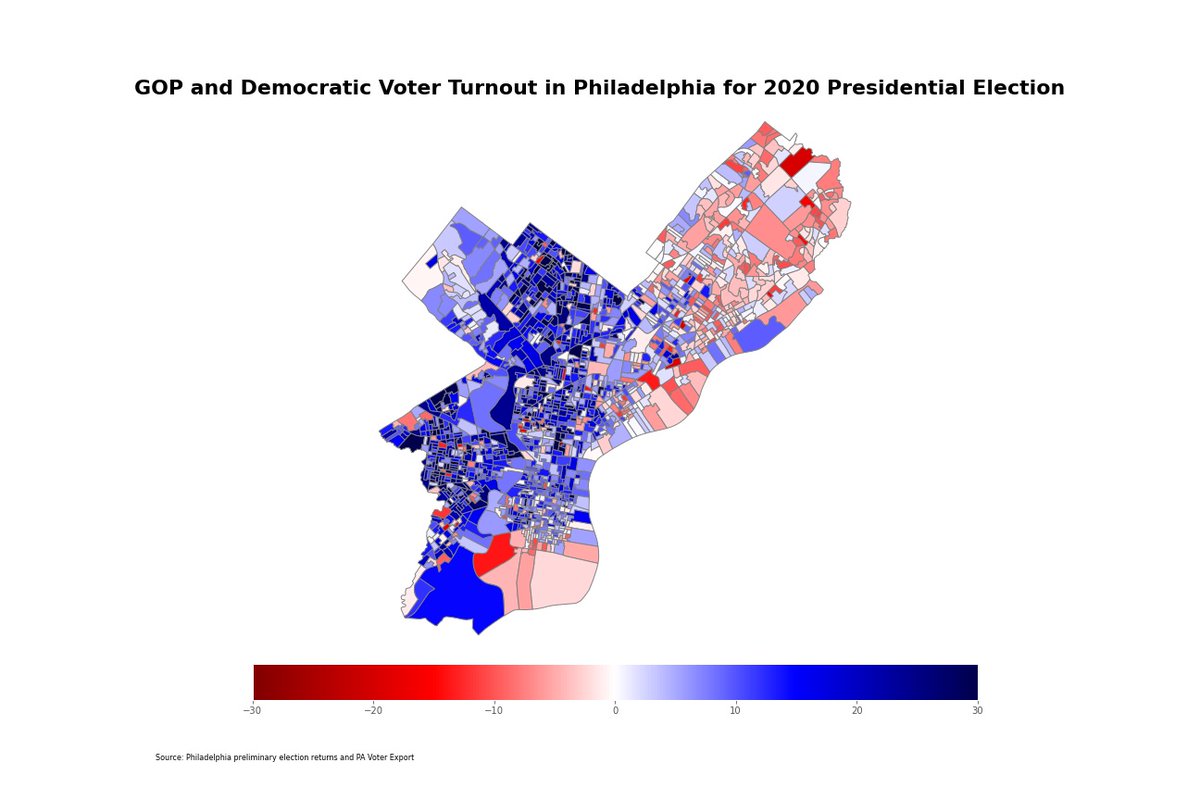
We'll probably get a fully updated export once the deadline to certify election results passes on Monday. Last Monday's update suggests something I think is really fascinating. Republicans might have had a greater showing at the polls than democrats in some precincts.
In fact, about 24% of precincts appeared to have seen more Republicans voting than Democrats. That could change as we get more data on the voters not currently updated in the export, but I'm very curious to see how it holds up.
This map is only the precincts that Biden won in the 2020 election. So, even in districts that saw high voter turnout overall, and may have seen high Republican turnout in general, Trump couldn't seem to carry those voters.
What I find so interesting about this is that after all of the legal challenges and allusions of voter fraud and some coupe by liberals, Trump's loss even in Democratic strongholds might be more due to Republican voters.
As always, data is analyzed using @PythonPr @matplotlib @geopandas in a @ProjectJupyter notebook. @threadreaderapp Unroll please.

• • •

Missing some Tweet in this thread? You can try to force a refresh
 

Keep Current with Christopher Ullery

Christopher Ullery Profile picture

Stay in touch and get notified when new unrolls are available from this author!

Read all threads

This Thread may be Removed Anytime!

PDF

Twitter may remove this content at anytime! Save it as PDF for later use!

Try unrolling a thread yourself!

how to unroll video
  1. Follow @ThreadReaderApp to mention us!

  2. From a Twitter thread mention us with a keyword "unroll"
@threadreaderapp unroll

Practice here first or read more on our help page!

More from @ulleryatintell

23 Nov
Pennsylvania is banning liquor and beer sales after 5 p.m. on Nov. 25 as part of the state's coronavirus mitigation efforts. The Thanksgiving holiday is projected to take the state into 22,000 new cases daily next month. Let's take stock of where we are...
bit.ly/3lTEUCd
Southeastern PA saw some of the highest daily increases as of midnight Sunday. Montgomery's 290 new cases and Bucks' 265 new cases took the second and third highest spots in our top 10 chart here. Image
Central PA is getting hit hardest though, as far as 14-day average new cases per 100,000 people. Mifflin, Cambria and Juniata counties are among the highest at those rates. ImageImage
Read 8 tweets
20 Nov
@JoCiavaglia did this very good story about how Bucks County will be reporting its coronavirus figures moving forward. You can read more about that in the link below. More importantly (for me) this gives me an excuse to throw gifs and charts at you!!!!
buckscountycouriertimes.com/story/news/202…
As you're all probably aware, #coronavirus cases are way up in Pennsylvania and across the country. It's not just that cases are up, but that we've just about doubled the 14-day average case counts from the peak in April (in Bucks, MontCo and the statewide average). Image
A line chart is interesting as an overview, but I thought we should go through the past 9 months in a map to really put this in context. Below is the 14-day average case counts of coronavirus per 100k residents in March and April. Southeastern PA quickly becomes the hardest hit.
Read 10 tweets
7 Nov
I came across something I think is worth expanding on in Bucks County. Let's start with the overall turnout. As of about 2:10 today, turnout was as high as 88% in some precincts. Turnout averaged about 78% at the precinct level throughout.
Voter turnout was actually lower among districts that had more Democrats than Republican voters. The darkest red areas here show where turnout is under 75% (a bit under the county average).
Turnout in Republican voting precincts was generally higher overall. These districts did contain both the highest and lowest turnout rates, at 53% and 88%, respectively.
Read 7 tweets
6 Nov
@PAStateDept mail ballot request data shows there were approximately 2.55 million mail-in ballots returned by Nov. 3. Current processing data shows about 2.63 mail-in ballots cast. We can estimate then that about 78,000 mail ballots have been received since Election Day. 1/???
The processing data (updated hourly according to data.pa.gov) shows about 112,000 ballots yet to be counted in the commonwealth. Even if we assume that total includes all of those 78,000 newer ballots, counties are still counting ballots arriving before election day.
Part of a state Supreme Court ruling allows the state to count mail ballots arriving three days after the election and they can accept ballots without a post mark. Let's unpack why the rule might be in place next ...
bit.ly/3mZBQV9
Read 6 tweets
5 Nov
We've seen a lot of changes as results have rolled in. Trump's lead in both the state and Bucks County over Biden has been dwindling as more mail-in ballots get counted. Let's take a look at how the county shifted over the last 24 hours.
bit.ly/3eyWngn
Just after midnight Nov. 4, the majority of the county's 304 precincts reported in. Trump had 56% of the votes to Biden's 46%, giving the incumbent President a significant lead in the earliest results.
More precincts began reporting in shortly before 2 a.m. yesterday morning. The newly reported precincts kept the gap between the two candidates the same as hours earlier.
Read 8 tweets
3 Nov
Big game is finally here! My fellow @CourierTimes
and @TheIntellNews reporters and I are visiting polling places and the @BucksCountyGovt elections office throughout the day and night with regular updates. My shift starts at 3 sooooo DATA THREAD!!!! bit.ly/3mPLjP2 1/8
According to the state's voter export (last updated at midnight Nov. 2), more than 2.4 million voters had already cast a ballot by mail. That's roughly 25% of the state's more than 9 million registered voters. 2/8
Those numbers wouldn't include any last-minute ballots dropped off, nor is taking into account any election results (because time moves forward, no matter how hard I try). Some counties have already seen more than 35% turnout from mail-in ballots so far. 3/8
Read 8 tweets

Did Thread Reader help you today?

Support us! We are indie developers!


This site is made by just two indie developers on a laptop doing marketing, support and development! Read more about the story.

Become a Premium Member ($3/month or $30/year) and get exclusive features!

Become Premium

Too expensive? Make a small donation by buying us coffee ($5) or help with server cost ($10)

Donate via Paypal Become our Patreon

Thank you for your support!

Follow Us on Twitter!