1 Welcome to #researchmethodologies with @DrAoifeBee
Kaplan-Meier (KM) curves are a wonderfully informative way of presenting survival outcomes over time. But how do we interpret them? Survival analysis determines the probability of a binary outcome (aka an event or a failure)
Kaplan-Meier (KM) curves are a wonderfully informative way of presenting survival outcomes over time. But how do we interpret them? Survival analysis determines the probability of a binary outcome (aka an event or a failure)

2/15
Survival means the event being studied has not occurred yet - the patient is still alive if you’re analysing mortality, the baby has not been delivered if analysing births, the patient has not yet met whatever criteria you have decided constitutes an event in your study.
Survival means the event being studied has not occurred yet - the patient is still alive if you’re analysing mortality, the baby has not been delivered if analysing births, the patient has not yet met whatever criteria you have decided constitutes an event in your study.
3/15
In medical research, the binary outcome of interest is commonly survival vs death though other outcomes/events can be used. KM curves are a visual way of showing the fraction of patients living over time after a treatment, or lack of treatment if in a control group.
In medical research, the binary outcome of interest is commonly survival vs death though other outcomes/events can be used. KM curves are a visual way of showing the fraction of patients living over time after a treatment, or lack of treatment if in a control group.
4/15 Here is an example where the outcome of interest is percentage requiring reintubation, rather than percentage or proportion surviving (doi:10.1001/jama.2019.14901) 

5/15
The curve is actually a visual representation of the KM survival estimator, a statistics formula.
The curve is actually a visual representation of the KM survival estimator, a statistics formula.

6/15 The axes
y-axis = probability of the event of interest, typically survival with a treatment. Usually represented as a fraction or a percentage, so 0.0 = no one survived and 1.0 = everyone survived.
x-axis = time to event (hours, days, months, years)
y-axis = probability of the event of interest, typically survival with a treatment. Usually represented as a fraction or a percentage, so 0.0 = no one survived and 1.0 = everyone survived.
x-axis = time to event (hours, days, months, years)
7/15
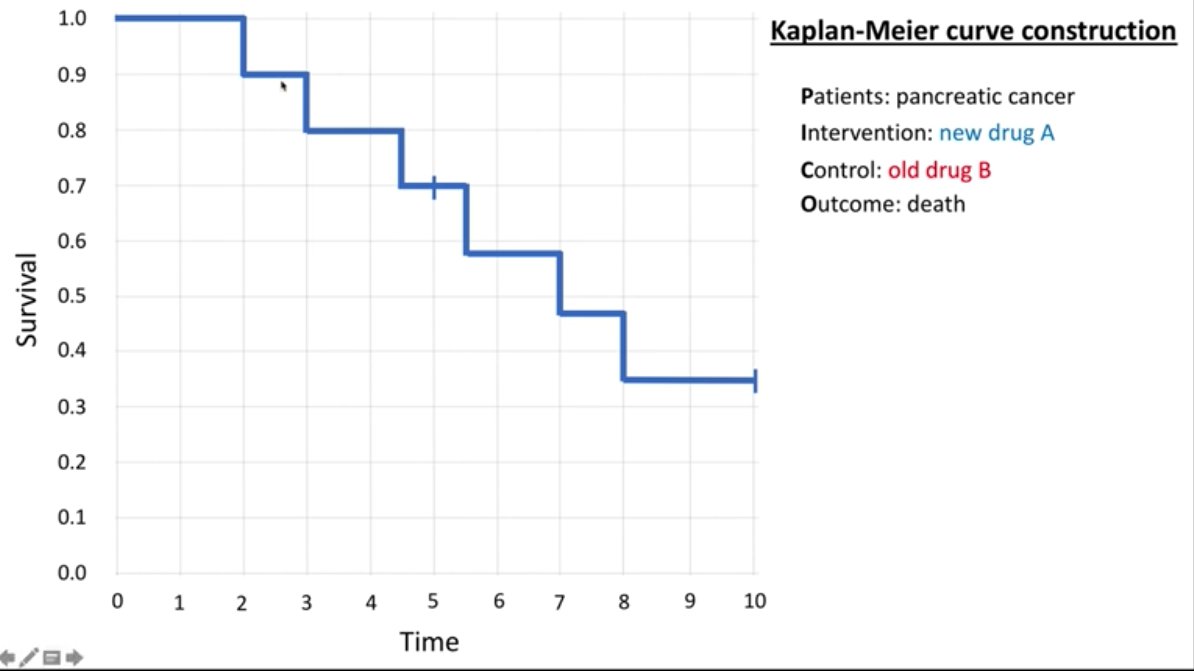
It is not a smooth, continuous curve, but rather steps at the end of intervals. What stops an interval is an event, or “failure” (ie) when a study participant dies. (Image: @TDataScience )
It is not a smooth, continuous curve, but rather steps at the end of intervals. What stops an interval is an event, or “failure” (ie) when a study participant dies. (Image: @TDataScience )

8/15
Interval probability (IP)= number surviving ÷ number at risk
Example: 10 patients with cancer, 1 dies, stopping an interval
IP = 9/10 = 0.9
Cumulative probability = probability that any patient made it to the previous interval AND the current interval (image @ericmccoymd)
Interval probability (IP)= number surviving ÷ number at risk
Example: 10 patients with cancer, 1 dies, stopping an interval
IP = 9/10 = 0.9
Cumulative probability = probability that any patient made it to the previous interval AND the current interval (image @ericmccoymd)

9/15
Censoring patients
If we lose a patient to follow up or withdrawal from study we no longer have data to track. This is censoring.
Consequence: decreases estimates of effect, results becomes less precise.
Represented on the graph as a vertical tick. (Image @TDataScience )
Censoring patients
If we lose a patient to follow up or withdrawal from study we no longer have data to track. This is censoring.
Consequence: decreases estimates of effect, results becomes less precise.
Represented on the graph as a vertical tick. (Image @TDataScience )

10/15
After censoring:
If at previous interval cumulative prob was 0.7 & we had 7 patients at risk. We censor 1 patient & 1 dies= TWO fewer patients.
Prob of surviving to LAST interval=0.7
Prob of surviving THIS interval=5/6
Cumulative prob= 0.7(5/6) = 0.58 (image @ericmccoymd
After censoring:
If at previous interval cumulative prob was 0.7 & we had 7 patients at risk. We censor 1 patient & 1 dies= TWO fewer patients.
Prob of surviving to LAST interval=0.7
Prob of surviving THIS interval=5/6
Cumulative prob= 0.7(5/6) = 0.58 (image @ericmccoymd

11/15
At the end of the study period, all the patients are censored as we no longer follow them and collect their data. The steps are collected for aesthetic purposes and the individual calculations are not shown on the graph, giving us the ‘curve’ shape we’re used to seeing.
At the end of the study period, all the patients are censored as we no longer follow them and collect their data. The steps are collected for aesthetic purposes and the individual calculations are not shown on the graph, giving us the ‘curve’ shape we’re used to seeing.

12/15
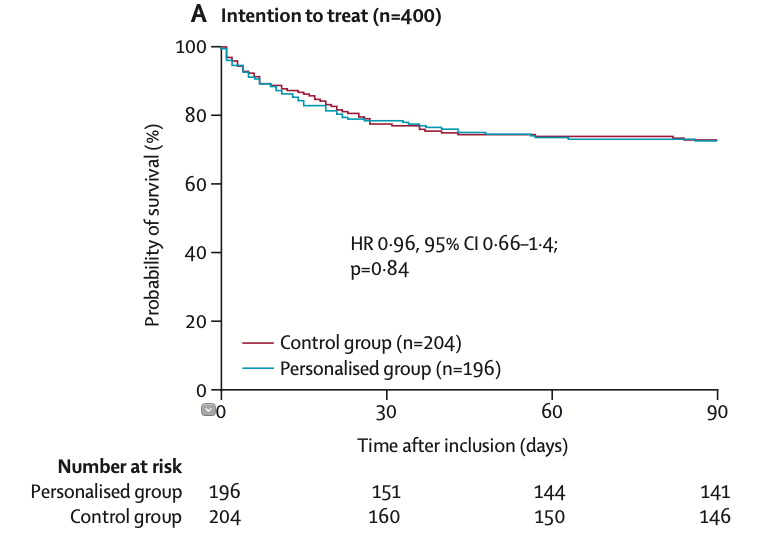
We can graph multiple interventions or treatments on one KM curve though in randomised control trials there are typically two curves: treatment vs control, or treatment A vs treatment B. (@JAMA_current . 2020;323(10):938-949. doi:10.1001/jama.2020.0930)
We can graph multiple interventions or treatments on one KM curve though in randomised control trials there are typically two curves: treatment vs control, or treatment A vs treatment B. (@JAMA_current . 2020;323(10):938-949. doi:10.1001/jama.2020.0930)

13/15
Adding confidence intervals (CI)
95% CI = contains all values between -1.96 and +1.96 times the standard deviation of the mean. Anything that occurs outside of this occurs < 5% of the time (ie) the probability that the true mean is in this area is <0.05. (ACTT-1 Study)
Adding confidence intervals (CI)
95% CI = contains all values between -1.96 and +1.96 times the standard deviation of the mean. Anything that occurs outside of this occurs < 5% of the time (ie) the probability that the true mean is in this area is <0.05. (ACTT-1 Study)

14/15
The null hypothesis
If the CIs overlap, we must accept the null hypothesis. The null hypothesis states that there is NO statistical difference between the two sets of data. (ACTT-1 study)
The null hypothesis
If the CIs overlap, we must accept the null hypothesis. The null hypothesis states that there is NO statistical difference between the two sets of data. (ACTT-1 study)

15/15
That concludes our #researchmethodologies #tweetorial for this week. Thanks for reading! #criticalcare #intensivecare #MedEd #foam #FOAMed #medtwitter #medstudenttwitter #galway #saolta
@DrAoifeBee
That concludes our #researchmethodologies #tweetorial for this week. Thanks for reading! #criticalcare #intensivecare #MedEd #foam #FOAMed #medtwitter #medstudenttwitter #galway #saolta
@DrAoifeBee
• • •
Missing some Tweet in this thread? You can try to
force a refresh


