Some locations in Tier 3 had evidence of rising epidemics before November lockdown; others were declining. Same for Tier 1 & 2 – some were rising; some were declining. How come? There are three likely explanations... 1/
First, things like population demography, household structure, and nature of local industry will influence social interactions and hence transmission potential. As a result, baseline R may just be slightly lower in some locations. 2/

Second, high levels of infection will lead to some accumulation of immunity (in short-term, at least). Unlikely it's enough to go back to normal without outbreaks, but could be enough for control measures that would get R near 1 in spring to now get R below 1. (Data from ONS) 3/
Third, behaviour can change, whether by top-down control measures (like local restrictions, tiers or national lockdown) or from individual-level responses to local outbreak situation/headlines. 4/
The problem is that it's often impossible to disentangle between these three explanations from case trends alone - need to look at data on social behaviour, serology, community testing, intervention timing, local epidemiology too... 5/

Commentators tend to focus on the outliers, but conclusions from outliers won’t necessarily generalise to other locations. What's more, some factors will be reasonably static (like population structure), while others dynamic (immunity, behaviour), so harder to predict. 6/
As I mentioned in my #covidunknowns talk last week, these are crucial questions - there are lots of studies underway that should help answer some of them, but in the meantime worth bearing above in mind when interpreting epidemic trajectory in different places. 7/7

• • •

Missing some Tweet in this thread? You can try to force a refresh
 

Keep Current with Adam Kucharski

Adam Kucharski Profile picture

Stay in touch and get notified when new unrolls are available from this author!

Read all threads

This Thread may be Removed Anytime!

PDF

Twitter may remove this content at anytime! Save it as PDF for later use!

Try unrolling a thread yourself!

how to unroll video
  1. Follow @ThreadReaderApp to mention us!

  2. From a Twitter thread mention us with a keyword "unroll"
@threadreaderapp unroll

Practice here first or read more on our help page!

More from @AdamJKucharski

25 Nov
Relaxing UK COVID-19 control measures over the Christmas period will inevitably create more transmission risk. There are four main things that will influence just how risky it will be... 1/
We can think of as epidemic as a series of outbreaks within households, linked by transmission between households. This is particularly relevant over Christmas, given school holidays and some workplace closures. 2/
We can also think of R in terms of within and between household spread. If the average outbreak size in a household is H, and each infected person in household transmits to C other households on average, we can calculate the 'household' reproduction number as H x C. 3/
Read 8 tweets
22 Nov
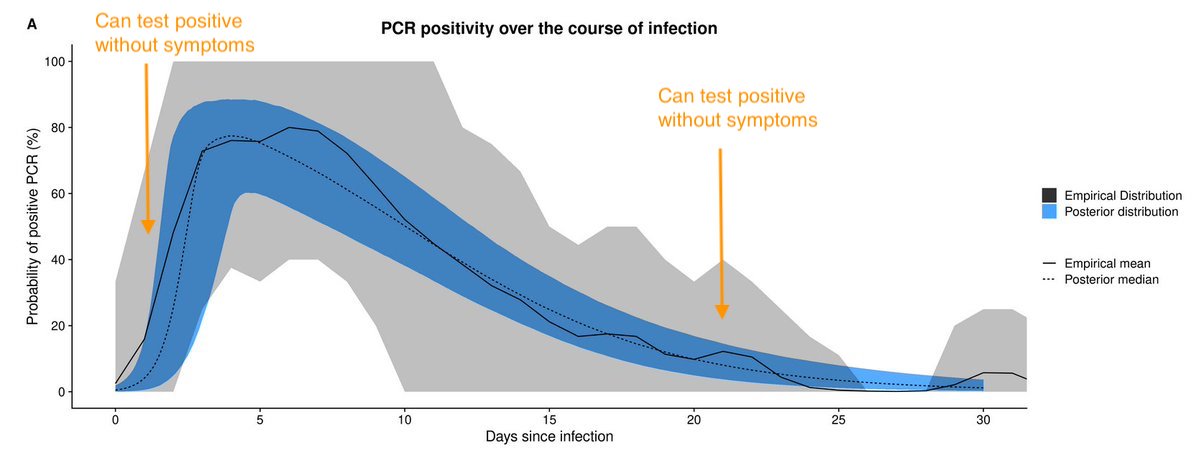
Some people are interpreting the below study as evidence that people who test positive without symptoms won't spread infection, but it's not quite that simple. A short thread on epidemic growth and timing of infections... 1/
If we assume most transmission comes from those who develop symptoms, there are 2 points where these people can test positive without having symptoms - early in their infection (before symptoms appear) & later, once symptoms resolved (curve below from: cmmid.github.io/topics/covid19…) 2/
So if people test positive without symptoms, are they more likely to be early in their infection or later? Well, it depends on the wider epidemic... 3/
Read 8 tweets
12 Nov
Why do COVID-19 modelling groups typically produce ‘scenarios’ rather than long-term forecasts when exploring possible epidemic dynamics? A short thread... 1/
Coverage of modelling is often framed as if epidemics were weather - you make a prediction and then it happens or it doesn’t. But COVID-19 isn’t a storm. Behaviour and policy can change its path... 2/
This means that long-term COVID forecasts don’t really make sense, because it’s equivalent of treating future policy & behaviour like something to be predicted from afar (more in this piece by @reichlab & @cmyeaton: washingtonpost.com/outlook/2020/0…). 3/
Read 9 tweets
11 Nov
Data take time to appear on gov website, so deaths for 1st Nov now average over 320, not “just over 200” as claimed in this article. Either CEBM team aren't aware of delays in death reporting, or they are & for some reason chose to quote too low values. cebm.net/covid-19/the-i… 1/
Worth noting models above were preliminary scenarios, not forecasts. (Personally, I thought there were more than enough data/trends to be concerned about last month, regardless of results of one specific long-term modelling scenario from early Oct.)
2/
Why do data delays matter? Because it's difference between simplistic narrative of 'all model values were too high' and realisation that despite model variation, median of quoted worst-case estimates (376 deaths) concerningly close to Nov 1st average (which will rise further). 3/
Read 5 tweets
11 Nov
Because SARS-CoV-2 testing often happens after symptoms appear, it's been difficult to estimate detection probability early in infection. So great to collaborate with team at @TheCrick & @ucl to tackle this question, with @HellewellJoel & @timwrussellcmmid.github.io/topics/covid19… 1/
We analysed data from London front-line healthcare workers who'd been regularly tested and reported whether they had symptoms at point of test (medrxiv.org/content/10.110…)... 2/
To estimate when people were likely infected and hence detection probability over time, we combined the HCW data with a model of unobserved infection times. 3/
Read 6 tweets
6 Nov
As epidemic trajectories in Europe rise back towards their spring peaks, a thread on normalisation during a pandemic... 1/
In late Feb & early March, we modelled scenarios for what effect widespread social distancing measures might have in UK. Like others, we'd already modelled contact tracing (thelancet.com/journals/langl…) but characteristics of infection suggested additional measures would be needed. 2/
At the time we were doing this modelling, fewer than 3000 COVID deaths had been reported globally (below from 1st March). I remember doing media during this period and could tell many saw the potential impact of COVID-19 as rather abstract, given observed numbers to date... 3/
Read 9 tweets

Did Thread Reader help you today?

Support us! We are indie developers!


This site is made by just two indie developers on a laptop doing marketing, support and development! Read more about the story.

Become a Premium Member ($3/month or $30/year) and get exclusive features!

Become Premium

Too expensive? Make a small donation by buying us coffee ($5) or help with server cost ($10)

Donate via Paypal Become our Patreon

Thank you for your support!

Follow Us on Twitter!