Because SARS-CoV-2 testing often happens after symptoms appear, it's been difficult to estimate detection probability early in infection. So great to collaborate with team at @TheCrick & @ucl to tackle this question, with @HellewellJoel & @timwrussell – cmmid.github.io/topics/covid19… 1/
We analysed data from London front-line healthcare workers who'd been regularly tested and reported whether they had symptoms at point of test (medrxiv.org/content/10.110…)... 2/
To estimate when people were likely infected and hence detection probability over time, we combined the HCW data with a model of unobserved infection times. 3/
We then used our estimates for PCR positivity over time to estimate the probability that different testing strategies would detect infections prior to symptoms or early in the infection: 4/
Given the current interest in scaled-up testing, we hope these estimates can be a useful benchmark for potential test performance, as well as highlighting the value of fast, frequent testing in higher risk populations. 5/
Why do COVID-19 modelling groups typically produce ‘scenarios’ rather than long-term forecasts when exploring possible epidemic dynamics? A short thread... 1/
Coverage of modelling is often framed as if epidemics were weather - you make a prediction and then it happens or it doesn’t. But COVID-19 isn’t a storm. Behaviour and policy can change its path... 2/
This means that long-term COVID forecasts don’t really make sense, because it’s equivalent of treating future policy & behaviour like something to be predicted from afar (more in this piece by @reichlab & @cmyeaton: washingtonpost.com/outlook/2020/0…). 3/
Data take time to appear on gov website, so deaths for 1st Nov now average over 320, not “just over 200” as claimed in this article. Either CEBM team aren't aware of delays in death reporting, or they are & for some reason chose to quote too low values. cebm.net/covid-19/the-i… 1/
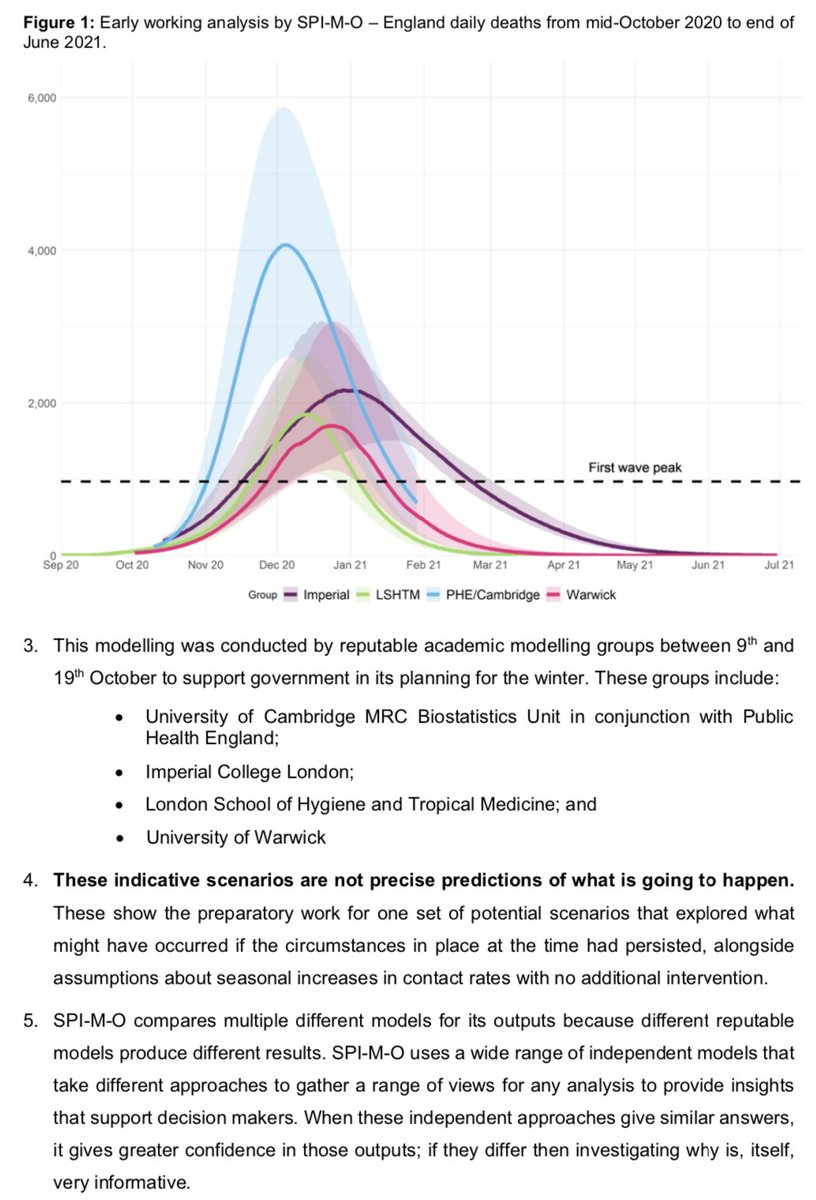
Worth noting models above were preliminary scenarios, not forecasts. (Personally, I thought there were more than enough data/trends to be concerned about last month, regardless of results of one specific long-term modelling scenario from early Oct.)
Why do data delays matter? Because it's difference between simplistic narrative of 'all model values were too high' and realisation that despite model variation, median of quoted worst-case estimates (376 deaths) concerningly close to Nov 1st average (which will rise further). 3/
As epidemic trajectories in Europe rise back towards their spring peaks, a thread on normalisation during a pandemic... 1/
In late Feb & early March, we modelled scenarios for what effect widespread social distancing measures might have in UK. Like others, we'd already modelled contact tracing (thelancet.com/journals/langl…) but characteristics of infection suggested additional measures would be needed. 2/
At the time we were doing this modelling, fewer than 3000 COVID deaths had been reported globally (below from 1st March). I remember doing media during this period and could tell many saw the potential impact of COVID-19 as rather abstract, given observed numbers to date... 3/
If the reproduction number drops below 1, an epidemic won't disappear immediately. But how many additional infections will there be before it declines to very low levels? Fortunately there's a neat piece of maths that can help... 1/
Let's start by considering a situation where one person is infectious. On average they'll infect R others, who in turn will infect R others, and so on. We'd therefore get the following equation for average outbreak growth: 2/
If R is above 1, the outbreak will continue to grow and grow until something changes (control measures, accumulated immunity, seasonal effects etc.) But if R is below 1, above transmission process will decline & converge to a fixed value. (Proof here: en.wikipedia.org/wiki/Geometric…) 3/
Comparison of SPI-M medium term projections for England hospitalisations/deaths and subsequent data has now been published (along with some model descriptions): assets.publishing.service.gov.uk/government/upl… 1/
Additional context on that early working analysis also now available (noting that unlike above, these were *scenarios* to illustrate a reasonable worst case without further interventions, not forecasts): assets.publishing.service.gov.uk/government/upl… 2/
I'm increasingly seeing people quote a single 'global' estimate of infection fatality risk (IFR) for SARS-CoV-2 & use this value to try and make conclusions about specific countries. But, of course, this is missing out a crucial aspect of risk... 1/
We've known since the early days of the pandemic that fatality risk is strongly dependent on age (as well as other factors), which means that estimates will depend on population structure and age group that gets infected. 2/
For example, Singapore has reported around 58k cases and 28 deaths, which would imply that less than 0.05% of local infections resulted in death. But lot of these infections were concentrated in groups of younger migrant workers, rather than the wider - and older - population. 3/