The European CDC will soon be switching to weekly data and I see several people concerned that this would create problems for Our World in Data and those who rely on data that they obtain via us.

This is not the case. We are well prepared.

Our data manager @redouad summarizes: Image
What the ECDC was pulling off in the last months was really phenomenal.

Very early in the pandemic – when alternative data sources were often extremely bad – the colleagues there woke up at 4 o'clock every morning to bring together reliable data from countries around the world.
We would definitely prefer if the ECDC would continue doing this work, but I very much understand that it needs to come to an end. And it can because there are good alternatives for case and death data available.
The problem is not so much that this instution stops providing key data for which alternatives exist.

The problem is that some other institutions never started providing key data.

We are 11 months into the pandemic and there is no one that brings together global data on
… on key metrics like cases by age, deaths by age, or hospitalizations. Such data would be key to understanding the pandemic better.

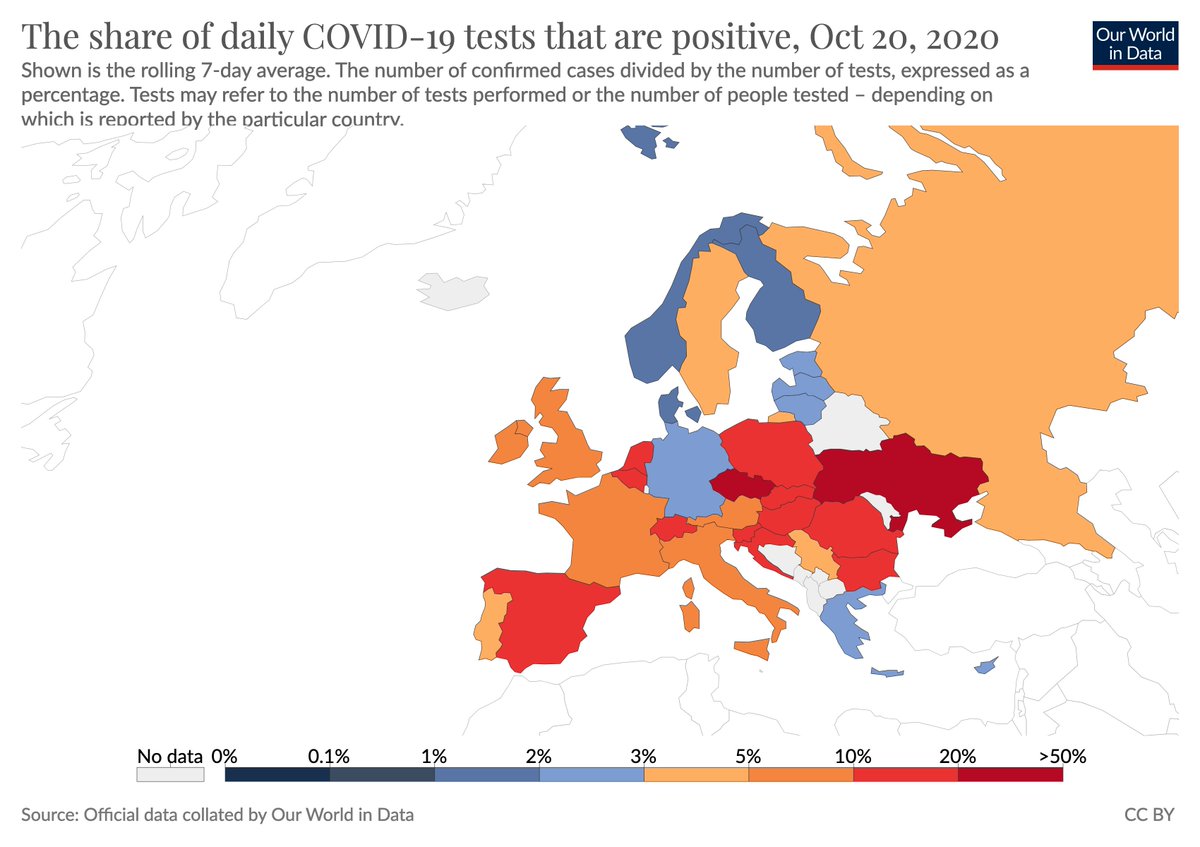
(Also, our tiny team here are the only team maintaining global testing data.)

And unfortunately none of that seems to change.

• • •

Missing some Tweet in this thread? You can try to force a refresh
 

Keep Current with Max Roser

Max Roser Profile picture

Stay in touch and get notified when new unrolls are available from this author!

Read all threads

This Thread may be Removed Anytime!

PDF

Twitter may remove this content at anytime! Save it as PDF for later use!

Try unrolling a thread yourself!

how to unroll video
  1. Follow @ThreadReaderApp to mention us!

  2. From a Twitter thread mention us with a keyword "unroll"
@threadreaderapp unroll

Practice here first or read more on our help page!

More from @MaxCRoser

14 Nov
Austria has now the highest rate of confirmed cases in the world. And the rate is still increasing.

Testing is very poor (the positive-rate is 22%) so that the true number of cases is much higher.

Austria now decided to implement a stricter lockdown: orf.at/#/stories/3189…
Austria has the highest rate of all countries with a population over a million people.

Andorra currently has a rate of over 1000 per million, but a small place with 76,000 people has obviously very volatile case rates.

Source with data for all countries ourworldindata.org/coronavirus-da…
This curve shows the number of deaths in Austria.

The average over the last week were 40 deaths per day.

[Here is the data: ourworldindata.org/coronavirus-da…]
Read 4 tweets
12 Nov
How expensive is it to limit global warming to less than 2°C?

The IPCC reports that the median cost to limit warming to less than 2°C corresponds to an annualized reduction of economic growth by 0.06%, relative to a baseline annual growth of 1.6-3%

ipcc.ch/site/assets/up…
If the world economy would grow 1.6% the world economy in 100 years would be 1.016^100=489% the size of today’s economy.

With measures in place to limit warming to 2C, growth would be 0.06% smaller – i.e. 1.54%.
The world economy would then ‘only' be 461% of the size of today.
In case the world economy would grow 3% per year the world economy in 100 years would be 1.03^100=1922% the size of today’s economy.

With measures to limit warming to 2C, growth would be 0.06% smaller – i.e. 2.94%.

The economy would then ‘only' be 1813% the size of today.
Read 4 tweets
11 Nov
Predictions of the herd immunity theorists were wrong, @tylercowen rightly points out

marginalrevolution.com/marginalrevolu…
If a country had actually achieved herd immunity you would find it in the bottom right corner of this chart.
The country would have a high cumulative case rate and a low current case rate.

[→ interactive chart ourworldindata.org/grapher/immuni…] Image
Several people are asking, where is Sweden? It is in the top right corner.

Sweden is among those countries with the highest case rate up to now.
And Sweden is among those countries with the highest case rate right now. Image
Read 4 tweets
1 Nov
1/ If we want to avoid situations in this pandemic in which we have to make the decision between more people dying or lockdown, we should increase testing.

It needs to be very easy for people to find out whether they are infectious or not.
2/ The number of tests is not the relevant statistic – a large outbreak needs more tests.


How many tests are needed depends on how many people are infected.

That’s the ratio of cases to tests: the *positive rate of tests* is telling us whether a country does enough tests.
3/ If a country tests enough, the positive rate is low. The country does many tests for each case they find.

You want to be in a situation where it's easy for people to find out whether they are infectious.
Whether you achieved that is visible in a low positive rate.
Read 15 tweets
28 Oct
This is to me one of the saddest and most important charts on the pandemic.

Those countries that are doing bad right now (high on the y-axis) are largely the same countries that did worst overall in this pandemic (cumulative case rate until Aug 1 on x-axis). Image
This is a slightly different version of the same chart.

Here the x-axis shows the cumulative case rate up to the present (which means some of the correlation is simply due to current cases counting towards cumulative cases).

And with the color showing the postive rate. Image
This chart would show us when a country reaches herd immunity.

A country that actually achieves herd immunity will have a high cumulative case rate and the current case rate will be low → it will end up in the bottom right corner (where no country is right now).
Read 5 tweets
20 Oct
The rise of confirmed cases in Europe is very rapid.

– This is showing the 7-day rolling average. Over the last week 138,500 cases were confirmed every day.
– The doubling time of confirmed cases for Europe as a whole is two weeks.

[interactive source ourworldindata.org/coronavirus-da…]
But as always, confirmed cases are only a fraction of total cases.

And testing has become worse in the last weeks – the positive rates have increased in many European countries – so that the true doubling rate is likely quite a bit faster.

[source ourworldindata.org/coronavirus-da…]
And across European countries that differences are large.

Belgium & the Czech Republic report more than 700 cases per million every day.

On the other hand Estonia & Norway report fewer than 30 per million. Testing there is better so that the true difference is likely larger.
Read 13 tweets

Did Thread Reader help you today?

Support us! We are indie developers!


This site is made by just two indie developers on a laptop doing marketing, support and development! Read more about the story.

Become a Premium Member ($3/month or $30/year) and get exclusive features!

Become Premium

Too expensive? Make a small donation by buying us coffee ($5) or help with server cost ($10)

Donate via Paypal Become our Patreon

Thank you for your support!

Follow Us on Twitter!