ONE BOGUS CLAIM IN THE TELEGRAPH AND WHY IT MATTERS – A thread
The Sunday Telegraph reports that “Boris Johnson's decision to impose tougher tiers of restrictions on much of the country this week will cost the economy £900 million a day, according to a leading economic forecaster.”
telegraph.co.uk/news/2020/11/2…
telegraph.co.uk/news/2020/11/2…
The forecaster in question is Doug McWIlliams at @Cebr_uk . The Sunday Telegraph reports that: “New analysis estimates the new tiers will result in England's GDP being 13pc smaller, or £900 million a day, compared with Dec last year”.
But as far as I can see, nothing in the analysis even supports the idea that “*the new tiers* [my emphasis] will result in England's GDP being 13pc smaller” than last year.
I contacted Mr McWilliams directly to ask if he would send me a copy of the analysis, so I could figure out what was going on.
He said: “We are a commercial consultancy so we do not ‘send our analysis’ to non clients. In any case the key elements and assumptions are set out in the Telegraph.”
I asked some more questions. Mr McWilliams said: “We actually think that GDP will be higher in December than in November because of the reopening of so called non essential retail.”
Worth pausing there. Although we just read in the paper about “England's GDP being 13pc smaller”, the forecaster behind it says that GDP will in fact *grow*.
To be clear, if CEBR were saying that GDP in December will be 13% lower than it would have been in a world where coronavirus had never existed, that’s perfectly possible.
But if the claim being made is that the tiered system (or indeed government policy in general) is responsible for that, that’s absurd. And that's the claim being made.
The Telegraph says: “The forecaster estimated that the daily loss in GDP for Tier 3 is 20 per cent, less than the lost output of 25 per cent of GDP in April when schools and shops were closed. The loss in tier 2 was estimated to be 10 per cent"
Those seemed like rather round numbers. I asked Mr McWilliams where they came from.
McWIlliams: “We have gone through the sectors and adjusted the assessed impact for each tier compared with April based on our knowledge about how the tiers will work, taking account of the state of the economy and also taking account of the time of year..."
"...And obviously rounded the numbers to give 20% and 10%. It’s pretty subjective”
I asked what the sectoral numbers were, or what the numbers were before rounding
McWIlliams: “None of this is published I’m afraid”
The email exchange ended with him saying: "I’ve spent enough time trying to answer your questions."
McWIlliams: “None of this is published I’m afraid”
The email exchange ended with him saying: "I’ve spent enough time trying to answer your questions."
OK, so we are not being allowed to know where the numbers supposedly come from. Are they plausible?
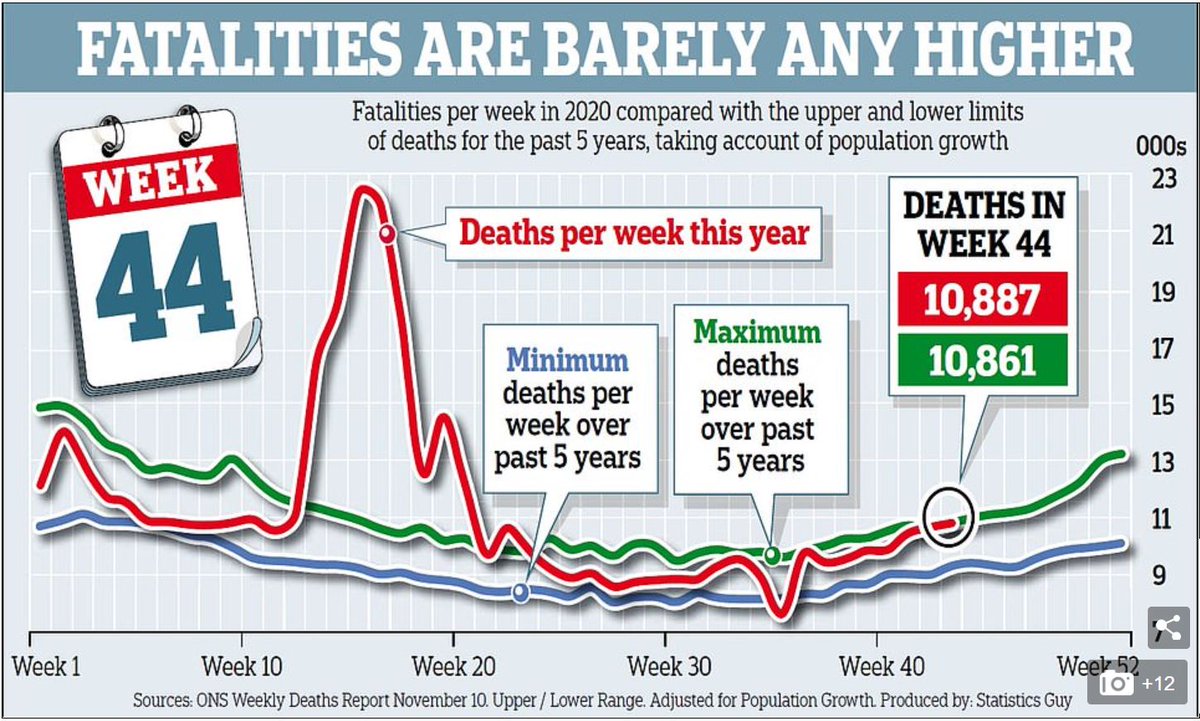
According to ONS, GDP dropped by a quarter between February and April before rebounding sharply. ONS says “GDP grew by 1.1% in September 2020, the fifth consecutive monthly increase; however, it remained 8.2% below the February 2020 level.”
ons.gov.uk/economy/grossd…
ons.gov.uk/economy/grossd…

Of course the fall we saw in the spring reflected not just government restrictions, but people’s own response to the pandemic.
We can see that in countries like Sweden where there was initially a more voluntary approach, there has been a large economic hit. In fact they seem to have combined a WORSE economic hit AND a much ten times more loss of life than their neighbours.
businessinsider.com/coronavirus-sw…
businessinsider.com/coronavirus-sw…
Sweden's GDP fell 8.6% during the second quarter of the year, according to its statistics body. The fall is sharper than its neighbours: Denmark registered a 7.4% fall, and Finland a 3.2% fall.
So is a 10% hit to GDP plausible estimate of the cost of tier 2 restrictions alone? (Rather than how much lower GDP is because of the pandemic). No way.
As @julianHjessop points out: “The economic costs of being in either Tier 1 and 2 are small. Your social and family life may be constrained, but most economic activity can continue as normal.”
https://twitter.com/julianHjessop/status/1332360763332300804
The main difference in Tier 3 is hospitality being shut. But “Accommodation and food services”, which includes pubs and restaurants, is about *3%* GDP.
So is it plausible that having this sector shut will lead to an extra *10%* drop in GDP compared to Tier 2? No.
So is it plausible that having this sector shut will lead to an extra *10%* drop in GDP compared to Tier 2? No.
A second more serious problem with this kind of reasoning is that absolutely NO account has been made for the effect of this on the virus.
If you do something which makes the transmission of the virus accelerate (as dropping all restrictions would), and you later have to slam on the brakes harder, then you will not have boosted GDP in the longer term.
If we’d let the virus rip in spring, most people acknowledge that the NHS would have been overwhelmed. With TV news showing people dying in hospital car parks across the land, how many people would still have been heading down to the pub? Or to work? Any estimate is guesswork.
So to summarise my look at this eyecatching claim:
* We aren’t allowed to see the analysis
* There is no comparison of the tiers to any alternative approach to virus control
* The numbers are based on totally implausible assumptions
* The effect of the pandemic is being muddled up with the effect of restrictions...
* There is no comparison of the tiers to any alternative approach to virus control
* The numbers are based on totally implausible assumptions
* The effect of the pandemic is being muddled up with the effect of restrictions...
… And yet this is being used to make the case against the tiered system.
I'd say you couldn't make it up - but I think they just did.
The key point is this: unless your model takes account of what policy would do the rates of transmission, you are wasting everyone’s time. END
I'd say you couldn't make it up - but I think they just did.
The key point is this: unless your model takes account of what policy would do the rates of transmission, you are wasting everyone’s time. END
• • •
Missing some Tweet in this thread? You can try to
force a refresh