
Trading is a game of repeatedly asking:
1. What exposures do I want?
2. What exposures do I have?
3. How do I get closer to 1 from 2, given that:
a) it costs to switch positions
b) my estimates are noisy
c) co-movements of assets are somewhat predictable
1/n
1. What exposures do I want?
2. What exposures do I have?
3. How do I get closer to 1 from 2, given that:
a) it costs to switch positions
b) my estimates are noisy
c) co-movements of assets are somewhat predictable
1/n
Concepts like "open trades" and "unrealized p&l" tend to be unhelpful in this paradigm.
If you don't like the exposures you have, then move them closer to the ones you want.
It makes no difference if you're underwater or in profit in your "position accounting"
2/n
If you don't like the exposures you have, then move them closer to the ones you want.
It makes no difference if you're underwater or in profit in your "position accounting"
2/n
There is no difference between a position that you have kept on the book for a while and one you just opened. It's exactly the same exposure either way.
Let's run through these 3 questions using a simple toy trading approach...
3/n
Let's run through these 3 questions using a simple toy trading approach...
3/n
In our toy trading strategy, we have a universe of 3 assets, and each week we want to:
- go long the asset we think will have the highest returns the following week
- go short an equal $ amount of the asset we think will have the lowest returns the following week
4/n
- go long the asset we think will have the highest returns the following week
- go short an equal $ amount of the asset we think will have the lowest returns the following week
4/n
1. What Exposures Do I Want?
To answer this I need some *prediction* of the relative returns of the assets over the following week.
This might be from discretionary views. Or it may be a complex multi-factor model.
Either way, it needs to embrace uncertainty.
5/n
To answer this I need some *prediction* of the relative returns of the assets over the following week.
This might be from discretionary views. Or it may be a complex multi-factor model.
Either way, it needs to embrace uncertainty.
5/n
We don't know which asset will outperform next week.
So our prediction, visualized, might look something like this.
For each asset, we plot next week's return on the x-axis and (our prediction of) the probability of that asset experiencing that return on the y-axis.
6/n
So our prediction, visualized, might look something like this.
For each asset, we plot next week's return on the x-axis and (our prediction of) the probability of that asset experiencing that return on the y-axis.
6/n

The peaks show the expected return of each asset. That's the average return we think we'd get if we could observe next week's returns a huge number of times
(Maybe by rewinding the universe and replaying it again with a different butterfly wing flap)
7/n
(Maybe by rewinding the universe and replaying it again with a different butterfly wing flap)
7/n

But the overlap between the distributions shows us that lots of different outcomes could reasonably happen next week.
There's a reasonable chance that blue outperforms red next week, even though it's not the *expected* result.
8/n
There's a reasonable chance that blue outperforms red next week, even though it's not the *expected* result.
8/n

If there were no overlap in the distributions then we'd be predicting that red was *certain* to outperform blue next week.
If you've traded at all, you know that's dumb.
9/n
If you've traded at all, you know that's dumb.
9/n
Red outperforming blue is the *expected* outcome.
It won't necessarily happen this time but, if our predictions are good, then we'll make money over the long run taking bets like this.
So under our self-imposed trading rules, we want to:
- go long red
- go short blue
10/n
It won't necessarily happen this time but, if our predictions are good, then we'll make money over the long run taking bets like this.
So under our self-imposed trading rules, we want to:
- go long red
- go short blue
10/n

2. What Exposures Do I Have?
In this example, I'm just getting started trading.
I just have some cash.
11/n
In this example, I'm just getting started trading.
I just have some cash.
11/n
3. How do I get closer to 1 from 2, given that:
a) it costs to switch positions
b) my estimates are noisy
c) co-movements of assets are somewhat predictable?
We just have cash. So it costs approximately the same amount to get into any asset exposure.
12/n
a) it costs to switch positions
b) my estimates are noisy
c) co-movements of assets are somewhat predictable?
We just have cash. So it costs approximately the same amount to get into any asset exposure.
12/n
So I go straight into the exposures I want.
I buy x dollars of red and sell x dollars of blue.
Now market stuff happens...
My exposures change size in my portfolio and my predictions change.
So next week, the exposures I want and exposures I have are both different.
13/n
I buy x dollars of red and sell x dollars of blue.
Now market stuff happens...
My exposures change size in my portfolio and my predictions change.
So next week, the exposures I want and exposures I have are both different.
13/n
We ask the three questions again...
1. What exposures do I want?
2. What exposures do I have?
3. How do I get closer to 1 from 2, given that:
a) it costs to switch positions
b) my estimates are noisy
c) co-movements of assets are somewhat predictable?
14/n
1. What exposures do I want?
2. What exposures do I have?
3. How do I get closer to 1 from 2, given that:
a) it costs to switch positions
b) my estimates are noisy
c) co-movements of assets are somewhat predictable?
14/n
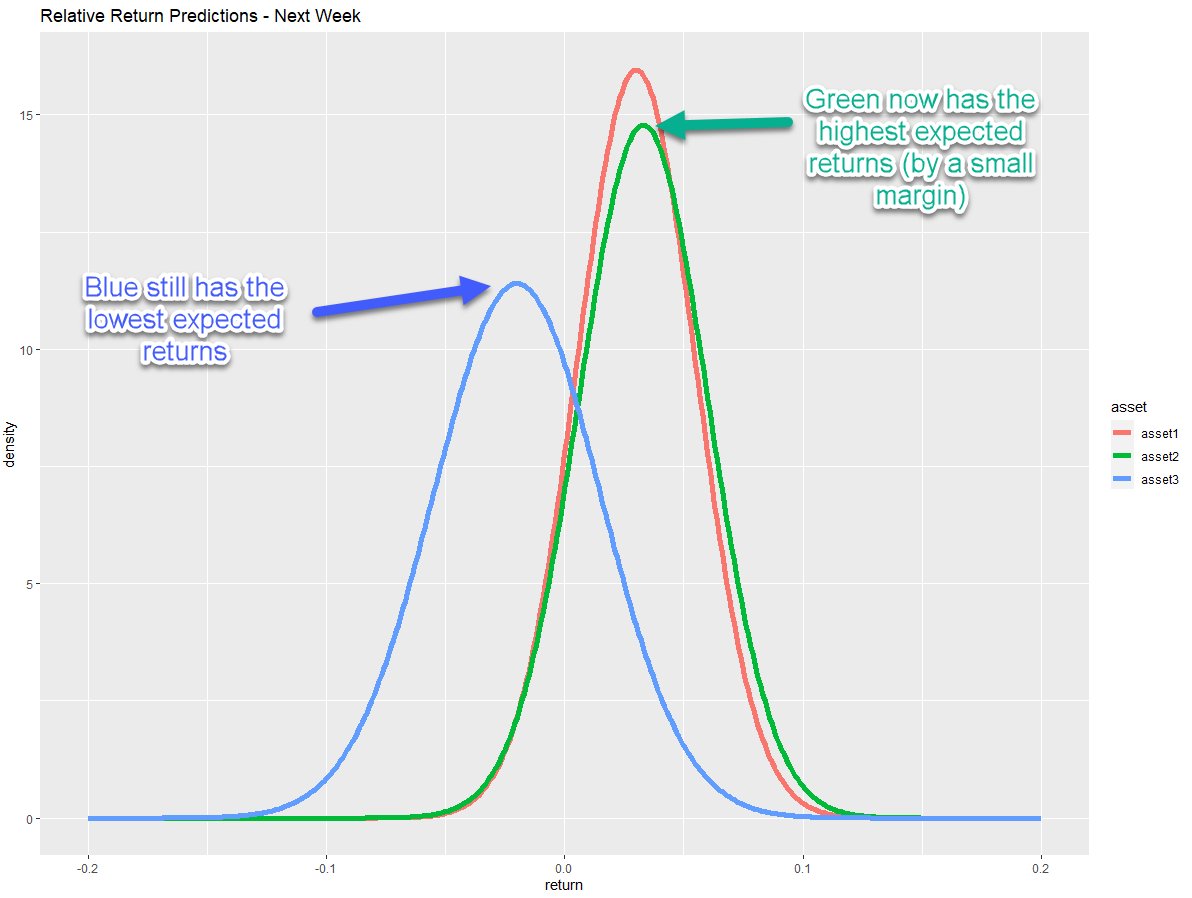
1. What exposures do I want?
Let's say my predictions now look like this...
Blue still has the lowest expected returns.
Green now has the highest expected returns (by a small margin.)
So under ideal conditions, I'd want to be long green and short blue.
15/n
Let's say my predictions now look like this...
Blue still has the lowest expected returns.
Green now has the highest expected returns (by a small margin.)
So under ideal conditions, I'd want to be long green and short blue.
15/n
2. What exposures do I have?
I am long red and short blue.
I started off equal $ in each one, but it will have got somewhat lopsided as prices move.
For simplicity, let's assume not too much.
16/n
I am long red and short blue.
I started off equal $ in each one, but it will have got somewhat lopsided as prices move.
For simplicity, let's assume not too much.
16/n
3. How do I get closer to 1 from 2, given costs to switch positions, and uncertainty in estimates etc?
I can stay in my current exposures (long red, short blue) for free.
To switch exposures to the theoretical ideal ones requires me to sell red and buy green.
17/n
I can stay in my current exposures (long red, short blue) for free.
To switch exposures to the theoretical ideal ones requires me to sell red and buy green.
17/n
If I switch exposures I am paying *certain* trading costs, in exchange for an *uncertain* increase in expected return.
How I feel about that depends on:
- the cost to trade
- the expected increase in expect returns
- other effects such as asset covariance predictions
18/n
How I feel about that depends on:
- the cost to trade
- the expected increase in expect returns
- other effects such as asset covariance predictions
18/n

Likely, though, the small uncertain increase in expected returns is not a reasonable trade-off for paying the *certain* costs to switch position.
So I would keep current positions on.
19/n
So I would keep current positions on.
19/n
If my predictions looked more like this, however, then I would pay up to move towards my theoretical preferred exposures.
The significant increase in expected return probably justifies paying up to switch from long red to long green.
20/n
The significant increase in expected return probably justifies paying up to switch from long red to long green.
20/n

So that's the pattern. Repeatedly ask the 3 questions.
1. What exposures do I want
2. What exposures do I have
3. How do I get closer to 1 from 2, given my constraints and models?
Doesn't matter how you got where you are, or how you make predictions. Ask the questions.
21/21
1. What exposures do I want
2. What exposures do I have
3. How do I get closer to 1 from 2, given my constraints and models?
Doesn't matter how you got where you are, or how you make predictions. Ask the questions.
21/21
• • •
Missing some Tweet in this thread? You can try to
force a refresh


