According to the latest BofA FMS, EM equities are projected to be the best performing asset class in ‘21.
Building a bear case:
-Overbought sentiment
-Crowded reflation positioning
-US fin. conditions at record lows
-Econ. surprises at record highs
Let’s look at some charts.
Building a bear case:
-Overbought sentiment
-Crowded reflation positioning
-US fin. conditions at record lows
-Econ. surprises at record highs
Let’s look at some charts.

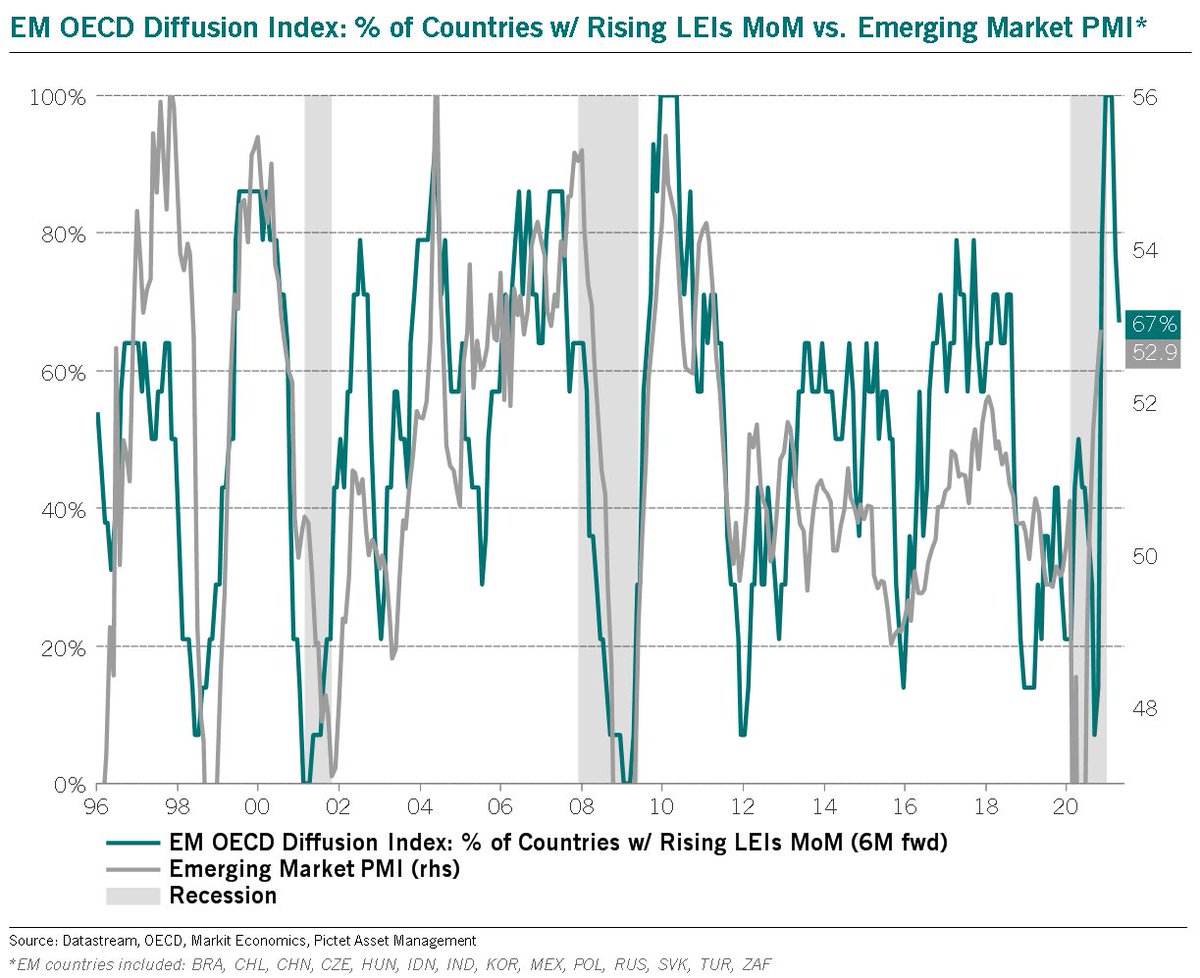
While there’s still room for a further rise in EM PMIs into year-end, the % of EM OECD countries with rising lead indicators MoM is down to 67%, from 100% in July.
There is a 6M lead which means we should peak out by early next year.
Something to keep an eye on.
There is a 6M lead which means we should peak out by early next year.
Something to keep an eye on.
Also, as previously discussed, EM is essentially the inverse correlation of US financial conditions, & today US fin. conditions are at record lows.
Extremely loose financial conditions usually preceded major mkt tops.
Extremely loose financial conditions usually preceded major mkt tops.

Additionally, EM economic surprises are already at new record highs.
We should therefore expect to see 3-6M of negative surprises in EM.
We should therefore expect to see 3-6M of negative surprises in EM.

This has been tough going & a very unpopular view (rightly so), but I’m still thinking the dollar will spike higher & this will impact EM.
Make or break time admittedly.
Make or break time admittedly.

Speculators are very short USD.
The last 6X this happened, the dollar moved higher over time.
The last 6X this happened, the dollar moved higher over time.

Here is the DXY vs. EM in relative terms over 45 years, mirror images.

Also, while EM equities are nowhere near expensive in relative terms, in absolute terms they’re trading at their highest levels since Oct ‘07 on a forward PE basis...

And long-term consensus earnings expectations have already exploded higher.

EM is also looking overbought short-term.
EM equities are currently trading 17% above their 200DMA.
Largest % deviation in over 10Y.
Looking at the previous 11X the % deviation peaked >5%, 10/11X EM equities corrected an average of 19% following this kind of gap.
EM equities are currently trading 17% above their 200DMA.
Largest % deviation in over 10Y.
Looking at the previous 11X the % deviation peaked >5%, 10/11X EM equities corrected an average of 19% following this kind of gap.

Additionally, 95% of EM countries are trading above their 200DMA...

100% of EM sectors...

96% of EM industry groups...

And 81% of EM stocks.

DeMark wise a daily 13 is in play...

Weekly a 9 Setup...
Worked well in the past.
Worked well in the past.

Long-term I’m an EM equity bull, it’s hard not to be looking at this chart.
This technical set-up is undeniably bullish, I’m just not sure we break on this attempt given all the extremes.
Maybe I’m wrong & here we go!
Food for thought.
This technical set-up is undeniably bullish, I’m just not sure we break on this attempt given all the extremes.
Maybe I’m wrong & here we go!
Food for thought.

• • •
Missing some Tweet in this thread? You can try to
force a refresh