1/ Covid (@UCSF) Chronicles, Day 263
Tonight a brief update on our local situation, as 5 Bay Area counties announce that the region will adopt CA’s stay-at-home orders, even before we hit the state’s 15% ICU capacity threshold. tinyurl.com/y3ou56qq It's a prudent move.
Tonight a brief update on our local situation, as 5 Bay Area counties announce that the region will adopt CA’s stay-at-home orders, even before we hit the state’s 15% ICU capacity threshold. tinyurl.com/y3ou56qq It's a prudent move.
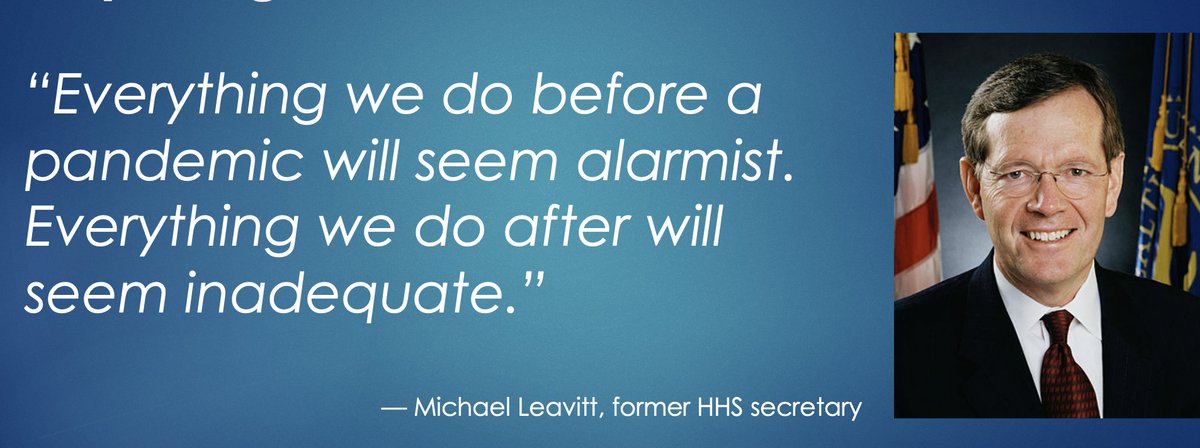
2/ Nobody wants to go backwards – we're all bummed out and exhausted. But in judging the decisions by the governor and our Bay Area leaders, I’m influenced by the words of former @HHSGov secretary @GovMikeLeavitt, below: 
3/ The viral dynamics of Covid make it even harder to react in a timely way – we always have a tendency to act late as the hospitalizations we're seeing now reflect the behaviors and conditions of two weeks ago. It’s like looking at a star: what you see now happened a while ago.
4/ Luckily, over the past 10 months we’ve gotten better at predicting where things are going – by monitoring signals like test positivity rates, case rates, hospitalizations, traffic patterns, upcoming holidays, & yes, ICU capacity. Our improved ability to predict what’s coming…
5/ …makes today's Covid forecasting a bit more like forecasting hurricanes. We now have 1-2 week notice of a gathering storm, and can warn people to take action. Unlike w/ hurricanes, though, the act of taking shelter may not only protect us but can actually decrease the threat.
6/ Does shelter-in-place work? Here, from @UCSF's George Rutherford, is example of France, which saw cataclysmic numbers in Oct-Nov but turned things around in wks, via a tough set of policies.(Note that schools stayed open.) “If they can turn it around, so can we,” says George.

7/ The Bay Area knows how to do this, since we did it in June, when we experienced a surge in numbers similar to today. We shut some activities down & gave people the hard facts – including worst-case scenarios. Our cases, hospitalizations & deaths turned around w/in a few weeks.
8/ But hasn't the mortality rate fallen by 60% since June? Yes, it has. But I’d attribute half of the mortality improvement to medications (mostly steroids, now maybe monoclonals); the rest is likely due to what we’ve learned about caring for Covid patients.
9/ Those latter improvements will evaporate if hospitals get overwhelmed. And we've lost one of our key protections against being crushed: a healthcare version of import/export: busy hospitals importing MDs/RNs from less affected areas when needed, while also exporting…
10/ … patients to other hospitals when the hospitals/ICUs were becoming packed. The problem: with today's pan-national surge, nobody can spare extra beds or extra people. The broad distribution this time has greatly diminished the healthcare system’s capacity for resiliency.
11/ This makes hospitals, EDs and ICUs vulnerable to being overwhelmed. And when that happens, we're sure to see mortality rates spike.
Even before that happens, we’re losing ~2,500 Americans daily. IHME is now projecting more than 539K deaths in the U.S. by April, a truly...
Even before that happens, we’re losing ~2,500 Americans daily. IHME is now projecting more than 539K deaths in the U.S. by April, a truly...
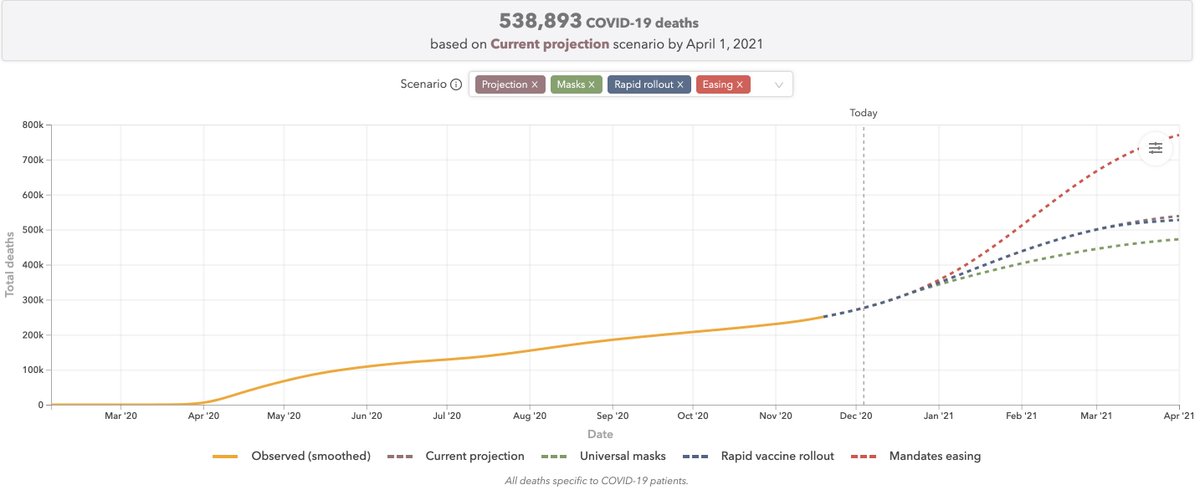
12/ … staggering number, equal to the population of Atlanta.
And, while vaccines are just around the corner, it'll be 2-3 months before enough people get them to make a meaningful dent in overall case and mortality rates. In other words, it's no time to be futzing around.
And, while vaccines are just around the corner, it'll be 2-3 months before enough people get them to make a meaningful dent in overall case and mortality rates. In other words, it's no time to be futzing around.
13/ With that as preamble, let’s look @UCSF's & San Francisco's numbers to get a sense of why our officials are so worried. @UCSFHospitals, we have 36 patients, 8 on ventilators. Both figures are about twice those of a few weeks ago.

14/ Our overall test positivity rate is running 3.3%, with a sharp rise among both symptomatic (8.39%) and asymptomatic patients (1.05%). The latter number means that the person sitting at the next table at a SF restaurant or in the line with you at Target...
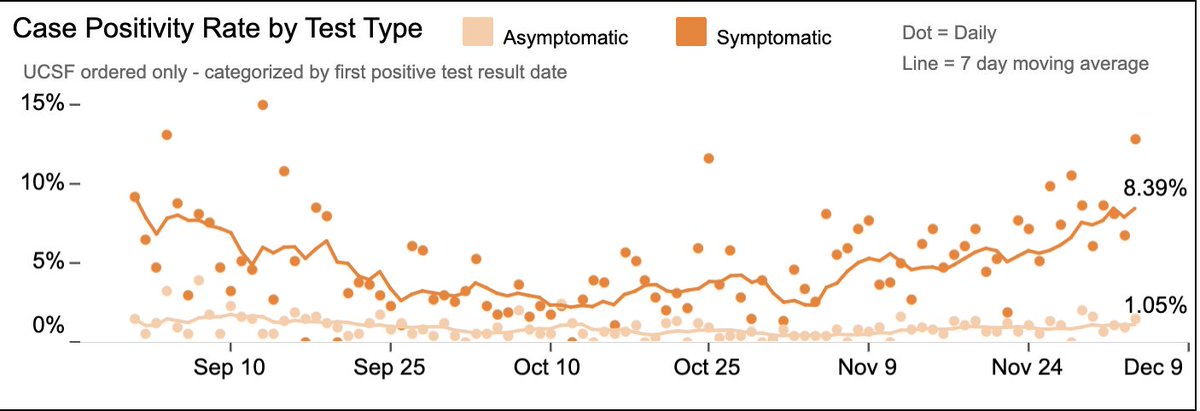
15/ … has a ~1/100 chance of having Covid… even if he/she feels perfectly fine, way up since October.
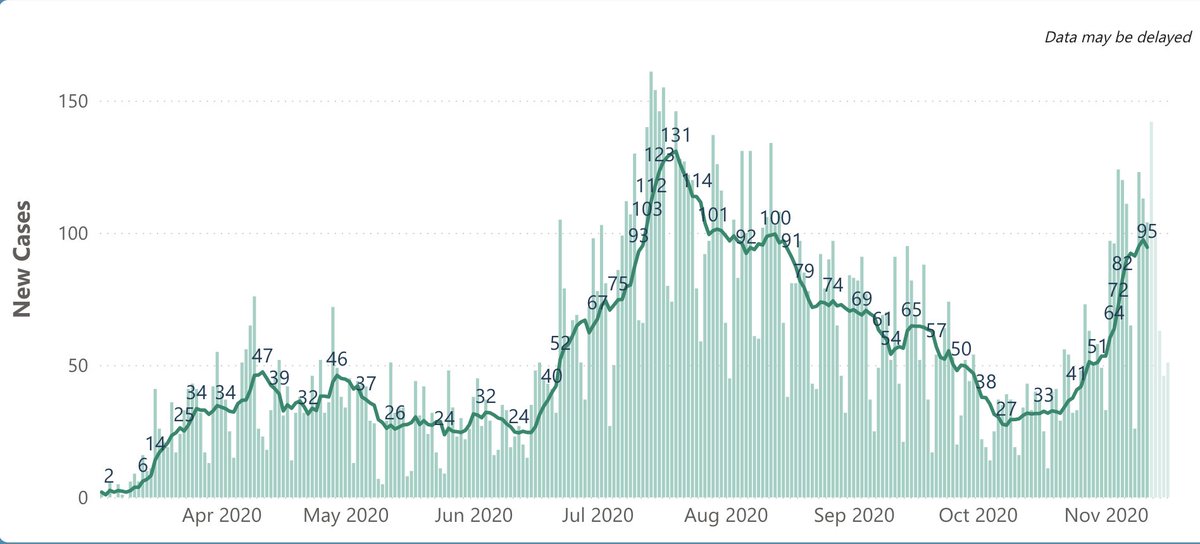
Turning to SF, cases have spiked to 128/day (Fig; I wouldn’t make much of new down blip, probably due to Thanksgiving reporting lag) – compared with ~30 cases/day in October.
Turning to SF, cases have spiked to 128/day (Fig; I wouldn’t make much of new down blip, probably due to Thanksgiving reporting lag) – compared with ~30 cases/day in October.

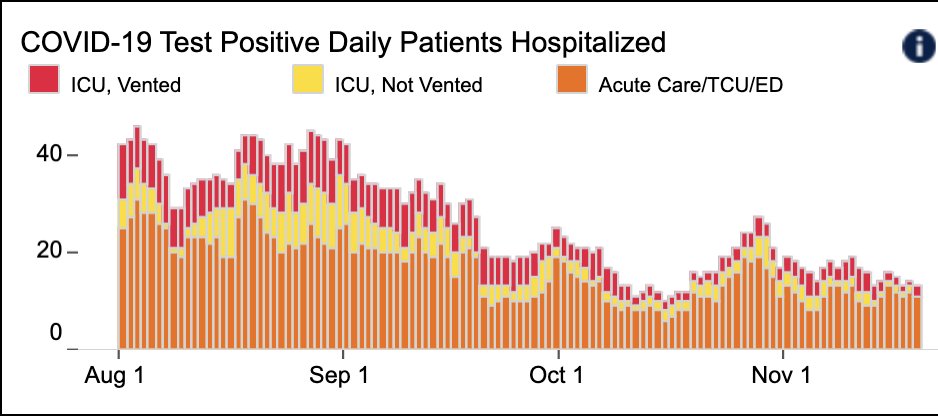
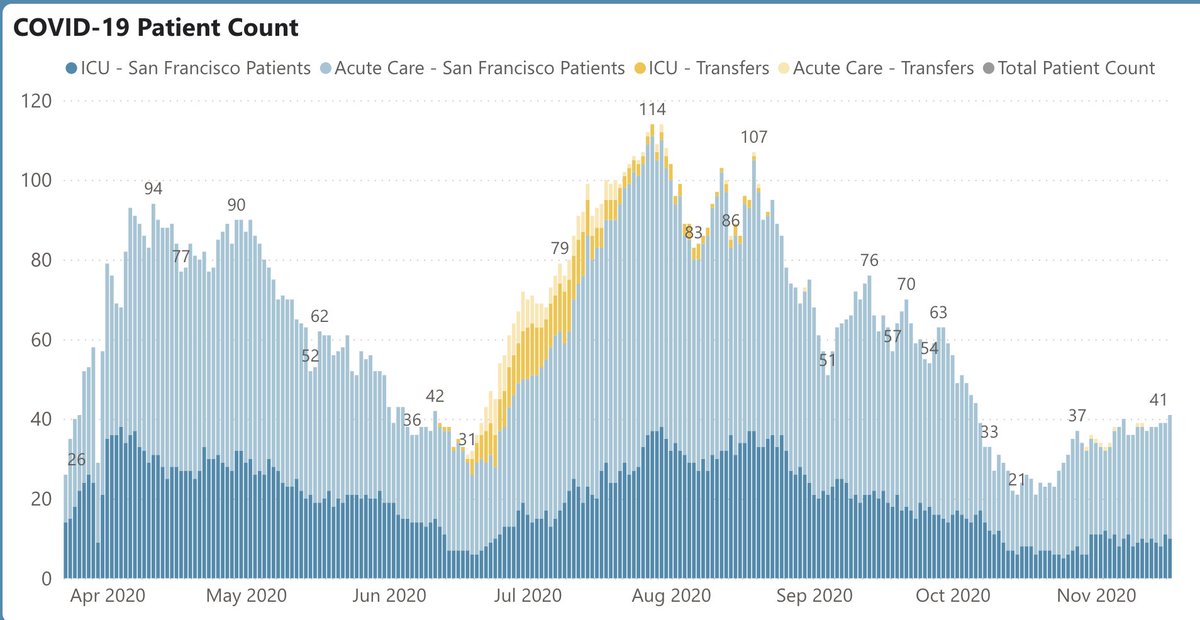
16/ Hospitalizations are also climbing steeply, now at 98, from low in 20s last month (Fig L). ICU pts are rising at a similar clip. And, while we still have some ICU headroom (Fig R), it won’t take much to overwhelm the system, particularly since the limiting factor this time…
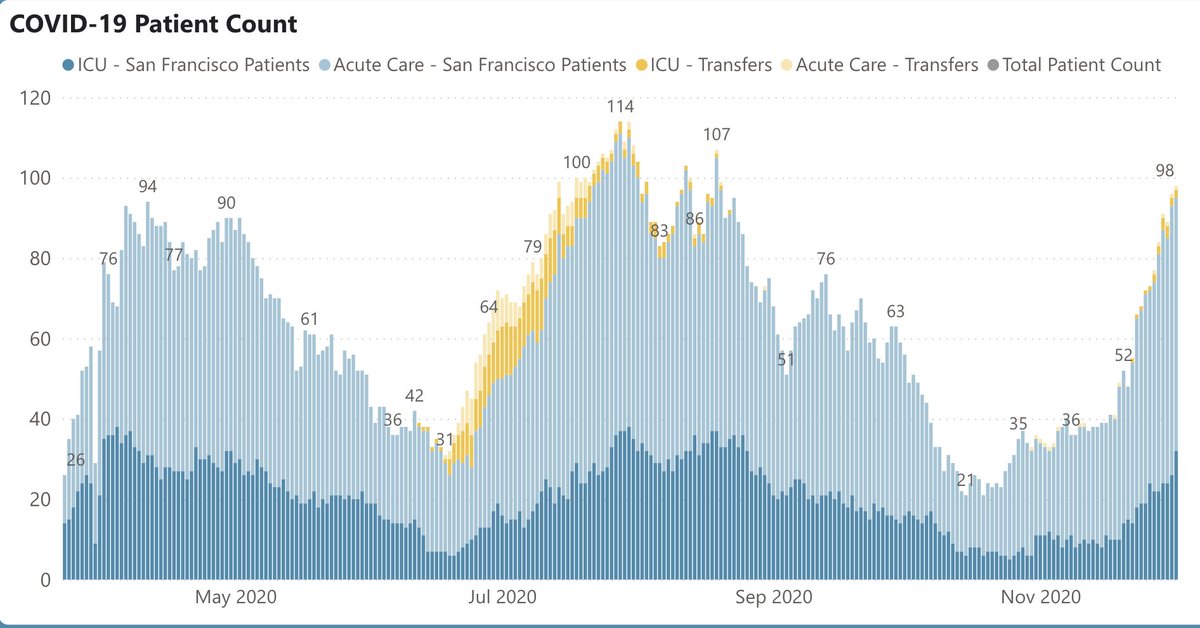

17/ … might not be beds or ventilators, but rather healthcare workers. The Mayo and Cleveland Clinics each currently have >1000 doctors and nurses out because they have Covid tinyurl.com/yypdofqg It could happen in the Bay Area if we don’t turn the ship around fast.
18/ So here we are – coming out of one holiday and entering another, the weather is getting colder, and case and hospitalization rates are all heading in the wrong direction. To wait longer to take aggressive action – as painful as it is – just feels too risky.
19/ In SF, the combo of good leadership & followership has saved many, many lives. CA has done less well, but still better than many tinyurl.com/t9j9fdw. Below: deaths/100K people in SF, LA, CA, & US:
SF: 18/100K
LA: 78/100K
CA overall: 50/100K
US overall: 83/100K
SF: 18/100K
LA: 78/100K
CA overall: 50/100K
US overall: 83/100K
20/ This means that if the U.S. had SF’s per capita mortality rate, the nation would have had ~60,000 deaths, not 276,000.
And while California's huge population always makes our raw numbers look high, if the U.S. had mirrored CA’s rate, the U.S. would have ~110K fewer deaths.
And while California's huge population always makes our raw numbers look high, if the U.S. had mirrored CA’s rate, the U.S. would have ~110K fewer deaths.
21/ To me, this means that our leaders – in SF & CA – have earned our trust. It’s not about whether they're perfect – they’re not (Exhibit A: French Laundry tinyurl.com/y3lpaplf). It’s about what we all need to do to save lives, until help arrives in the form of vaccines.
• • •
Missing some Tweet in this thread? You can try to
force a refresh