Latest data on COVID-19 admissions and deaths in English hospitals.

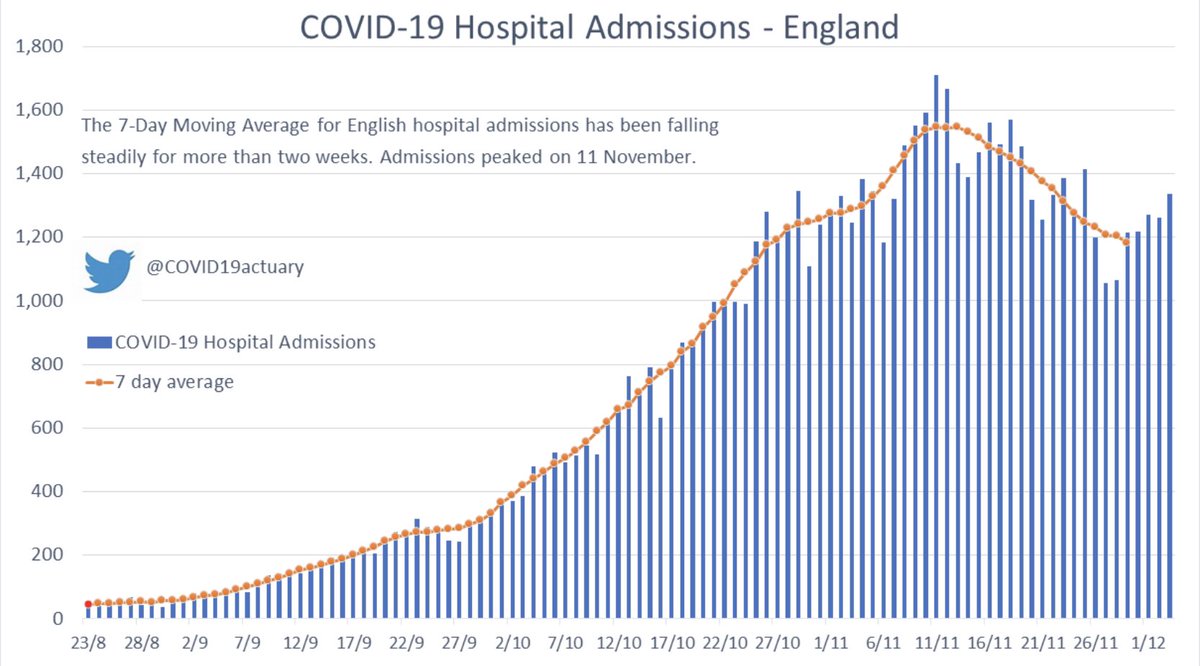
Despite a couple of days with admissions above trend, the 7-Day Moving Average for hospital admissions at notional level continues to fall. 1/4 Image
Our R estimate is based on hospital admissions is up slightly for England as a whole, at just over 0.9.

We are keen to emphasise that this is a composite of different regions with different patterns of infections. 2/4 Image
The average number of COVID-19 deaths in English hospitals has now begun to fall, having peaked at around 300 deaths a day.

We hope and expect that this will continue follow admissions downward for at least the next couple of weeks. 3/4 Image
A more varied regional picture today. The Midlands, East and SE have all increased in the last couple of days, whereas other areas continue to fall, with the SW performing particularly well. Of note, in the SE and E, the 7DMA is still around 50% higher than on Nov 5th. 4/4 Image

• • •

Missing some Tweet in this thread? You can try to force a refresh
 

Keep Current with COVID-19 Actuaries Response Group

COVID-19 Actuaries Response Group Profile picture

Stay in touch and get notified when new unrolls are available from this author!

Read all threads

This Thread may be Removed Anytime!

PDF

Twitter may remove this content at anytime! Save it as PDF for later use!

Try unrolling a thread yourself!

how to unroll video
  1. Follow @ThreadReaderApp to mention us!

  2. From a Twitter thread mention us with a keyword "unroll"
@threadreaderapp unroll

Practice here first or read more on our help page!

More from @COVID19actuary

8 Dec
Latest data on COVID-19 admissions and deaths in English hospitals.

After a week with admissions above trend, the 7-Day Moving Average for hospital admissions is rising again nationally.

As ever, the regional picture (below) is key to understanding the national picture. 1/4 Image
Based on recent hospital admissions we estimate that R went back above 1.0 for England as a whole, during the second half of November.

We are keen to emphasise that this is a composite of different regions with different patterns of infections. 2/4 Image
The average number of COVID-19 deaths in English hospitals continues to fall, having peaked at around 300 deaths a day.

We expect this will continue follow admissions, which means further falls in the short term, but increased admissions may be replicated in the deaths too. 3/4 Image
Read 4 tweets
26 Nov
Latest data on COVID-19 admissions and deaths in English hospitals.

At national level, the 7-Day Moving Average for hospital admissions has now been falling for more than a week.

The regional picture is key to understanding the national dynamics - see detail below. 1/4
Our R estimate is based on hospital admissions and has fallen to around 0.9 for England as a whole.

Again, we emphasise that this is a composite of different regions with different patterns of infections. 2/4
The average number of COVID-19 deaths in English hospitals has risen to around 300 deaths per day, after a couple of days with higher numbers reported.

We hope and expect that this will plateau in the coming days, and then follow the admissions downward. 3/4
Read 4 tweets
24 Nov
Latest data on COVID-19 admissions and deaths in English hospitals.

At national level, the 7-Day Moving Average for hospital admissions has now been falling steadily for a week.

The regional picture is key to understanding the national dynamics - see detail below. 1/4 Image
Our R estimate is based on hospital admissions and has fallen to around 0.9 for England as a whole.

Again, we emphasise that this is a composite of different regions with different patterns of infections. 2/4 Image
The average number of COVID-19 deaths in English hospitals has been fairly flat for a few days at around 280 death per days.

The last few days currently look lower, even allowing for typical reporting delays, but this seems too early to be a genuine fall. 3/4 Image
Read 4 tweets
14 Nov
The Sat update on England admissions and deaths, starting with a continued upswing in admissions. The 7 day MA is up 18% on the week, a week ago it was just 9%. This appears to be a national trend, and is broadly consistent with the infection trend recently reported by REACT. 1/4
Consequently our estimate of R continues to rise, and is now approaching 1.2, after falling close to 1.0 a week ago. Was the dip last week due to half term, or maybe the recent increase is a result of last minute activity in anticipation of the second lockdown? 2/4
The regional picture for admissions confirms an upswing everywhere in the last few days, even the NW which had been falling at around 10% per week. The four southerly regions all saw their highest 2nd wave day yet reported today, so this isn't just an issue for the north. 3/4
Read 4 tweets
12 Nov
Latest data on COVID-19 admissions and deaths in English hospitals.

At national level, hospital admissions are rising more quickly again, following a week when the 7-day moving average was increasing more slowly.

Regional picture is key to understanding this - see below. 1/4 Image
The acceleration in the growth of hospital admissions means that our estimate of R has begun to rise again and is slightly above 1.1 at the last point we can estimate. 2/4 Image
The deaths picture has also worsened in recent days, with larger numbers announced Tues, Weds and today.

We’re now averaging over 240 deaths a day in English hospitals. It’s remarkable that we already know about 260 deaths from 9 Nov; more to be announced in comings days. 3/4 Image
Read 4 tweets
3 Nov
The latest update on England admissions and deaths following the weekend catch-up of deaths. Admissions growth has slowed in the last few days, with the doubling time extending to around 3 weeks. Let's hope this slowdown is maintained in the coming days. 1/4
Similarly the increase in deaths has slowed from the doubling every 10 days we were seeing a week or so ago, once we adjust for estimated late reporting delays. Hopefully this will slow further in a week or so in line with the admissions figures above. 2/4
After a period of stability, our estimate of R has dipped a little to 1.2, consistent with the admissions slow down. It relates to mid Oct, so we should be starting to see some of the benefits of restrictions introduced around then, particularly in the North. 3/4
Read 4 tweets

Did Thread Reader help you today?

Support us! We are indie developers!


This site is made by just two indie developers on a laptop doing marketing, support and development! Read more about the story.

Become a Premium Member ($3/month or $30/year) and get exclusive features!

Become Premium

Too expensive? Make a small donation by buying us coffee ($5) or help with server cost ($10)

Donate via Paypal Become our Patreon

Thank you for your support!

Follow Us on Twitter!