
Latest data on COVID-19 admissions and deaths in English hospitals.
At national level, the 7-Day Moving Average for hospital admissions has now been falling for more than a week.
The regional picture is key to understanding the national dynamics - see detail below. 1/4
At national level, the 7-Day Moving Average for hospital admissions has now been falling for more than a week.
The regional picture is key to understanding the national dynamics - see detail below. 1/4

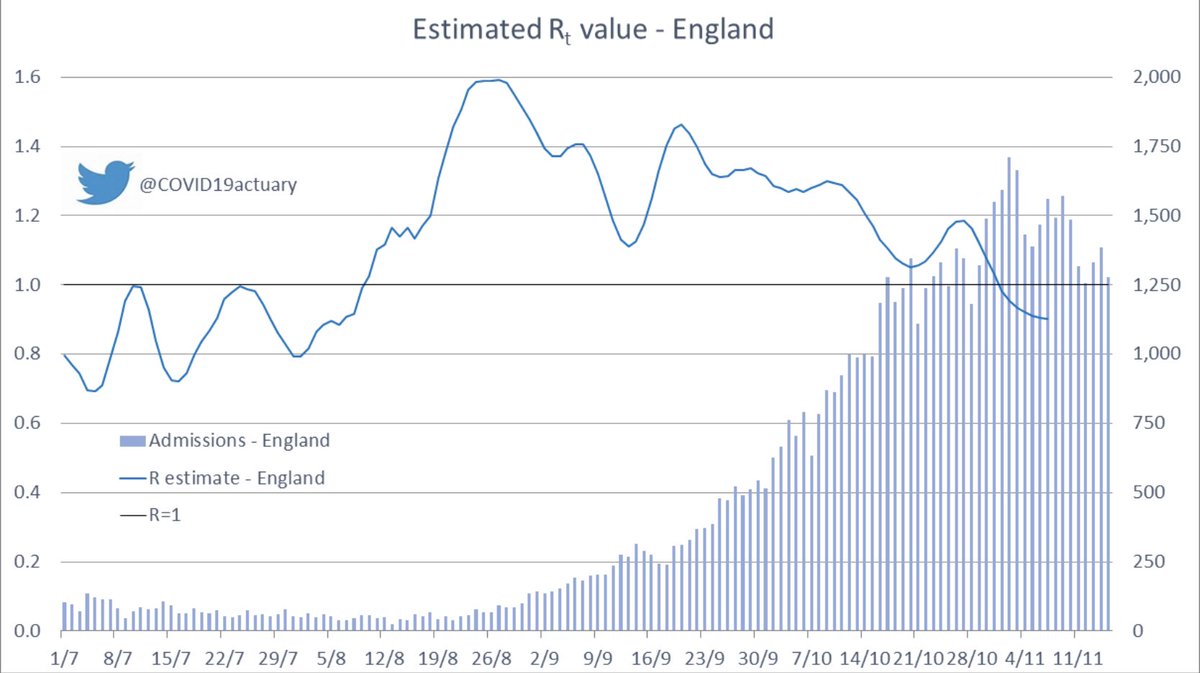
Our R estimate is based on hospital admissions and has fallen to around 0.9 for England as a whole.
Again, we emphasise that this is a composite of different regions with different patterns of infections. 2/4
Again, we emphasise that this is a composite of different regions with different patterns of infections. 2/4
The average number of COVID-19 deaths in English hospitals has risen to around 300 deaths per day, after a couple of days with higher numbers reported.
We hope and expect that this will plateau in the coming days, and then follow the admissions downward. 3/4
We hope and expect that this will plateau in the coming days, and then follow the admissions downward. 3/4

Regionally, the North, Midlands and SW are showing sustained strong falls and London appears to be "on the turn" in the last couple of days. The East is level, but the SE moving average is continuing to increase constantly, in contrast to the rest of the country. 4/4

• • •
Missing some Tweet in this thread? You can try to
force a refresh


