1/ The Trend is Our Friend: Risk Parity, Momentum and Trend Following in Global Asset Allocation (Clare, Seaton, Smith, Thomas)
"We examine the effectiveness of trend following for global asset allocation (equities, bonds, commodities, real estate)."
papers.ssrn.com/sol3/papers.cf…
"We examine the effectiveness of trend following for global asset allocation (equities, bonds, commodities, real estate)."
papers.ssrn.com/sol3/papers.cf…

2/ Five major asset classes: Developed equity indicces, emerging equity indices, gvt bonds, commodities, real estate
Trend following = long/Tbill based on MA signals, rebalanced monthly
Risk parity = inverse vol weighting using trailing 12-month volatility
No transaction costs


Trend following = long/Tbill based on MA signals, rebalanced monthly
Risk parity = inverse vol weighting using trailing 12-month volatility
No transaction costs


3/ "Trend following shows considerable risk-adjusted performance improvements compared to their equally-weighted portfolios.
"Long-only trend will underperform buy-and-hold during major bull markets. This is the scenario largely witnessed for bonds during the period of study."

"Long-only trend will underperform buy-and-hold during major bull markets. This is the scenario largely witnessed for bonds during the period of study."


4/ "We decompose each asset class into its components and then apply the trend following rules.
"We observe an improvement in risk-adjusted returns compared to the broad trend following asset class models in Table 1. Splitting an asset class into its component parts adds value."
"We observe an improvement in risk-adjusted returns compared to the broad trend following asset class models in Table 1. Splitting an asset class into its component parts adds value."

5/ "Applying risk parity *within* an asset class results in very little difference in risk-adjusted performance.
"The implication may be that risk parity has been exceptionally successful in recent times due to the impressive risk-adjusted returns of bonds."

"The implication may be that risk parity has been exceptionally successful in recent times due to the impressive risk-adjusted returns of bonds."


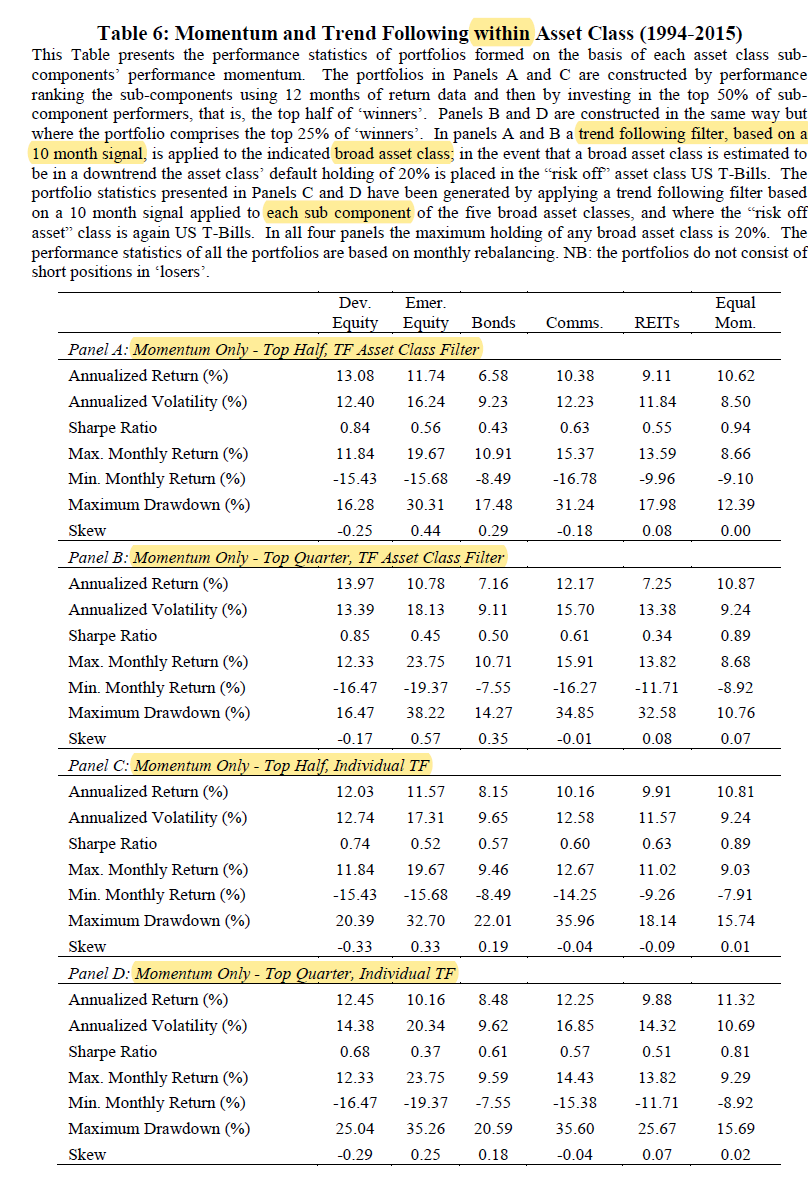
6/ "For momentum-based rules *within* each of the five asset classes, there is improvement in risk-adjusted performance relative to the base case equally-weighted portfolio in Table 1. However, it produces inferior performance statistics to trend following in Table 3." 

7/ "The far-right column of Table 6 reports the statistics for a portfolio made up of 20% in each of the five simultaneously momentum-ranked and trend-filtered asset classes, rebalanced monthly. These, too, show a substantial improvement on the equivalents in Table 5." 


8/ "For volatility-adjusted momentum ranking within each asset class, we observe very little difference compared with the standard results in Table 5. The combined portfolios in the far-right column have almost identical Sharpe ratios to their volatility-unadjusted equivalents." 

9/ "Table 8 presents the results of volatility-adjusted momentum weighting within each asset class combined with the ten-month trend following rule.
"Volatility-adjusting the momentum weights offers some small improvement here."
"Volatility-adjusting the momentum weights offers some small improvement here."

10/ "We now rank all 95 of the markets by volatility-adjusted momentum with no differentiation made with respect to the asset class to which they belong.
"The benefit of this flexible approach is that it removes some prejudices from the portfolio's composition."
"The benefit of this flexible approach is that it removes some prejudices from the portfolio's composition."

11/ "Table 10 reports the performance of that flexible momentum approach with individual trend following (10 month signal) applied to each instrument.
"Consistent with our earlier findings, trend following substantially reduces volatility and drawdowns."


"Consistent with our earlier findings, trend following substantially reduces volatility and drawdowns."


12/ "While risk factors provide a statistically significant contribution, there remains a significant alpha which is at least two-thirds of the level of the raw excess returns."
BAR = Barclays Agg Bond Index
DJUBS = DJ UBS Commodity futures index
Also: five hedge-fund factors

BAR = Barclays Agg Bond Index
DJUBS = DJ UBS Commodity futures index
Also: five hedge-fund factors


13/ Taking higher moments into account results in "sharply improved evaluations of trend following and combined momentum+trend strategies due to low maximum drawdowns and mild positive skewness.
"Trend following should be strongly favored over momentum by risk-averse investors."

"Trend following should be strongly favored over momentum by risk-averse investors."


14/ Related research:
Leverage Aversion and Risk Parity
Volatility-Adjusted Momentum
Cross-Sectional and Time-Series Tests of Return Predictability: What Is the Difference?
Leverage Aversion and Risk Parity
https://twitter.com/ReformedTrader/status/1225582088369258496
Volatility-Adjusted Momentum
https://twitter.com/ReformedTrader/status/1163915680137150464
Cross-Sectional and Time-Series Tests of Return Predictability: What Is the Difference?
https://twitter.com/ReformedTrader/status/1141106490083692544
• • •
Missing some Tweet in this thread? You can try to
force a refresh


