This semester I had the pleasure to teach data visualization studio at an elite US university. Many students were interested in social justice (being 2020 in the US). Yet, many approached the topic in a way that was a bit naive ... (thread🧵) /1
Their instincts were to create projects that "brought attention to the issue." But since this was a hands-on class, where students had to build instead of arguing, we had to push them beyond these first instincts. /2
The class required them to go beyond stating the problem, or assigning blame. They not only had to suggest a solution, they had to implement it. And in that act of making, is where the deepest lessons took place. /3
One group of students created a recommendation tool focused on the diversity of books and reading lists. This was a great idea, but also, one that required them to implement things that were uncomfortable to them. /4
Building required creating a visual language to represent categories such as race and gender, not just criticizing how other people did it. The students also wanted to show intersectionality, which was also challenging. /5
Doing the project was much harder than advocating for its need. The exercise required them to go beyond the narrative of what others should do. It required them to lead by example, by making concrete choices for both, the visual language and the user interface. /6
And in that process, they made decisions that they would themselves then criticize. They made choices that made them uncomfortable, and that invited them to think about alternatives, trade-offs, and compromises. /7
This made them realize that what they saw in the world was not a mere reflection of other people's intentions or values. That even with good intentions, it is hard to get things perfect. /8
So the true lesson was not on graphic design or programming. These are talented students that already had a great technique. It was a lesson on perspectives, that can only be taught through the art of making. /9
Other groups went through a similar process. Empowering them to implement a solution led them to reach to multiple people in the problem spaces they were working on, and developed a more nuanced understanding of the issues they were concerned about. /10
In academia we focus so much on what we can learn with our eyes and ears, that we forget that some of the most important lessons can only be learned with our hands. /11
It is our hands that are limited. It is our ability to make what frustrates us. And it is that frustration, the one that comes from trying your best, and still falling short, the one that is the true master. /12
So in these difficult times, when everyone has an opinion, but few are willing to adventure solutions, that we need to remember the value of building in learning. /13
We have a saying in Chile: criticizing a musician is easy, but it is more difficult "when you have a guitar in your hand." It is our hands the ones that teach us humility, and it is that humility what teaches us understanding. /14 _END
• • •
Missing some Tweet in this thread? You can try to
force a refresh
Map Time!
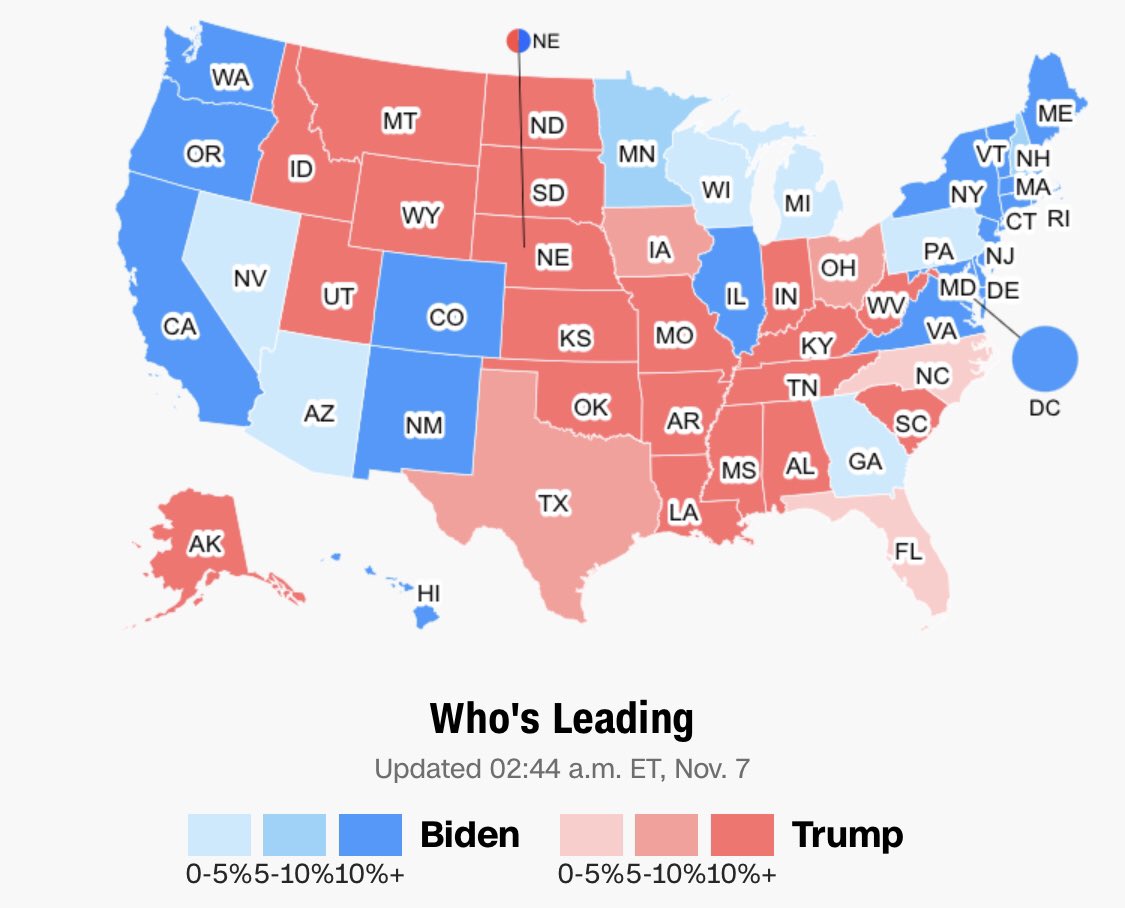
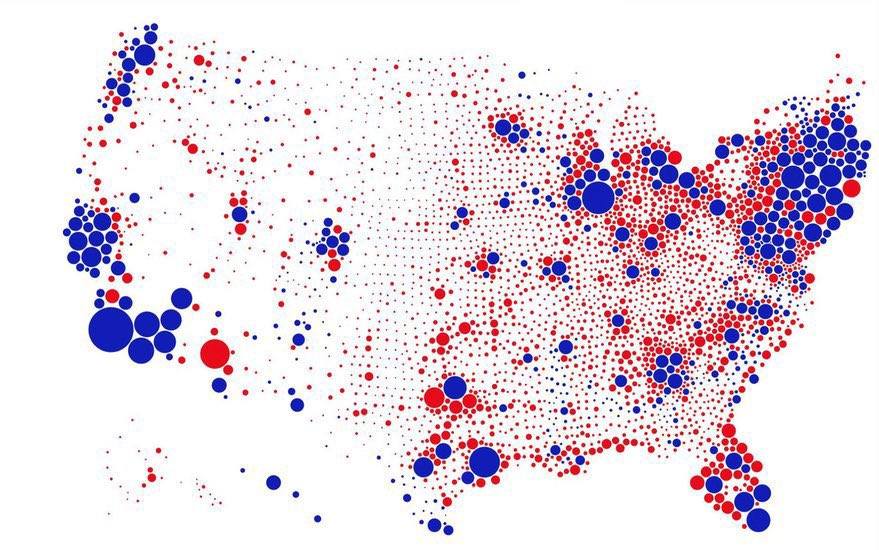
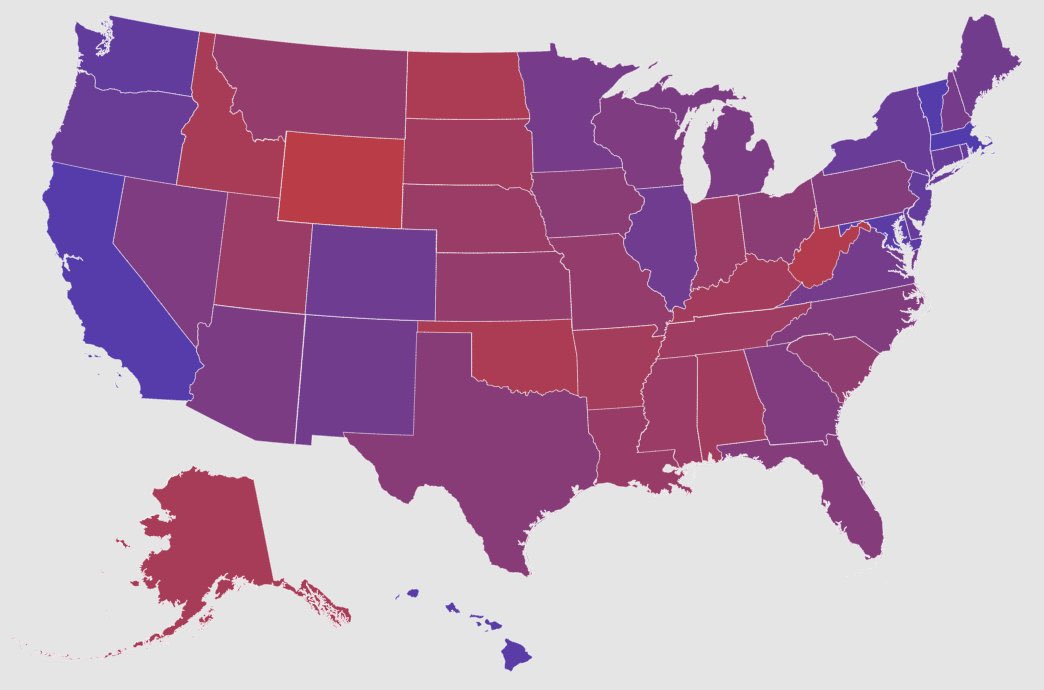
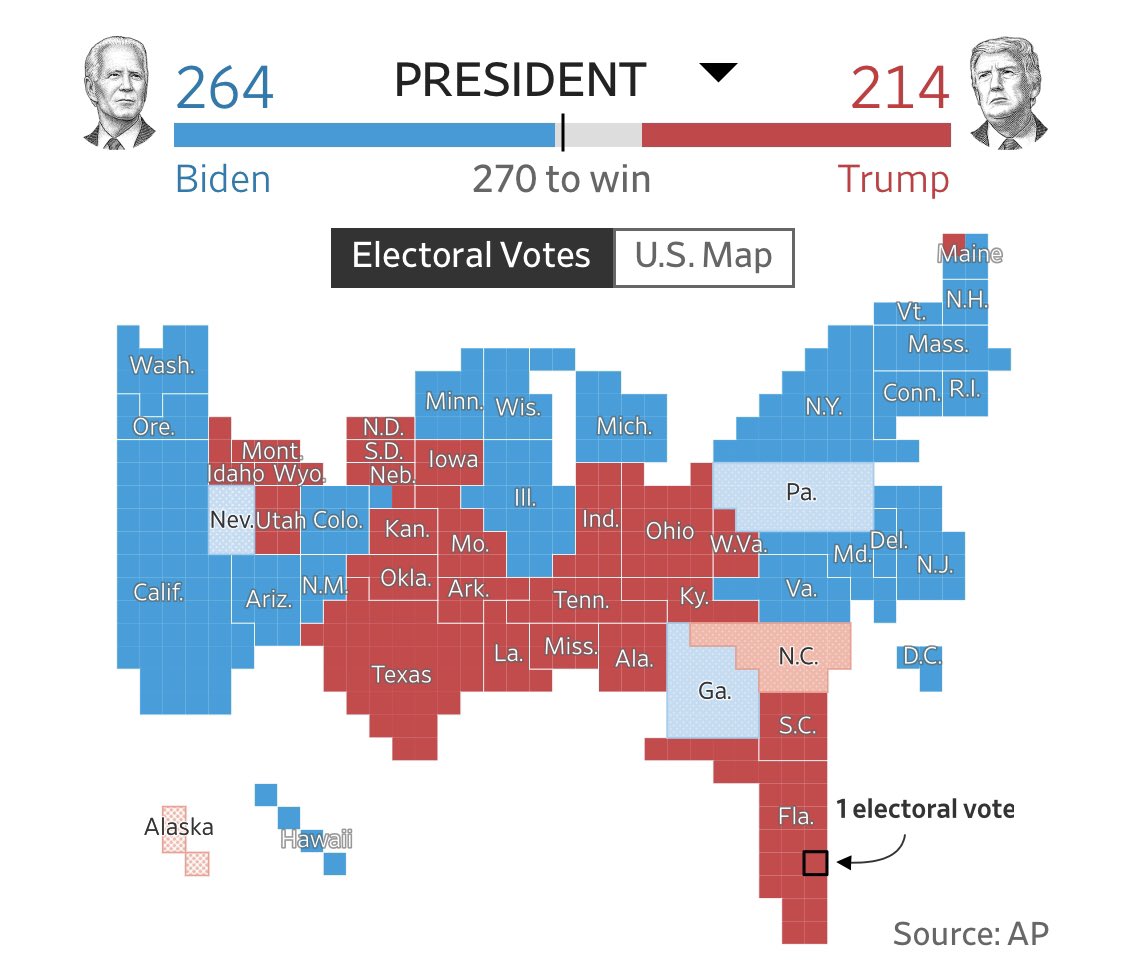
So you’ve seen a lot of maps in the last few days. What maps work, which ones don’t, and how to think about them? Time for a thread ! /1
To begin, let’s go through some data visualization basics. Data visualization, is the use of graphical metaphors to represent quantities. The fact that visualization are metaphors, however, is often forgotten. 2/
Think of a scatter plot showing age vs income. Age is measured in years. Income in dollars, but in a scatter plot they are both represented in inches (a spatial metaphor!). 3/
Biden squeezing by to win the 2020 election like...
But in all earnest there are a few lessons we all need to reflect on (thread). 1/
1. The election will leave many people unsatisfied. With 71+ million votes for Biden, and 68+ million votes for Trump, this is the largest number of votes casted in a US presidential election (Biden is the most voted ever). Yet, a 270-268 victory is unsatisfying in two accounts:
It will of course be unsatisfying to the 68+ million Americans who voted for Trump. But those who voted for Biden expected a repudiation of Trump’s government & a landslide win. That didn’t happen. This is America.
Today I am leaving the US.
With my family we are exploring a new life in the south of France.
I’ve been in the US for more than 16 years. I earned my citizenship & experienced many ups & downs. But I am grateful. The US was good to me in many ways ...
/1
I published 3 books & about 60 academic papers. I started a company that employs dozens of people & has clients throughout the world. I ran a lab for 9 years at one of the countries top universities. I was invited to the main stage of Ted and to Davos.
/2
I met millionaires, billionaires, movie stars, & rock stars. I had my work published in “The Times.” I hanged out with Nobel prize winners in their darkest moments. I experienced hype & betrayal. I saw the belly of the beast, from the inside, as I rose, fell, & stood up again. /3
He visto este tuit varias veces. Lamentablemente, la tesis que presenta no es correcta. Holanda es un gran RE-exportador de productos vegetales, y su volumen exportador se explica por logística, no agricultura. Veamos los datos? (1/N) 🧵 oec.world/en/profile/bil…
1. Holanda si exporta muchos productos vegetales (USD 29.4B el 2018, 3ero en el 🌎), pero importa mucho (USD 21.7B, 4to en el 🌎). La población de Holanda no explica este volumen importador. Lo que pasa es que productos agr. entran a granel en los puertos y salen empaquetados.
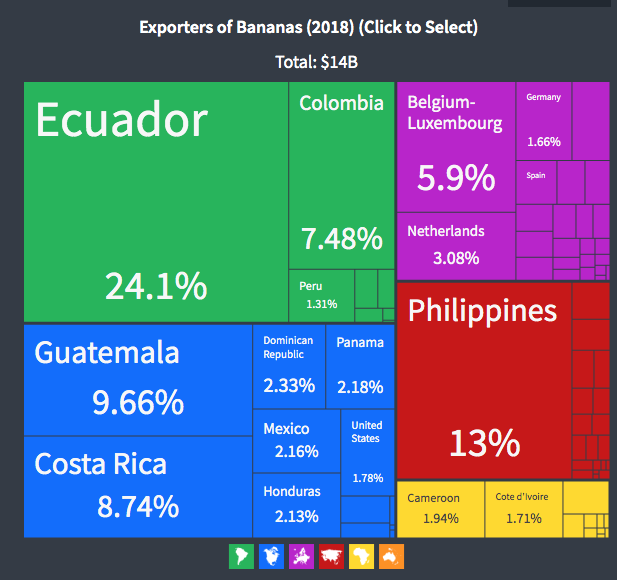
Por ejemplo, Holanda exporta mas bananas (si, estas que no crecen en Holanda), que Mexico, Honduras, o la Rep. Dominicana! (Belgica es incluso mas bananero) oec.world/en/profile/hs9… oec.world/en/profile/bil…
La complejidad económica ha sido debatida en Chile las ultimas semanas. Lamentablemente, incluso los expertos entienden poco que es la complejidad o como se mide. Acá un hilo y un artículo aclarando varios malos entendidos. ciperchile.cl/2020/09/01/mit… (1/N)
Mito 1: La complejidad económica es equivalente a la diversificación exportadora.
FALSO!
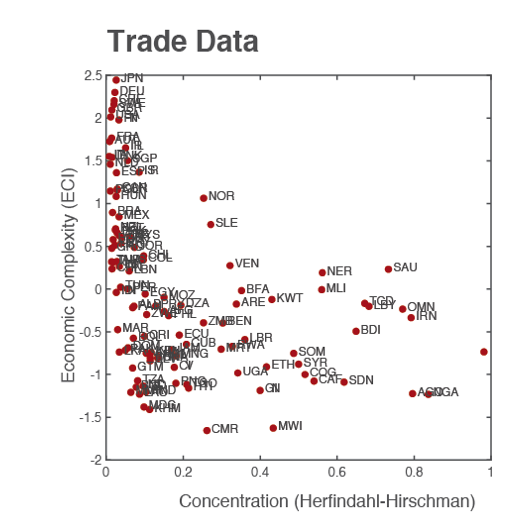
La complejidad económica es técnicamente perpendicular a la diversificación o concentración de exportaciones.
Mito 2: La complejidad económica es una medida de las exportaciones.
FALSO.
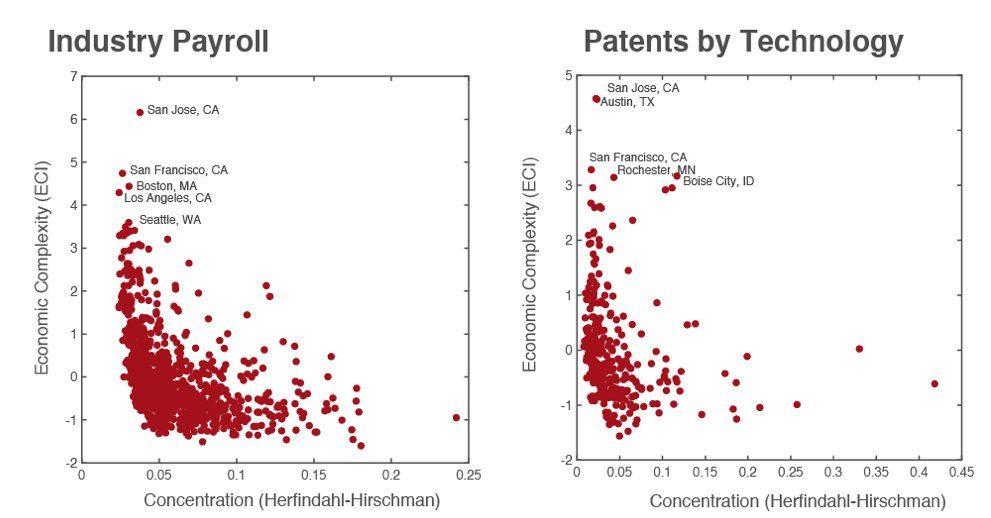
La complejidad económica se ha estimado usando datos de empleo, patentes, salarios, etc. a nivel de municipio o estado para muchos países. Complejidad y exportaciones son cosas muy distintas.
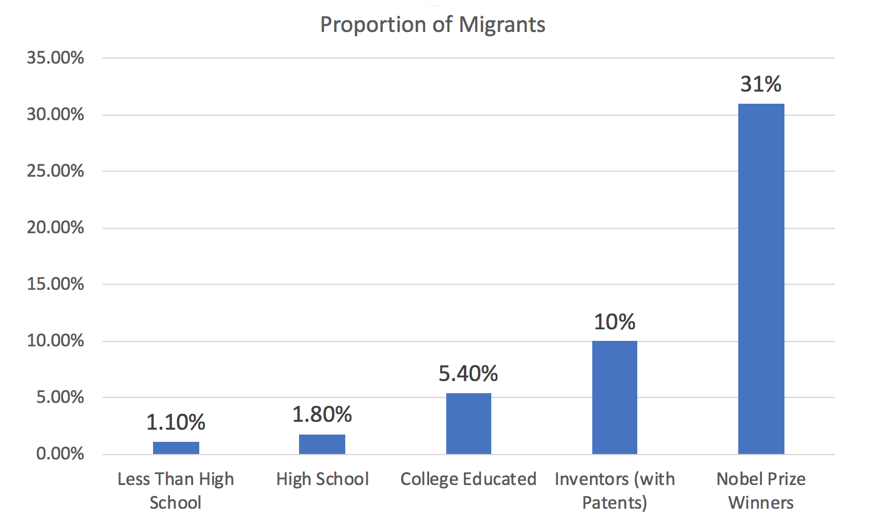
High skill migrants (e.g #H1B visa holders) are an engine of economic growth & innovation. Don't believe me? Here is a thread with some stats... 1. High skilled people are more prone to migrate, so they are hard to get an easy to lose...
2. About 40 percent of Fortune 500 companies in America were founded by immigrants or their children.
3. Immigrants account for half of the founders of America’s unicorns.