The Job Openings and Labor Turnover Survey continues to show weaker levels of hires than before the recession hit.
Any hope for a quick recovery is off the table unless Congress acts now.
Last week, the Bureau of Labor Statistics (BLS) reported that, as of the middle of November, the economy was still 9.8 million jobs below where it was in February and job growth slowed considerably in November. epi.org/press/recovery…
JOLTS data show little change, a clear and confirming sign that the recovery is not charging ahead. Hiring and job openings are below where they were before the recession hit, which makes it impossible to recover anytime soon, when we have such a massive hole to fill in.
In October, job openings rose mildly (6.5 to 6.7 million) while hires softening slightly (5.9 to 5.8 million). Separations increased (4.8 to 5.1 million), largely due to an unfortunate increase in layoffs (1.4 to 1.6 million).
On the whole, the U.S. economy is seeing a significantly slower pace of hiring than we experienced in May or June—hiring is roughly where it was before the recession, which is a big problem given that we have only recovered just over half of the job losses from this spring.
Job openings are substantially below where they were before the recession began (6.7 mil at the end of October, compared to 7.1 mil on average in the year prior to the recession). And today’s data release only covers through October so it doesn’t even capture the recent slowdown.
One of the most striking indicators from today’s report is the job seekers ratio, the ratio of unemployed workers to job openings. 10.9 mil unemployed workers and only 6.7 mil job openings translates into a job seeker ratio of about 1.6 unemployed workers to every job opening.
Another way to think about this: for every 16 workers who were officially counted as unemployed, there were only available jobs for 10 of them. That means, no matter what they did, there were no jobs for 4.2 million unemployed workers.
And this misses the fact that many more weren’t counted among the unemployed. The economic pain remains widespread with over 26 million workers hurt by the coronavirus downturn. We are facing a slow, painful recovery. epi.org/blog/the-econo…
• • •
Missing some Tweet in this thread? You can try to
force a refresh
Today, six months into the recession, when the labor market has seen the sharpest employment declines in our lifetimes, we will get the latest jobs data and learn about how workers are faring. It will confirm what we already know: continuing economic pain. epi.org/blog/what-to-w…
Today, the BLS reports an increase of 1.4 million jobs in August. In normal times, this would be an enormous jump, but it represents a noted slowdown in the pace of job growth. At this point, the U.S. economy is still down 11.5 million jobs from where it was in February.
In August, the economy is still down 11.5 million jobs from where it was in February (11.8 million if you remove the temporary Census jobs). With this kind of slowing job growth we've seen over the last couple months, it will take years to return to the pre-pandemic labor market.
After historically fast growth in May and June, July's jobs report is sure to disappoint. Because so many jobs were lost in March and April, the economy remains 14.7 million jobs short, and a full recovery even with rapid growth is many months away. epi.org/press/two-mont…
2/
As COVID-19 has spread rapidly throughout the country, various other data released since the jobs report reference period in mid-June suggest—at best—a stalled recovery. At worst, we could see job losses for July.
3/
The U.S. economy remains in an enormous jobs deficit—we were down 6.4 million jobs at the end of April (according to the JOLTS data), and down 19.6 million at the middle of May (according to the monthly employment data). 1/n epi.org/blog/the-u-s-e…
The JOLTS data showed that 6.4 million jobs were lost from the end of March to the end of April. The monthly jobs report straddle these numbers, showing that 20.7 million jobs were lost from mid-March to mid-April, and 2.5 million jobs were gained from mid-April to mid-May. 2/n
Together, the JOLTS data and the monthly employment numbers paint a picture of the peak of job loss in this recession being in late March or early April, and people beginning to go back to work by the beginning of May. epi.org/press/while-we…
3/n
State of Working America Wages 2019: A story of slow, uneven, and unequal wage growth over the last 40 years epi.org/publication/sw…
Thread of key takeaways from the report.
1/n
Slow wage growth persists: Consistent positive wage growth has occurred in only 10 of the last 40 years. 2/n
Inequality continues: The highest earners (95th percentile) continue to pull away from middle- and low-wage workers. 3/n
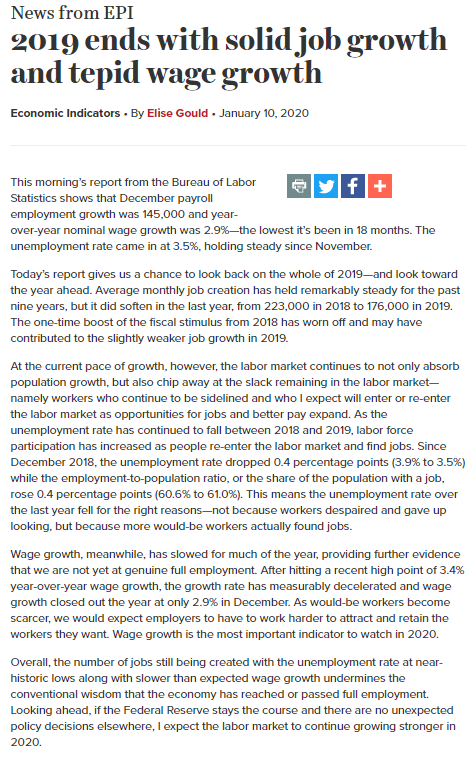
This morning’s report from the Bureau of Labor Statistics shows that December payroll employment growth was 145,000 and year-over-year nominal wage growth was 2.9%—the lowest it’s been in 18 months. The unemployment rate came in at 3.5%, holding steady since November.
2/n
Today’s report gives a look back on all of 2019. Average monthly job creation has held remarkably steady for the past nine years, but it did soften in the last year, from 223,000 in 2018 to 176,000 in 2019, as the one-time boost of the fiscal stimulus from 2018 has wore off. 3/n
In this morning's release on income, poverty, and health insurance for 2018, the Census Bureau data reveal that income growth once again slowed significantly in 2018. census.gov/newsroom/press…
1/n
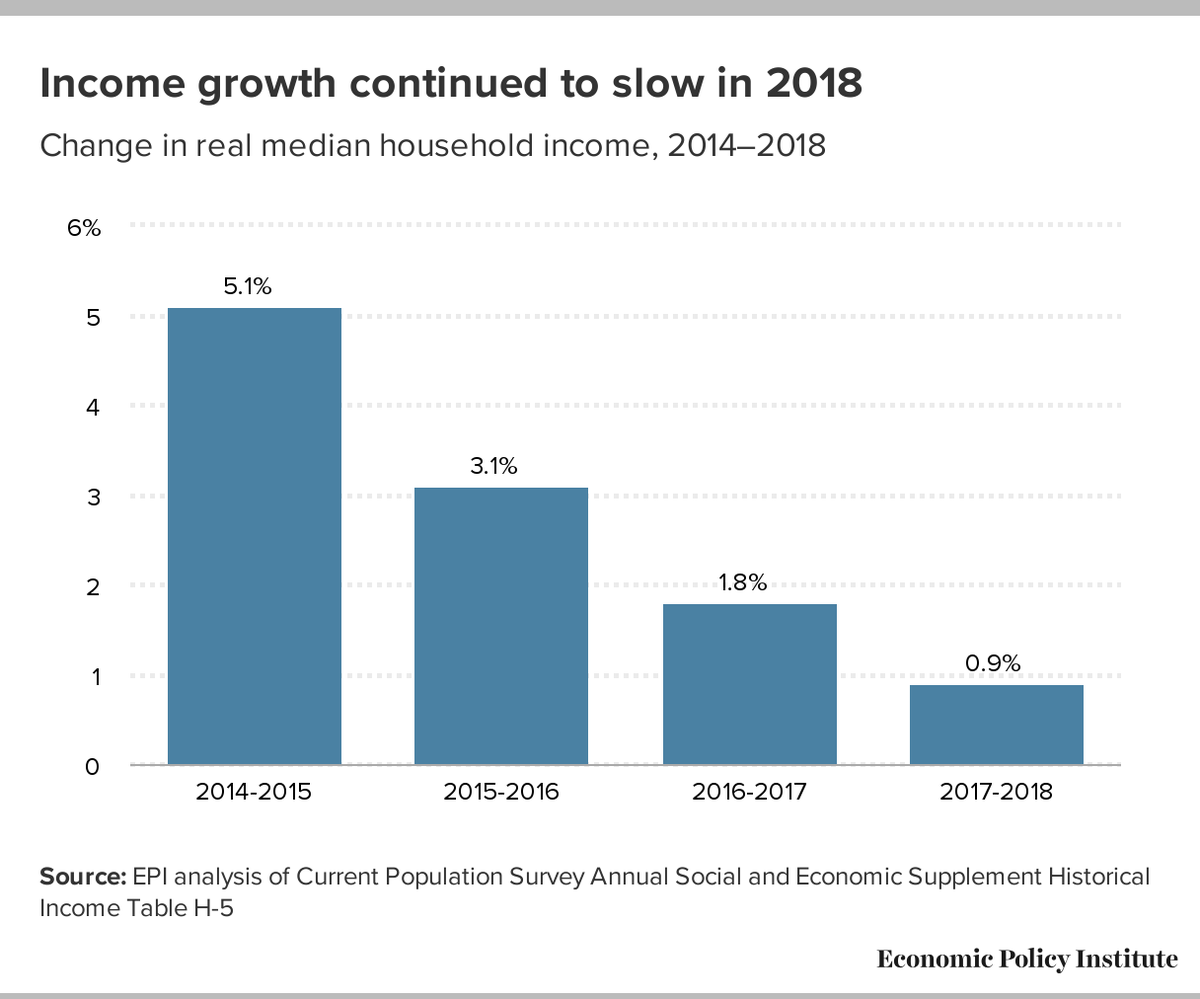
Household income growth significantly slowed again in 2018, following a marked deceleration in 2017. While any reduction in poverty or increase in income is a step in the right direction, most families have just barely made up the ground lost over the past decade.
2/n
Income growth slows significantly again in 2018.
Median household incomes rose only 0.9% in 2018, compared with 1.8% in 2017. In 2016 and 2015, median household incomes grew much faster, at 3.1% and 5.1%, respectively.
Look at this significant slowdown!
via @JuliaWolfe94