
1/ Why the price to sales ratio (P/S) is a useful tool for crypto investors 👇
The price to sales ratio compares a protocol’s market cap to its revenues. A low ratio could imply that the protocol is undervalued and vice versa.
The price to sales ratio compares a protocol’s market cap to its revenues. A low ratio could imply that the protocol is undervalued and vice versa.
2/ The P/S ratio is an ideal valuation method for early-stage protocols, which often have little or no net income.
Instead, the P/S ratio focuses on the usage of a protocol, by tracking the total fees paid (revenue) by the users of its service. More info: tokenterminal.com/faq
Instead, the P/S ratio focuses on the usage of a protocol, by tracking the total fees paid (revenue) by the users of its service. More info: tokenterminal.com/faq
3/ We’re in a historically unique position, with early-stage & high-growth startups operating transparently on-chain.
This transparency makes it possible to find protocols with high usage relative to market cap.
This transparency makes it possible to find protocols with high usage relative to market cap.
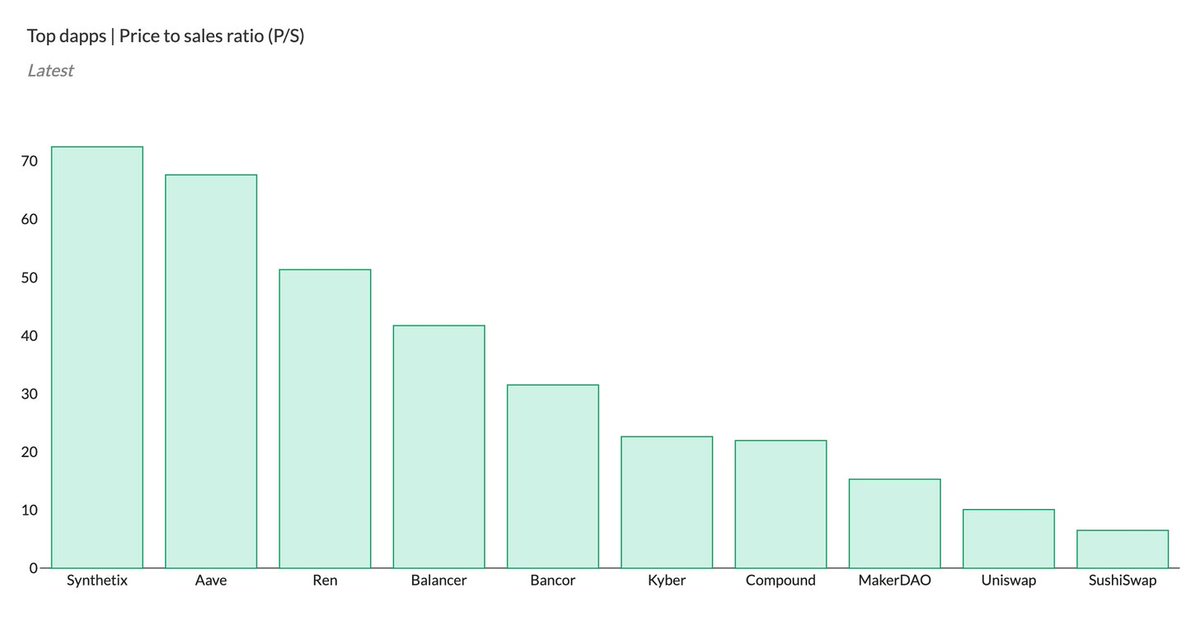
4/ Top dapps from Token Terminal sorted based on the price to sales (P/S) ratio.
Note: Maker has gone from a high P/S ratio to #3 in a matter of months after raising the stability fees for DAI.
Also, two currently similar AMMs (Uniswap & SushiSwap) have the lowest P/S ratios.
Note: Maker has gone from a high P/S ratio to #3 in a matter of months after raising the stability fees for DAI.
Also, two currently similar AMMs (Uniswap & SushiSwap) have the lowest P/S ratios.
5/ Let's look at the P/S ratios from a historical perspective.
The P/S ratio is calculated by dividing a project’s fully-diluted market cap by its annualized revenues.
The metric itself does not tell us about the growth patterns in a protocol’s market cap or revenues.
The P/S ratio is calculated by dividing a project’s fully-diluted market cap by its annualized revenues.
The metric itself does not tell us about the growth patterns in a protocol’s market cap or revenues.
6/ Uniswap’s historical price to sales (P/S) ratio (right Y-axis) and market cap (left Y-axis).
There seems to be a pretty direct correlation between the (low) P/S ratio & market cap --> revenues have been consistently high since the launch of the $UNI token.
There seems to be a pretty direct correlation between the (low) P/S ratio & market cap --> revenues have been consistently high since the launch of the $UNI token.

7/ Uniswap’s historical price to sales (P/S) ratio (right Y-axis) and daily total revenue (left Y-axis).
Uniswap’s daily revenues have been consistently high during Q3-Q4 --> fluctuations in market cap have been the primary driver for changes in the P/S ratio.
Uniswap’s daily revenues have been consistently high during Q3-Q4 --> fluctuations in market cap have been the primary driver for changes in the P/S ratio.

8/ Sushiswap’s historical price to sales (P/S) ratio (right Y-axis) and market cap (left Y-axis).
There does not seem to be a direct correlation between the (low) P/S ratio and market cap.
There does not seem to be a direct correlation between the (low) P/S ratio and market cap.

9/ Sushiswap’s historical price to sales (P/S) ratio (right Y-axis) and daily total revenue (left Y-axis).
Surges in Sushiswap’s daily revenues have trended its P/S ratio lower both during its launch and also more recently.
Surges in Sushiswap’s daily revenues have trended its P/S ratio lower both during its launch and also more recently.

10/ Compound’s historical price to sales (P/S) ratio (right Y-axis) and market cap (left Y-axis).
Compound’s market cap has been stable since the launch of $COMP. Its P/S ratio trended quickly to a low double-digit figure --> revenues spiked after the launch of its token.
Compound’s market cap has been stable since the launch of $COMP. Its P/S ratio trended quickly to a low double-digit figure --> revenues spiked after the launch of its token.

11/ Compound’s historical price to sales (P/S) ratio (right Y-axis) and daily total revenue (left Y-axis).
Compound’s daily revenues spiked up significantly with the launch of the $COMP token and associated liquidity mining.
Compound’s daily revenues spiked up significantly with the launch of the $COMP token and associated liquidity mining.

12/ Kyber’s historical price to sales (P/S) ratio (right Y-axis) and market cap (left Y-axis).
There seems to have been a pretty direct correlation between the P/S ratio & market cap during the early days --> revenues were low initially, but have been on an upward trend since.
There seems to have been a pretty direct correlation between the P/S ratio & market cap during the early days --> revenues were low initially, but have been on an upward trend since.

13/ Kyber’s historical price to sales (P/S) ratio (right Y-axis) and daily total revenue (left Y-axis).
Kyber’s daily revenues were relatively low in the beginning but have been on an upward trend for the past two years.
Kyber’s daily revenues were relatively low in the beginning but have been on an upward trend for the past two years.

14/ Synthetix’s historical price to sales (P/S) ratio (right Y-axis) and market cap (left Y-axis).
After the launch of Synthetix v2, the protocol had a relatively low market cap & high P/S ratio --> revenues were low initially, but have trended upward during the past quarter.
After the launch of Synthetix v2, the protocol had a relatively low market cap & high P/S ratio --> revenues were low initially, but have trended upward during the past quarter.

15/ Synthetix’s historical price to sales (P/S) ratio (right Y-axis) and daily total revenue (left Y-axis).
Synthetix’s daily revenues have been been on an upward trend during Q3-Q4, after a slower start in Q2.
Synthetix’s daily revenues have been been on an upward trend during Q3-Q4, after a slower start in Q2.

16/ Ethereum’s historical price to sales (P/S) ratio (right Y-axis) and market cap (left Y-axis).
Market cap of Ethereum is a long way from the highs of 2017, yet its P/S ratio is on par with leading DeFi protocols --> significant growth in revenues during the past 6 months.
Market cap of Ethereum is a long way from the highs of 2017, yet its P/S ratio is on par with leading DeFi protocols --> significant growth in revenues during the past 6 months.

17/ Ethereum’s historical price to sales (P/S) ratio (right Y-axis) and daily total revenue (left Y-axis).
Ethereum’s daily revenues have been consistently high during Q2-Q4, while its market cap has yet to catch-up with the growth of the Ethereum ecosystem.
Ethereum’s daily revenues have been consistently high during Q2-Q4, while its market cap has yet to catch-up with the growth of the Ethereum ecosystem.

18/ The performance of Token Terminal’s price to sales ratio-weighted index.
It’s one of the first fundamentals-based indexes in the crypto market.
Source: terminal.tokenterminal.com/dashboard/tti
It’s one of the first fundamentals-based indexes in the crypto market.
Source: terminal.tokenterminal.com/dashboard/tti

19/ The historical composition of the TTI index.
It shows that Compound, Uniswap, and MakerDAO currently hold the largest weightings in the index portfolio.
It shows that Compound, Uniswap, and MakerDAO currently hold the largest weightings in the index portfolio.

20/ We recently posted a proposal for the TTI to be included in the @indexcoop product offering — you can view the proposal here:
gov.indexcoop.com/t/token-termin…
gov.indexcoop.com/t/token-termin…
fin/ Check out our newsletter for more DeFi-related insights:
tokenterminal.substack.com/p/the-price-to…
tokenterminal.substack.com/p/the-price-to…
• • •
Missing some Tweet in this thread? You can try to
force a refresh


